I love to cycle during my free time and the weather is always something we need to check before heading out. Unfortuantely I can be a bit absent-minded on this and many times I chose a route that was going to rain, which usually means I have to cut my session short, especially if the rain is too heavy. Of course, there are many weather related apps and services which can help me with this, but naturally, I was keen to build my own custom solution.
The idea is to find a source of weather forecast data, build an ETL pipeline to take this data, store it somewhere before delivering the weather forecasts in a way that is convenient to me, such as through an email or link that I can access easily. A task orchestration tool will be used to ensure that this entire process is done regularly.
This writeup will cover the following parts:
- System design
- Instructions on how to use this repo
- Conclusion
For the data source, I discovered that data.gov.sg has an API that allows us to fetch the 2hr and 24hr forecast data of Singapore, so I will be using that as the data source. The code that handles the logic of making the API request and wrangling the data into a pandas DataFrame is found in forecast.py, under utilities.
Next, I was considering how to store the data, as well as how to go about using a task orchestration tool to handle the ETL process. I decided to use this project as an opportunity to familiarise myself with a cloud computing service, in this case, Google Cloud Platform (GCP), due to its relatively generous free tier and trial period.
As such, I decided to go with GCP’s BigQuery as the data storage solution. Although the scale of this project is unlikely to be able to make full use of BigQuery, it is still a learning opportunity for me to familiarise myself with a data warehouse. The schema used can be found in schema.py.
For task orchestration, Apache Airflow is a commonly used tool in the Data Engineering space, in part due to the fact that it is open source. However, it might seem that setting up an instance of Apache Airflow, even locally, can be cumbersome to manage. Conveniently, GCP has a service called Google Cloud Composer, which is a managed instance of Apache Airflow, so I will be using this. The airflow DAG used can be found in forecast_dag.py
With Cloud Composer set up, we now have weather forecast data regularly loaded into BigQuery. Now, it is time to figure out how to deliver this data.
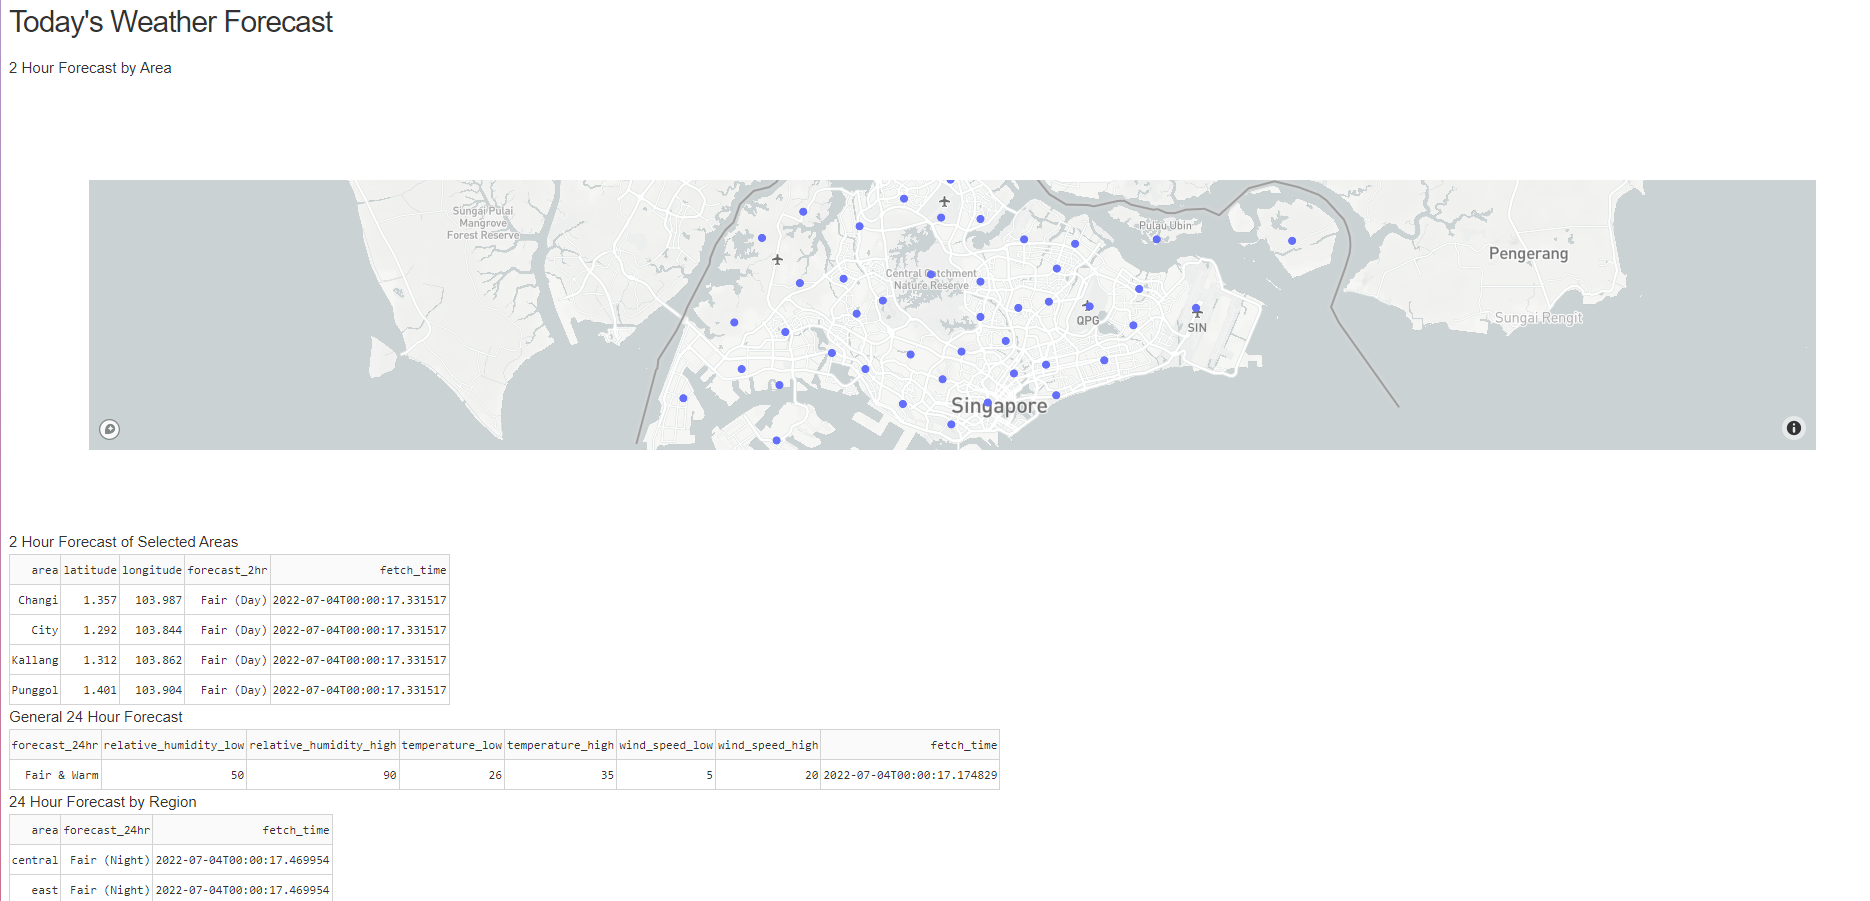
To visualise the weather forecast data, I decided to use Plotly and Dash. Dash is a framework created by Plotly for interactive web applications. Plotly itself is a well-known data visualisation tool in Python, so I thought this setup will work well. Since Dash can create a web app to display the weather forecast, I decided to use Google Cloud Run to deploy the web app. Again, since the bulk of this project is already on GCP, it will be convenient to use Google Cloud Run. Google Cloud Run is a compute platform that allows us to run and deploy containers, without the hassle of infrastrcuture management. We do this by setting up a Dockerfile with instructions on how to deploy the app.
An email will also be sent out through each successful run of the DAG, with an EmailOperator defined in the DAG that uses the SendGrid API.
To summarise, here is a diagram showing the system design of this project.

Requirements:
- GCP account, with BigQuery, Google Cloud Composer, Google Cloud Storage, Google Cloud Run, Google Cloud CLI & SendGrid API enabled
- GCP service account with permissions for all the above services
- Mapbox API access token for the Plotly visualisations used in the web app
- Create a Google Cloud Composer instance. forecast_dag.py and utilities should go into the dags/ folder of the bucket in Google Cloud Storage that belongs to the instance of Google Cloud Composer created.
- The plotly-dash folder is used to build the web app. Navigate to the folder and run the following commands in the terminal to upload into Google Cloud Run:
gcloud builds submit --tag gcr.io/PROJECT-ID/plotly-dash --project=PROJECT-ID
gcloud run deploy --image gcr.io/PROJECT-ID/plotly-dash --platform managed --project=PROJECT-ID --allow-unauthenticated
The link to the web app can be found here.
Note: I may have to shutdown the app when my trial credits run out :(
Although this setup currently works very well, there is definitely room for improvement to increase the scope of this project.
- The web app design is currently very simple, we could improve the design.
- We can look for other sources of weather forecast data and incorporate it into our system in order to validate the forecasts and improve its accuracy. (I'm sure we have all been let down before by an inaccurate weather forecast....)
Nevertheless, this project has been helpful in keeping me abreast of the daily weather forecast, while also getting to explore new technologies. Thank you for reading!