Can't discern CPU/RAM utilization on 6.6... just a solid gray bar #2944
Comments
|
Not sure if this is the SAME issue or something unique to my specific configuration (already captured in previous issue #2885. UPDATE- tested in chrome and same UI issue so my older Safari deployment seems irrelevant. While I do like the new summary graphic at the top w/CPU & Memory, I now have NO data displayed for any of my running containers though changing the sorting on a column DOES changed the ordered list so I ASSUME there is data that is simply not being rendered to the page. Screenshot below and config in link above. Let me know if I can assist. Regressing container for now to reenable previous functionality. |

|
Hi @taw123 @truthsword thanks for the quick feedback! Yea, a lot changed to improve performance. But I am not done yet.
This is coming back in 6.0.1. I just didn't get a chance. The old bar chart was using animation which was increasing browser CPU a lot more than needed. @taw123 something changed which is worth explaining. Maybe worth reverting. Let me try to explain. Before the progress bar was from 0 to 100%. If a container is using one core then it is 100% which means the bar would be at a 100%. Now the max range of the bar is n x 100%. So if a container is using 5%, it would actually be 5 / 1200. That's a very small number which is why you don't see anything. I think this change made an assumption that many containers do use more than 100%. But maybe that doesn't make sense. I am thinking of reverting since not many do. And in case of more than 100%, it will just be a full progress bar. |
|
Can you all try |
|

|
OK merging for now. Let me know if I should release next version. |
|
Haven't heard back but I think the new version looks good to release so closing this. |
|
Apologies for the delay I was/am dealing with some ZFS issues that are taking more of my time then I would like. I pulled 6.6.2 and had a thought.... Perhaps it might make sense given higher core based systems to all for a USER preference for the bar graph basis... For example I am on a 6 core(REAL core) system that supports hyper-threeading so thus you would see it as a 12 system. Given that you are calculating based upon 1200 (never going to get ANYWHERE near that number before smoke would pour out but I digress).... In my case I would rather have the bar graph base 100 as NORMALLY individual process are in the love single for say 20 range with occasional bursts up to near 50. Apps that are non HEAVY load of course go over 100 so for me seeing little to no data for most things is good I'm ok with the individual graph going only to 100 sinceee I can immediately look over to the discreet value if I see a fat bar. Sorry a bit long winded but thought it was useful to point out WHY I preferred the old approach. Since you are tweeting this actively and I would like to help if I can, I'll stay on current in the hope you either go back to the old approach or just make it a user config option in the UI. --Tom Current UI on my system 
|
|
@taw123 I already went back to the old behavior. Your screenshot seems to represent that too as 60% is almost half full bar. Right? Or do you see something else? I think keeping the denominator at 100 makes sense as majority of processes will never go over one core. Perhaps in the future I'll make the bar red or something when over 100%? |
|
Those gray bars only make things less obvious for me, |

|
Sorry, not understanding. Do you mean the gray bars making it confusing and removing the bar would be better? Not sure what others think. I am just using a regular ol' HTML progress bar which is better performance. I think it would look weird if the gray background was removed. |
|
Ahhhhh. perhaps color blondness strikes again? Until you mentioned it I didn't notice the incredibly subtle difference in color... perhaps you could add a greater luminescent delta btw the indicator/SHADED color and the background of the UNSHADED indicator/slider. You mentioned something about choosing red as well? Again of not default let user pick color? Sorry I wasn't clearer |
Upgrade to 6.6 replace CPU/RAM percent value with a “progress bar”. But since many of my containers run <3%, their values are indeterminable on a 0 to 100 scale, so nearly all appear “zero”.
Rolled back to 6.5.2 to see this:
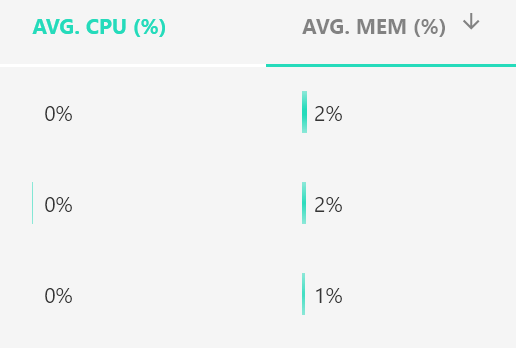
Is it possible to revert to numerical values? Thank you.
The text was updated successfully, but these errors were encountered: