Simple Package to help evaluate bids in markets/auctions.
] add OptimalBidsThe framework used is based around the dispatch of the following functions for specified markets (subtypes of the core abstract type Market):
build_market, change_bids!, clear_market!, calculate_profit (see docstrings for more info - e.g. @doc change_bids!). I.e. these are the functions that need to be implemented for each market type.
In addition, the functions profit_for_bid!, profit_curve! are implemented in a reasonably generic way, allowing users to dispatch them with any new market. (see docstrings for more info - e.g. @doc profit_for_bid!).
In order to exemplify some of the functionalities available, let's use the interface with PowerModels.jl implemented in the submodel PowerModelsMarkets.
using OptimalBids
using OptimalBids.PowerModelsMarkets
using Clp # Market Clearing Solver
using Plots # For some evaluation plots at the end
#=
CASE DEFINITION
=#
# Read market data from IEEE 118 bus case
case_name = "case118.m"
network_data = PowerModels.parse_file(case_name)
# Pretend we are a company constructing a new set of generators in the grid.
# Choose a percentage of the total number of buses to install the new generators:
percentage_buses = 0.09
# We need the keys PowerModels uses to reference the appropriate buses in it's network data dictionary.
# First, find out all available keys:
bus_indexes = collect(keys(network_data["bus"]))
# Then, calculate number of buses that consitute the chose percent (`percentage_buses`):
num_buses = length(bus_indexes)
num_strategic_buses = ceil(Int, percentage_buses * num_buses)
# To avoid any biases let's grab some generators in the middle:
bus_indexes = bus_indexes[21:(21 + num_strategic_buses - 1)]
# Finally, add new generators to the network grid data and collect their reference keys.
generator_indexes = [
add_generator(network_data, parse(Int, bus_idx)) for bus_idx in bus_indexes
]
#=
PACKAGE USAGE
=#
# Define market
market = build_market(
PowerModelsMarket,
network_data,
generator_indexes,
Clp.Optimizer,
)
# New generators are added with 0.0 max capacity (a.k.a bid/offer), so lets change their volume offers:
initial_bids = rand(num_strategic_buses)
change_bids!(market, initial_bids)
# Now we can simulate the market:
clear_market!(market)
# and evaluate the gross profit (and cleared volums and prices):
calculate_profit(market)
# To avoid hassle, we made a function that calculates profit for any set of bids/offers:
new_bids = rand(num_strategic_buses)
profit_for_bid!(market, new_bids)
# and a function to evaluate a vector of possible bids sequentially:
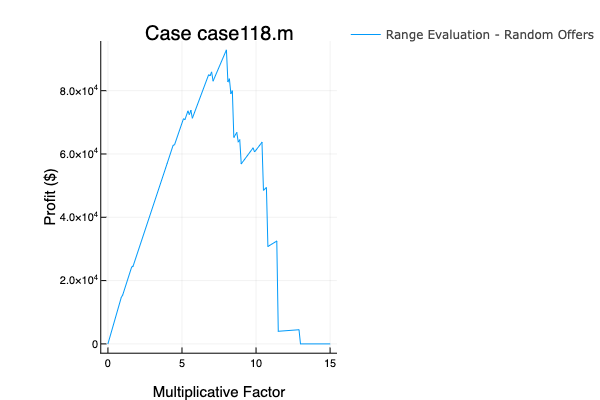
range_mul_factor = 0.0:0.1:15.0
bid_range = [initial_bids .* [i] for i in range_mul_factor]
p_curve = profit_curve!(market, bid_range)
# Let's plot and see how the range profit evaluatiuon went:
plot(collect(range_mul_factor), p_curve,
title="Case $case_name",
label="Range Evaluation - Random Offers",
ylabel="Profit (\$)",
xlabel="Multiplicative Factor",
legend=:outertopright,
)