This repository contains a set of scripts aiming at producing architectural drawings in Rhino3D with more control on lineweights and plots styles. It has been built on the principle of CTB function of AutoCAD.
We are taking the CTB function from AutoCAD as an example of managing plot styles.
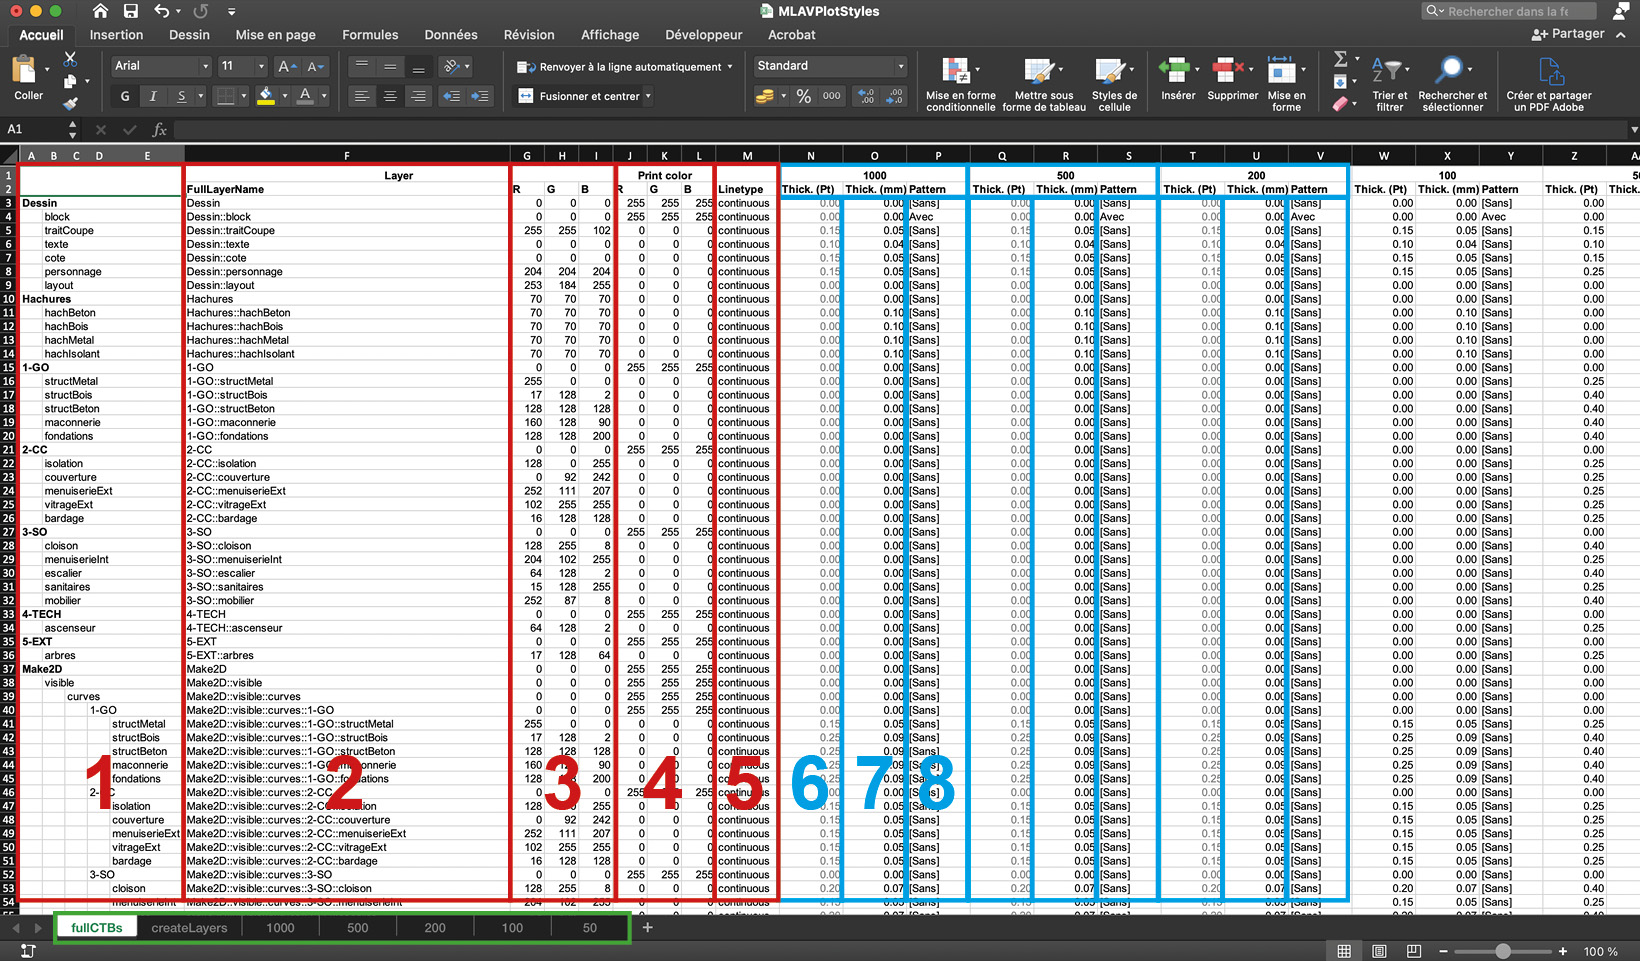
Here, instead of a CTB file, the data is stored in an Excel file MLAVPlotStyles.xlsx.
In red are the global informations, and in blue are the informations specific to each scale (1:1000 ; 1:500 ; 1:200 ; 1:100 ; 1:50):
- Layer hierarchy
- Full layer names
- Layer color
- Layer print color
- Layer linetype
- Line thickness (in pt)
- Line thickness (in mm)
- Pattern (for Illustrator only)
- Then we created a worksheet (createLayers) that recaps the full layer names and their rgb colors (will be used for step 3). And finally we created a worksheet for each scale, that recaps only the information of the specific scale (will be used for step 2).
The MakePlotStyles.py script generates three kinds of outputs that will be used in the next steps:
- Will be used for step 3 :
layers.csv(according to the createLayers worksheet in Excel) - Will be used for step 4 :
1000.csv;500.csv;200.csv;100.csv;50.csv(plot styles for each scale) - Will be used for step 5 :
1000.js;500.js;200.js;100.js;50.js(plot styles for each scale). These files are created to be used in Illustrator.
The CreateLayers.py script creates layers from the layers.csv list in Rhino3D.
We know we could use a Rhino3D template file to create this, but in our practice, we find it more practical to generate our working layers this way.
The SetPlotStyles.py script assigns values of print color and lineweights to each layer in Rhino3D.
For this step we used this .rvb script as a starting point. We recreated it in python, and changed it a bit.
The user runs the python script, chooses an option of scale (1:1000, 1:500, etc) in a popup, and the script loads the right .csv file to apply the right plot style to each layer.
These files are generated by the script in step 2. They are used in the following case : something has been drawn in Rhino, but the layout and plot styles are handled in Illustrator.
When the exported Rhino file is opened in Illustrator, the .js script will apply the same plot styles as the one created for Rhino.