asm_sysvec_apic_timer_interrupt attributed wrongly to arbitrary stack trace? #710
-
|
Hi,
The affected stack traces are attributed ~3% execution time, but only when As I have no clue whether async-profiler already discerns Linux-specific stack frames, but my intuition here would be that it would be more appropriate if (Related discussion at Quarkus, where I already mistook those 3% to be caused by the Java stack trace: Techempower benchmark spends 4% of time in volatile field access? #30473 |


Beta Was this translation helpful? Give feedback.
Replies: 6 comments 4 replies
-
|
Just FYI a similar stack trace appear in a very old but still good ap issue -> #14 (comment) |
Beta Was this translation helpful? Give feedback.
-
|
This seems to be a problem only with flamegraphs. In an HTML dump (also taken with
|

Beta Was this translation helpful? Give feedback.
-
|
OK, by looking at the HTML sourcecode of the flamegraphs I found out that The phenomenon then is that across both flamegraph and HTML dumps taken, there is a ~3%-7% bubble moving around below a common call tree ancestor (io/netty/buffer/PoolThreadCache$MemoryRegionCache.allocate) , and with each profiling session, async-profiler attributes it to a different subtree of that. I retried with half of the profiling interval ( |
Beta Was this translation helpful? Give feedback.
-
|
It's true that an interrupt handler may run in the context of an arbitrary thread at an arbitrary point of time. |
Beta Was this translation helpful? Give feedback.
-
|
Thanks Andrei and I 👍 on it. In the mentioned Quarkus discussion I've said
Hence, this is wrong? The apic irqs are not related ap? |
Beta Was this translation helpful? Give feedback.
-
|
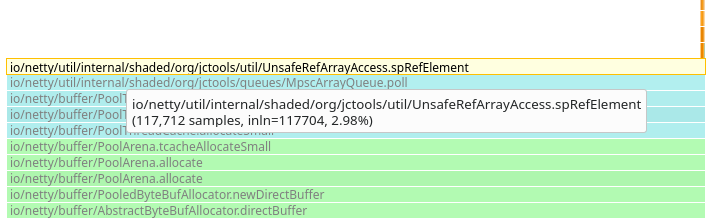
Thank you for your answer @apangin . Sorry for the confusion, but I now think the phenomenon isn't related to APIC timer interrupts at all. I had jumped to that conclusion earlier because the flamegraphs show native stack traces within The remaining phenomenon, though, is a mysterious 3% - 4% that is attributed to a different Java method with each profiling session for the same workload. The tiny orange spot on the right is 0.01% for (Using
E.g. the first method looks like this: To me it remains totally unclear what it is actually spending time on, and similarly for the other methods. The only thing they seem to have in common is their call tree ancestor io/netty/buffer/PoolThreadCache$MemoryRegionCache.allocate. Do you per chance have an idea as to what might cause this phenomenon? |


Beta Was this translation helpful? Give feedback.
-
|
We've already spoken about it in the quarkus discussion: prior to the spRefElement, the JCTools queue is using a lock cas to update the producer sequence and is very likely the instruction to be blamed, which inlining of methods right next to him confuse the profiler, making it to pass unnoticed. |
Beta Was this translation helpful? Give feedback.
-
|
If by "lock cas" you are referring to |
Beta Was this translation helpful? Give feedback.
-
|
In that case, it can be due to card marking, but requires print ASM and perf to find the guilty line of code.I think this is outside this discussion here, anyway :) |
Beta Was this translation helpful? Give feedback.
-
|
OK, I now caught two of the three candidates in the same flamegraph. Previously it was always only one of them, and that's what I found so suspicious. It turns out that all three candidates are somewhere close to volatile field accesses that prevent CPU register and cache usage, which explains the long bars without further details in the flamegraphs:
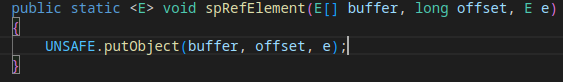
@franz1981 pointed out that it is due to method inlining and "skidding" that async-profiler cannot attribute cycles e.g. to public E poll()
{
[..]
spRefElement(buffer, offset, null); // CPU cycles attributed here in flamegraph
soConsumerIndex(cIndex + 1); // inlined method invocation with volatile field access via Unsafe.putOrderedLong()
// where CPU cycles are *actually* spentThis is described in section "Error Margin: Skidding + inlining" in The Pros and Cons of AsyncGetCallTrace Profilers and "A Confusing Reality" in How Inlined Code Makes For Confusing Profiles: Sure, the profiler pointed to line A, but any fool can see the problem is line B... silly little hobbit. |
Beta Was this translation helpful? Give feedback.
OK, I now caught two of the three candidates in the same flamegraph. Previously it was always only one of them, and that's what I found so suspicious.
It turns out that all three candidates are somewhere close to volatile field accesses that prevent CPU register and cache usage, which explains the long bars without further details in the flamegraphs:
lvProducerLimit()- returns a volatile fieldLongAdder.add()- ends up inVarHandle.compareAndSet(), which has memory semantics ofsetVolatile()spRefElement()- its invocation inpoll()is followed bysoConsumerIndex()that ends up inUnsafe.putOrderedLong(), which behaves like volatile field access@franz1981 pointed out that it is due …