This is a simple radar chart package to quickly use and visualise radar charts using a single function.
from radar_chart.radar_chart import radar_chart
import matplotlib.pyplot as plt
import numpy as np
from random import random
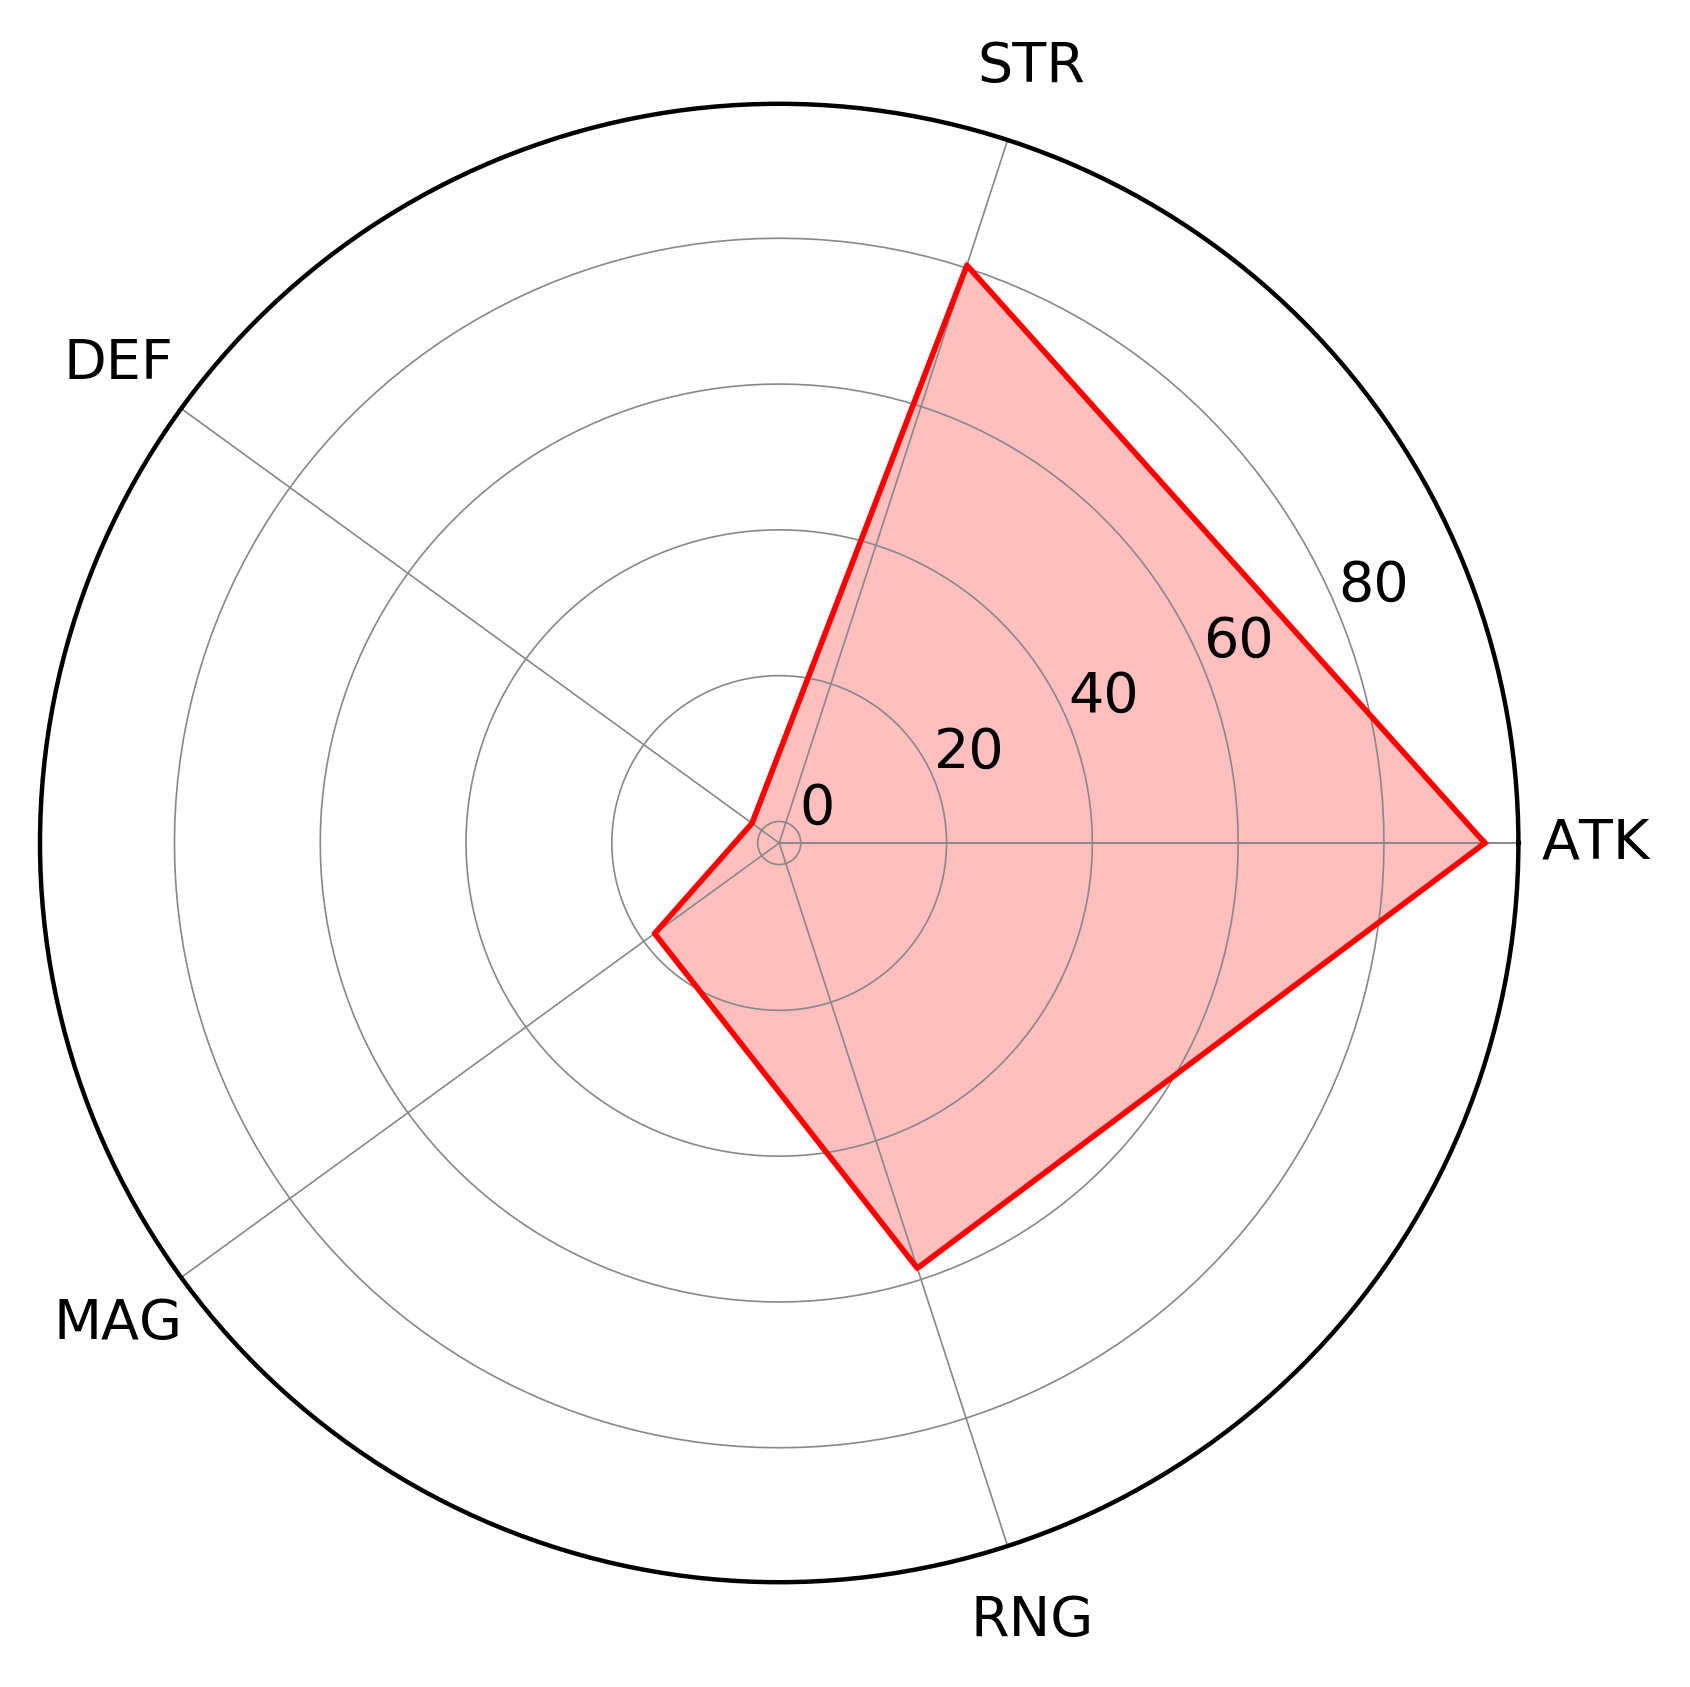
labels = 'ATK STR DEF MAG RNG'.split()
values = [random()*100 for i in labels]
radar_chart(values, labels, line_color='red', fill_color='red')
plt.show()
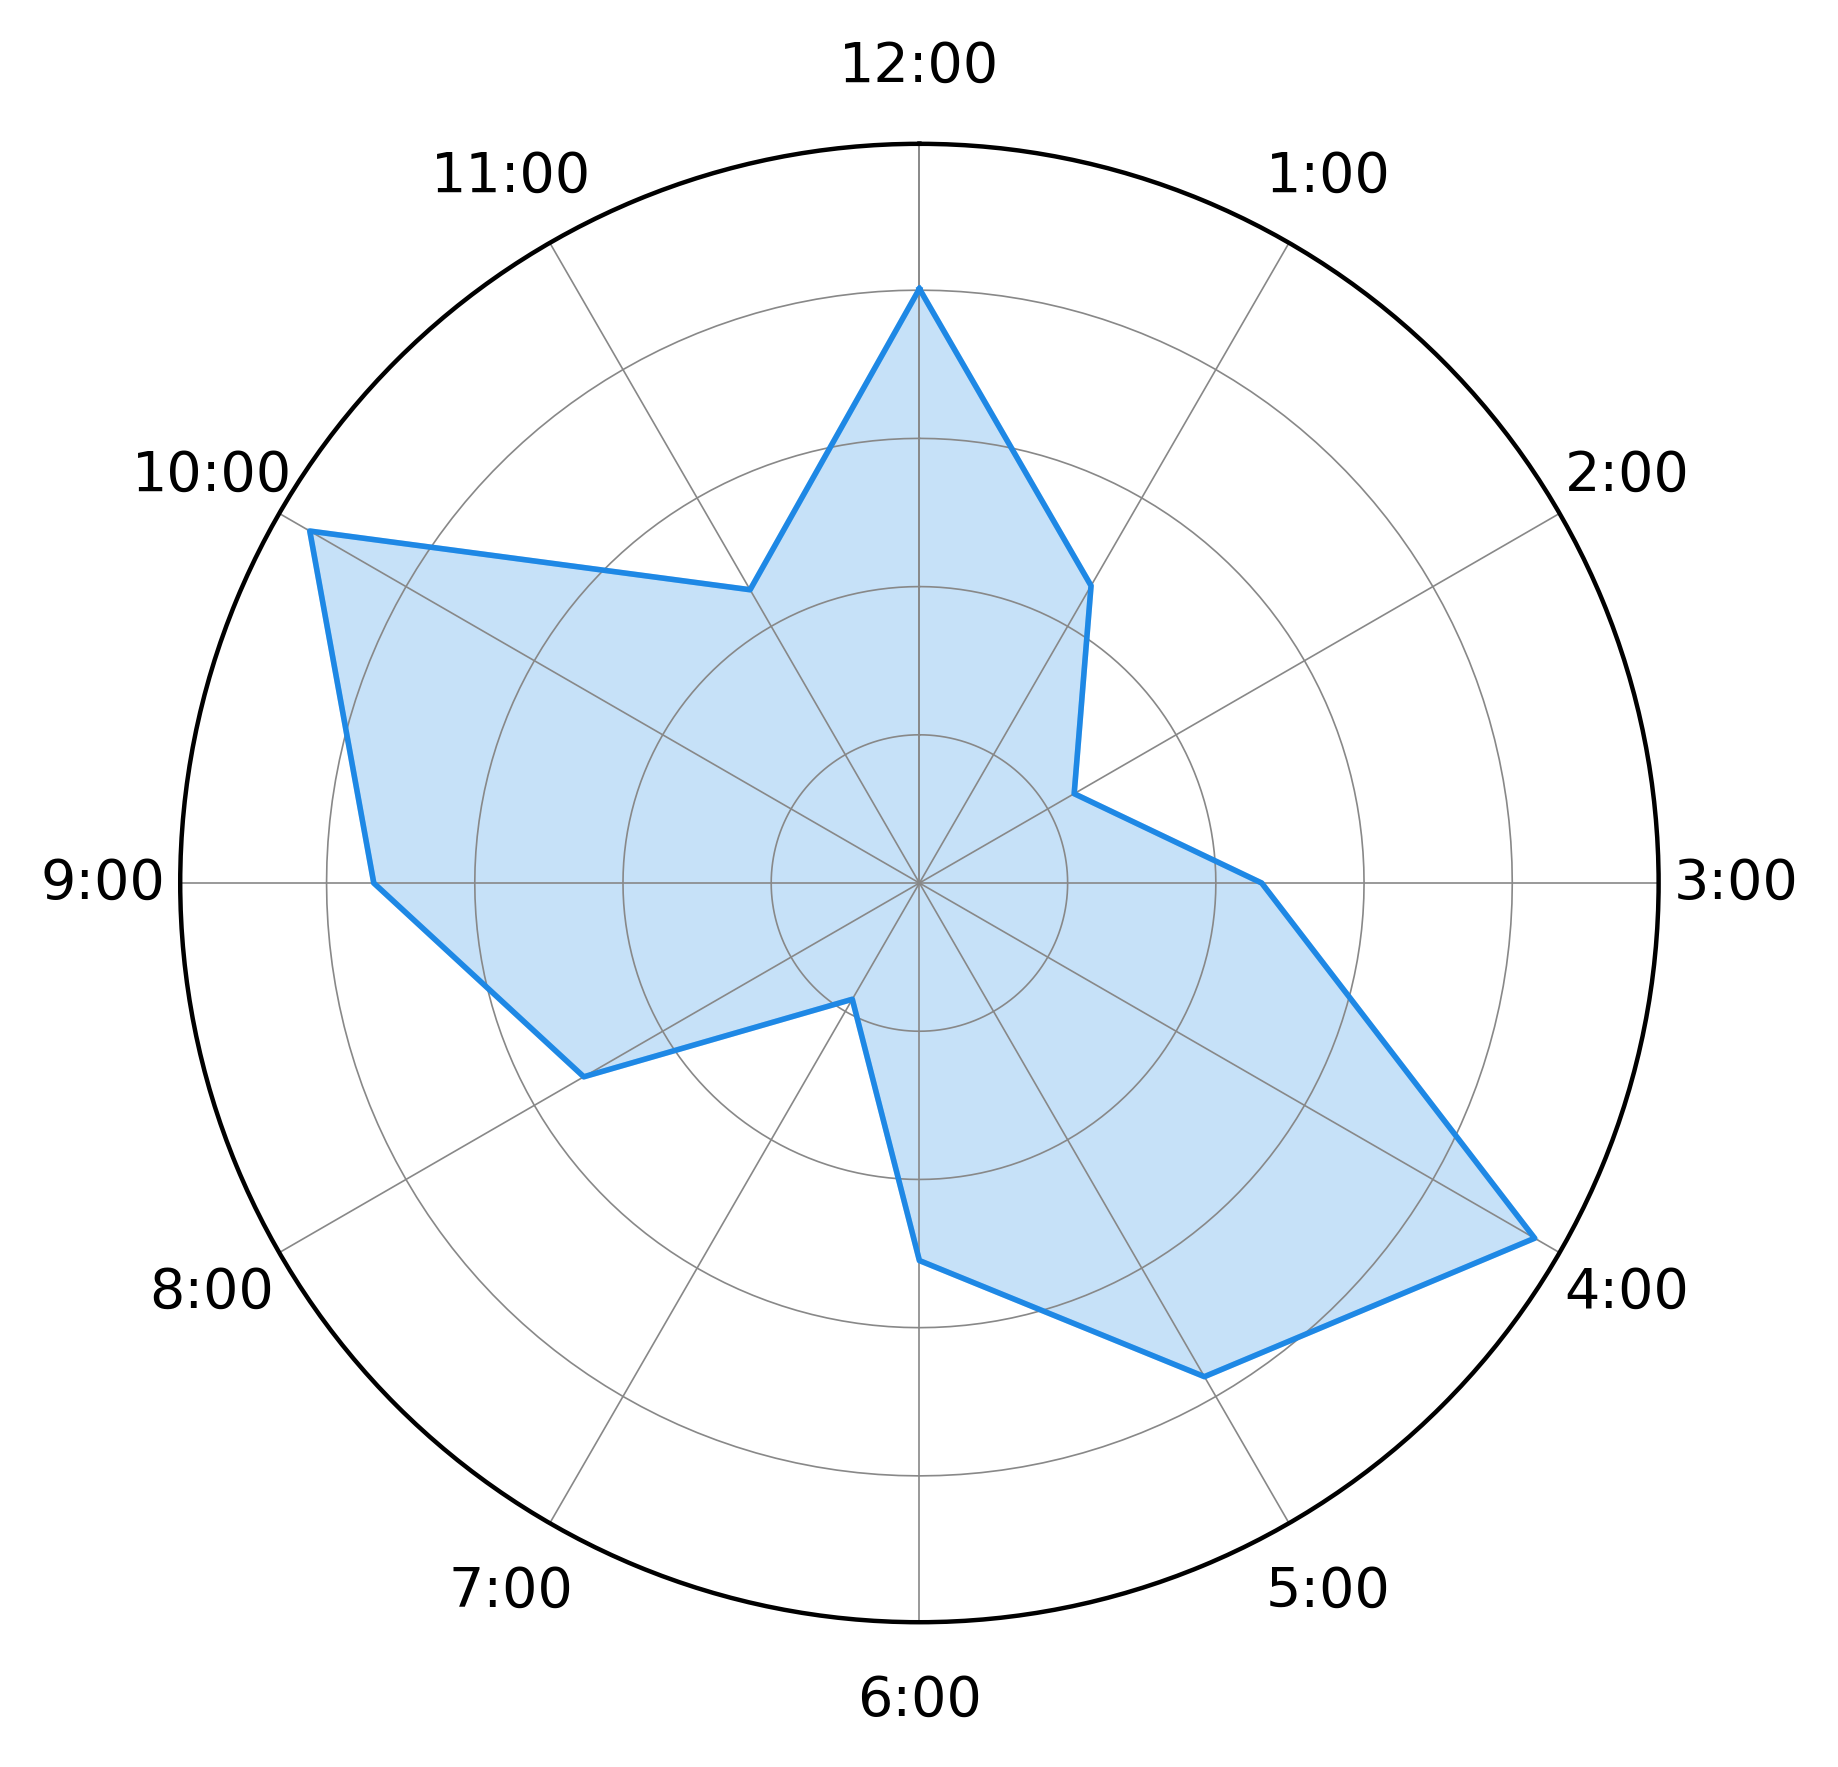
labels = [str(i) + ":00" for i in range(1,13)][::-1]
values = [random()*1000 for i in range(len(labels))]

radar_chart(values, labels, y_ticks=False, rotate=90)
plt.show()
stats: sequence of scalarcat_labels: sequence of string, defaultNone. Labels for each value instratsline_color: string, default#1E88E5. Defines the line color that joins the plotted values.fill_color: string, default#1E88E5. Defines the fill color of the plot area.marker: string, defaultNone. Marker style e.g.+,x,o.marker_alpha: float between 0-1, default1. Sets the transparency of the marker (0: Transparent, 1: Opaque).fill_alpha: float between 0-1, default1. Sets the transparency of the fill of the plot area (0: Transparent, 1: Opaque).rotate: float, default'Degrees'. Default setting does nothing. Accepts degrees (which is converted to radians) and rotates the plot clockwise.reverse_rotationbool, defaultFalse. Direction of the plot is reversed ifTrue.y_tickssequence of scalar/string or bool, defaultTrue. Default will set y-tick labels according tostatsvalues. No y-tick labels ifFalse. Sets sequence as y-tick labels if sequence.x_tickssequence of scalar/string or bool, defaultTrue. Default will set y-tick labels according tocat_labelsvalues. No y-tick labels ifFalse. Sets sequence as x-tick labels if sequence.gridlinebool, defaultTrue. Removes gridlines ifFalsegridline_colorstring, default'#888888'. Defines the color of the gridlines.gridline_widthfloat, default0.3. Defines the width of the gridlines.