
![]()
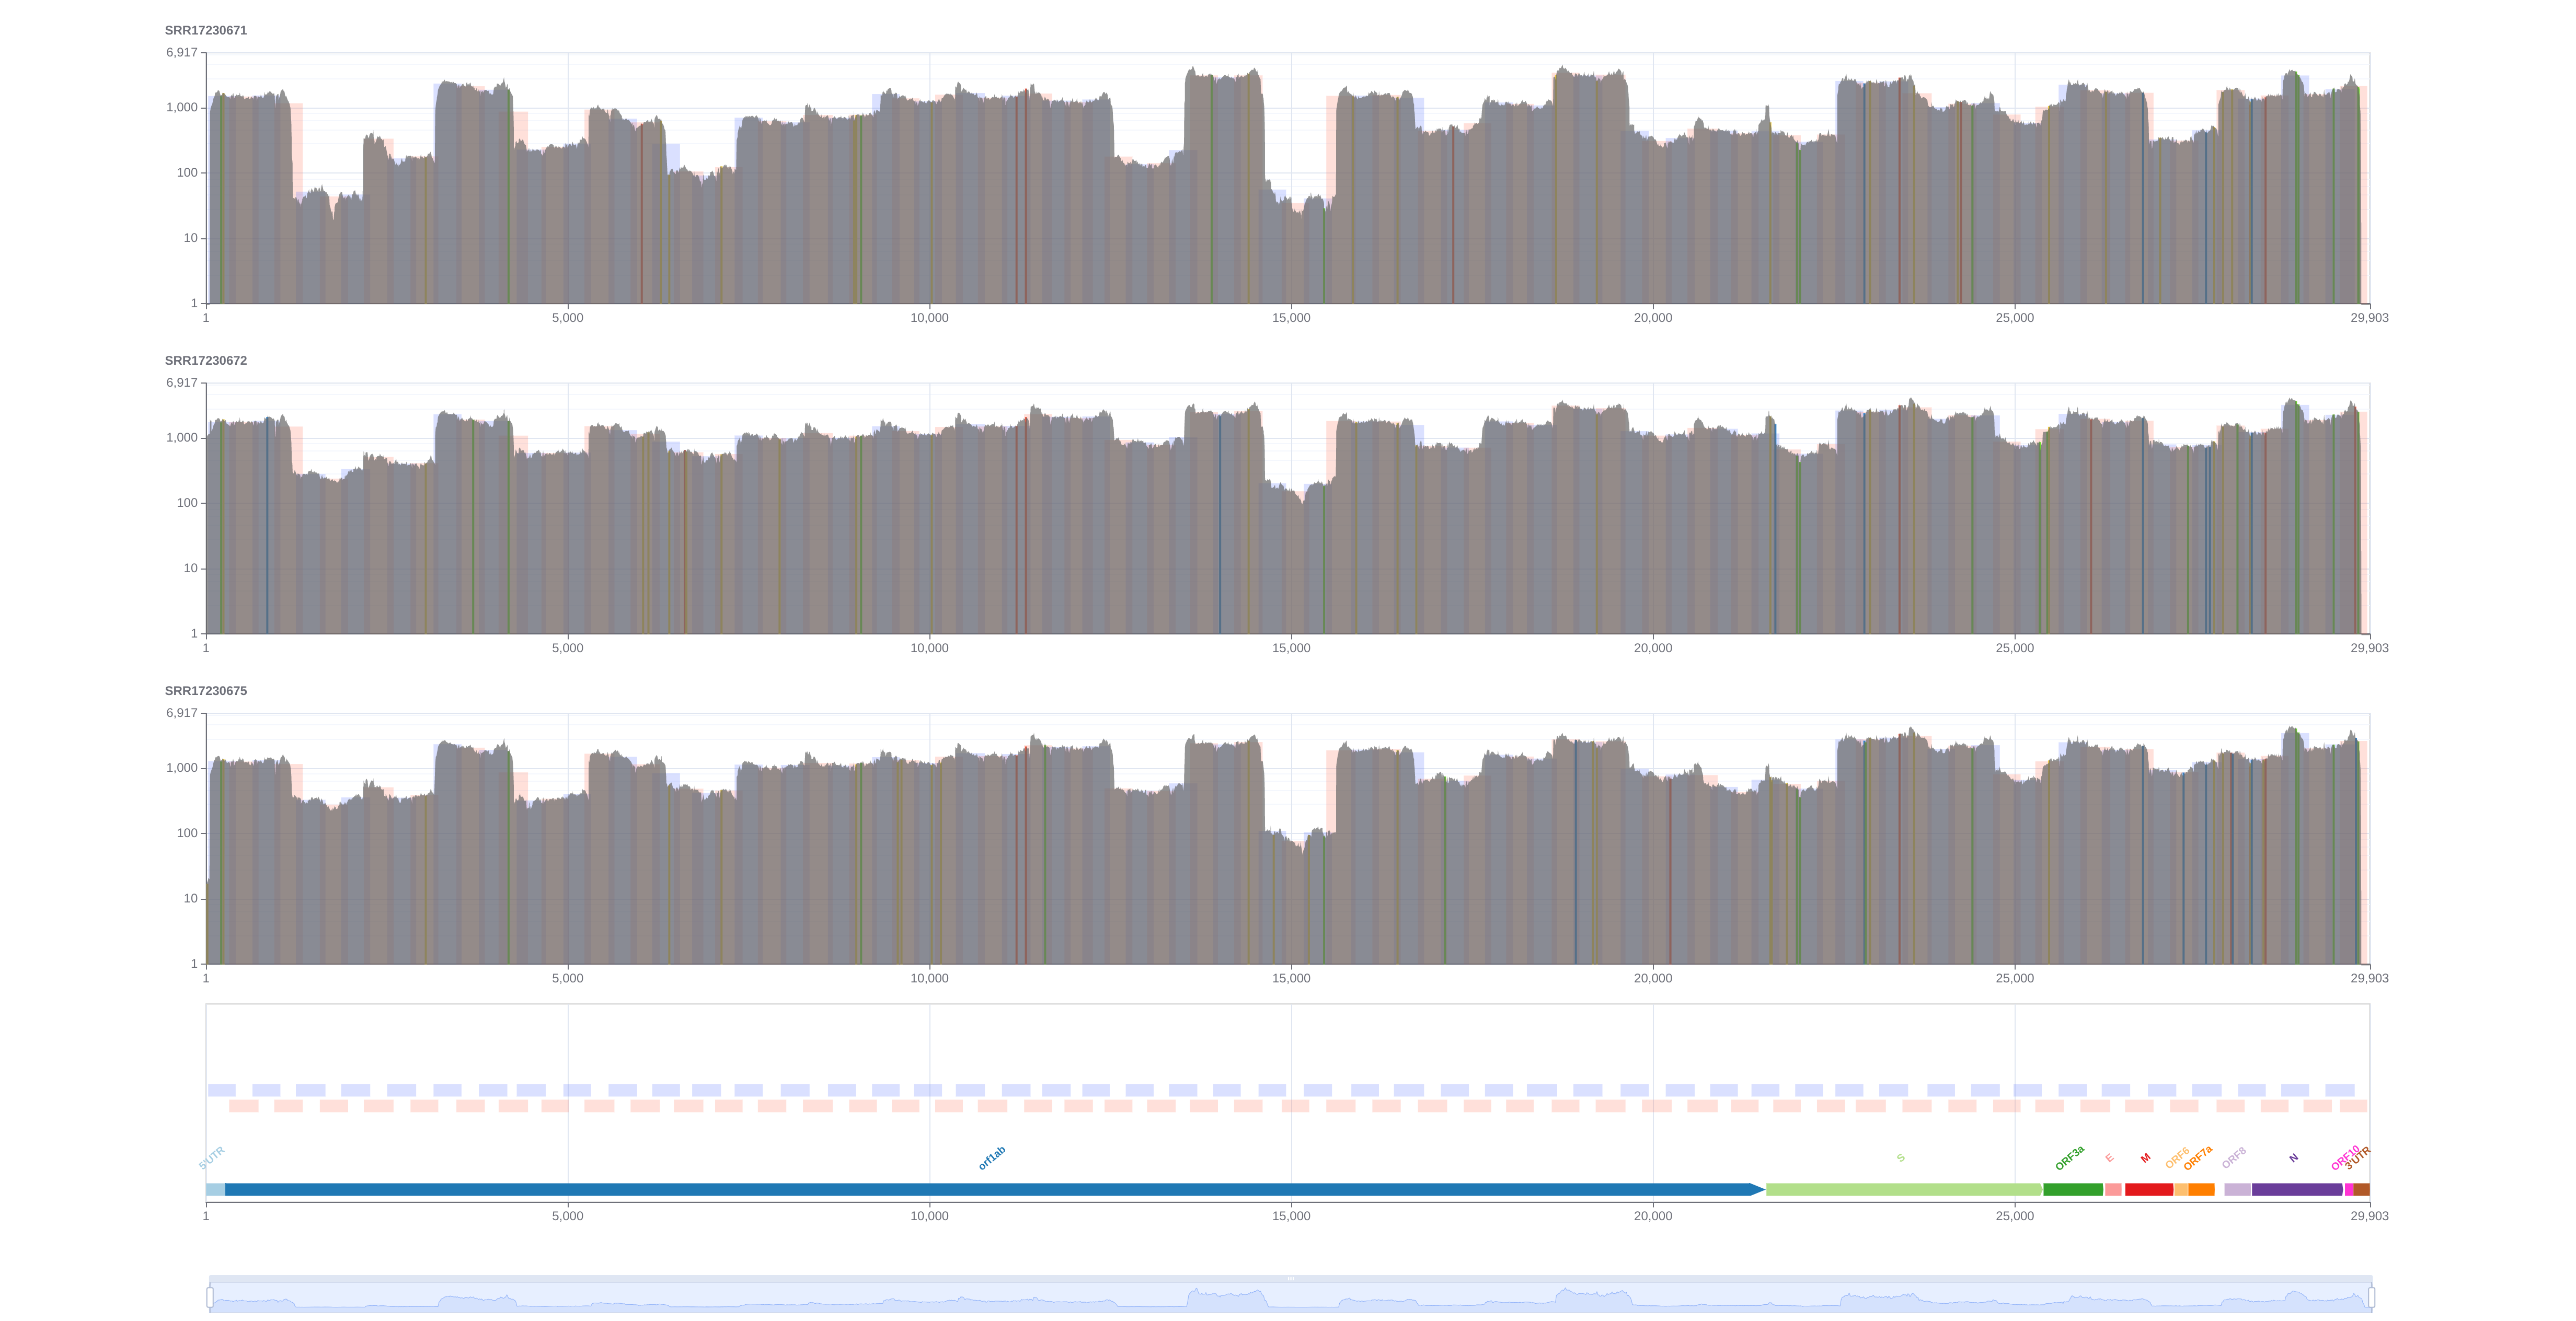
wgscovplot generates interactive comparative sequencing coverage plots in self-contained, offline-friendly HTML files with optional annotation of variant calling results, PCR amplicon coverage and genetic features.
Install from PyPI with pip
pip install wgscovplot
If the installation was successful, you should be able to type wgscovplot --help and get a help message on how to use the tool.
Clone the wgscovplot repository.
git clone https://github.com/nhhaidee/wgscovplot.git
Then change directory to wgscovplot and install.
cd wgscovplot
python setup.py install
- Compare sequencing coverage across multiple samples
- Fully-interactive plots with informative tooltips highlighting variant calling results and coverage statistics across all samples being shown
- Easy-to-use: Simply provide a nf-core/viralrecon, peterk87/nf-virontus Nextflow workflow results directory as input (
wgscovplot --input-dir /path/to/viralrecon/results) andwgscovplotwill figure out what files it needs to generate its interactive sequencing coverage plots - Annotate coverage plots with variant calling results from multiple different variant callers (iVar, Nanopolish, Longshot, Medaka) and variant effect results from SnpEff/SnpSift
Basic usage will output a wgscovplot.html file in the current directory:
wgscovplot --input-dir /path/to/viralrecon/resultsSpecify an NCBI Accession ID
wgscovplot \
  --input-dir /path/to/viralrecon/results \
  --ncbi-accession-id MN908947.3
Show help info with $ wgscovplot --help:
Usage: wgscovplot [OPTIONS]

Options:
  --input-dir PATH                Nextflow workflow results directory
                                  [required]
  --output-html PATH              Output File of Interactive HTML Coverage
                                  Plot  [default: wgscovplot.html]
  --ref-seq PATH                  Path to reference sequences
  --genbank PATH                  Genbank file contains gene features
  --ncbi-accession-id TEXT        NCBI accession id to fetch gene features
                                  and/or reference sequences
  --low-coverage-threshold INTEGER
                                  Low Coverage Threshold  [default: 10]
  --amplicon / --no-amplicon      Plot Amplicon Coverage Depth  [default:
                                  amplicon]
  --gene-feature / --no-gene-feature
                                  Plot Gene Features  [default: gene-feature]
  --gene-misc-feature / --no-gene-misc-feature
                                  Plot Miscellaneous Features  [default: no-
                                  gene-misc-feature]
  --dev / --no-dev                Run tool with debug mode  [default: no-dev]
  --verbose / --no-verbose        Verbose logs  [default: no-verbose]
  --version / --no-version        Print wgscovplot version and exit
  --install-completion [bash|zsh|fish|powershell|pwsh]
                                  Install completion for the specified shell.
  --show-completion [bash|zsh|fish|powershell|pwsh]
                                  Show completion for the specified shell, to
                                  copy it or customize the installation.
  --help                          Show this message and exit.
- Python (>=3.8)
- Javascript
- Development Lead: Peter Kruczkiewicz
- Software Developer: Hai Nguyen
Copyright 2021 Canadian Food Inspection Agency of Canada, Government of Canada.
Licensed under the Apache License, Version 2.0 (the "License"); you may not use this work except in compliance with the License. You may obtain a copy of the License at:
http://www.apache.org/licenses/LICENSE-2.0
Unless required by applicable law or agreed to in writing, software distributed under the License is distributed on an "AS IS" BASIS, WITHOUT WARRANTIES OR CONDITIONS OF ANY KIND, either express or implied. See the License for the specific language governing permissions and limitations under the License.