This program displays Life Expectancy data using Processing, and Unfolding Maps API.
It uses LifeExpectancyWorldBank data in CSV format and it can be found at http://data.worldbank.org.
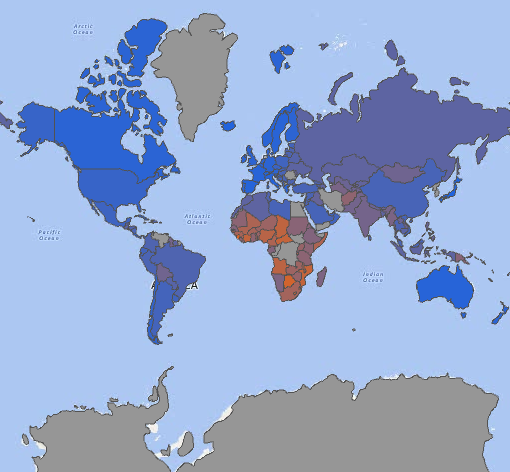
The methodology to represent Life Expectancy was to color each country with high life expectancy with cool colors such as dark blue, and going towards warm colors as the expectancy drops, like red.
To underline the map and countries, a helper file countries.geo.json was used. This program also uses:
- Android Location api, and is under The Apache 2.0 license. This API uses Geolocation to display data in different points of the map.
- Unfolding Maps api. It provides maps from several sources. ex. Google, Microsoft, Yahoo, etc.
- Processing Library. Applet to display graphics on the screen.
This is what the program displays: