-
Notifications
You must be signed in to change notification settings - Fork 8
System Latency OS 5.6.10 rt5
$ uname -a
Linux scexaortc 5.6.10-rt5 #1 SMP PREEMPT_RT Tue May 19 07:53:57 UTC 2020 x86_64 x86_64 x86_64 GNU/Linux
Note: cpupower, turbostat do not install on custom kernel.
Latency tests use rt-tests' cyclictest to deploy as many threads as there are cores. Stress tests (heavy load) use stress-ng.
Test script is in the bin directory
$ runtestrt XXXX Y
# XXXX: test index. Output files will containt this index
# Y stress mode. 0: no stress. 1: stress
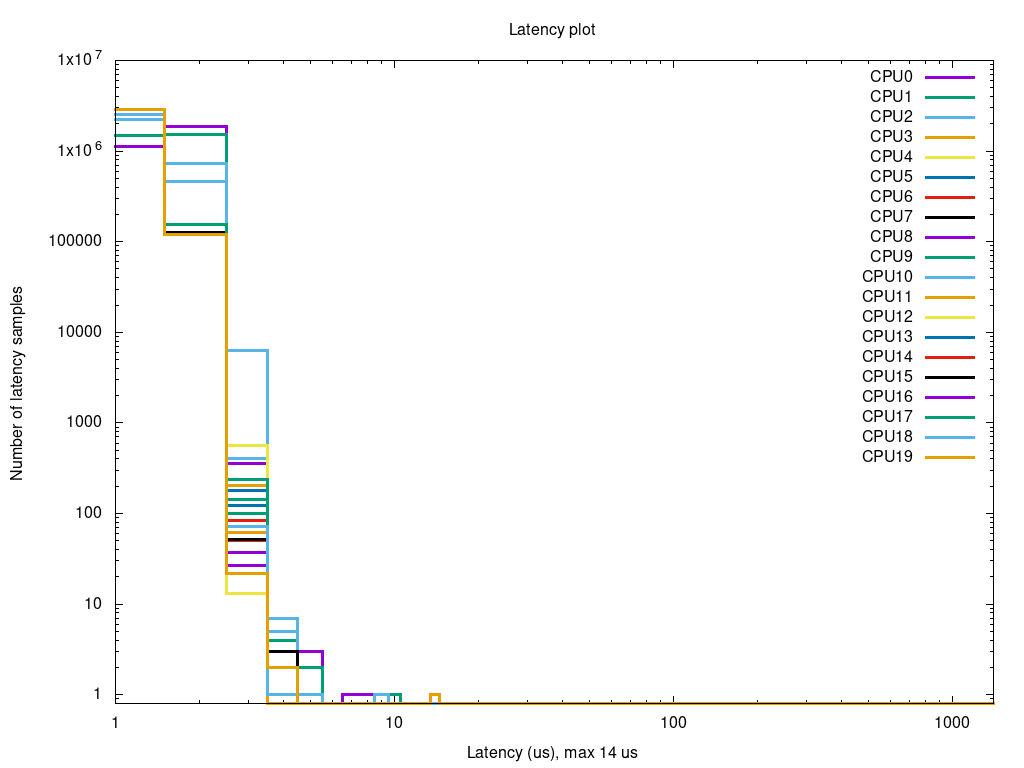
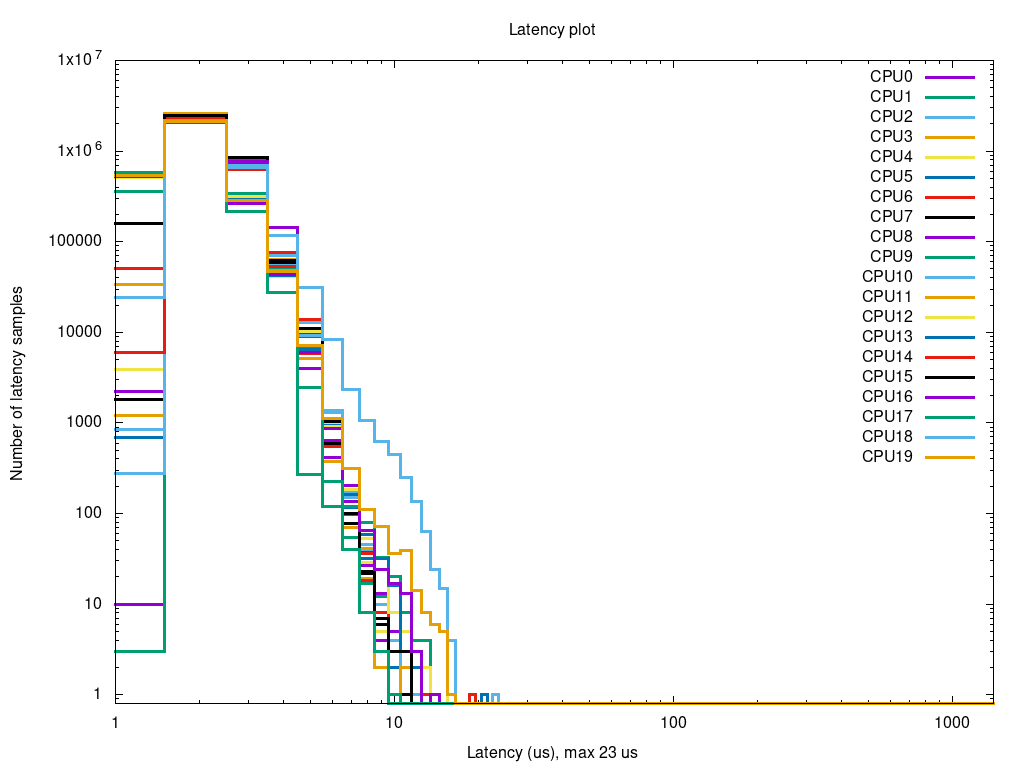
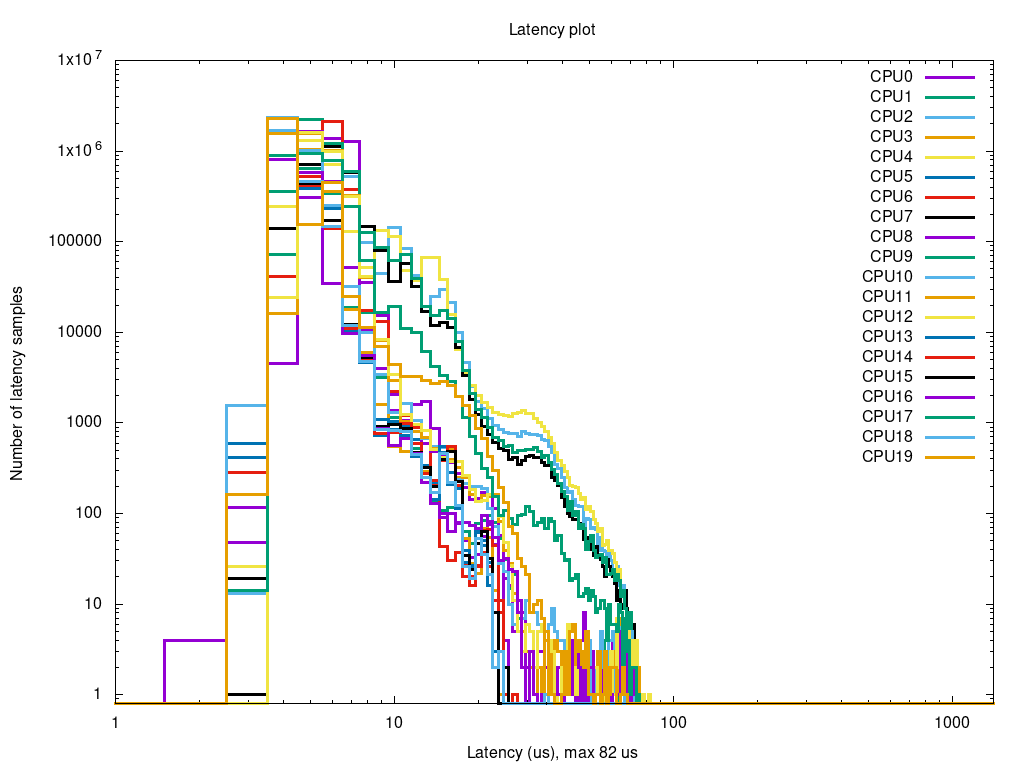
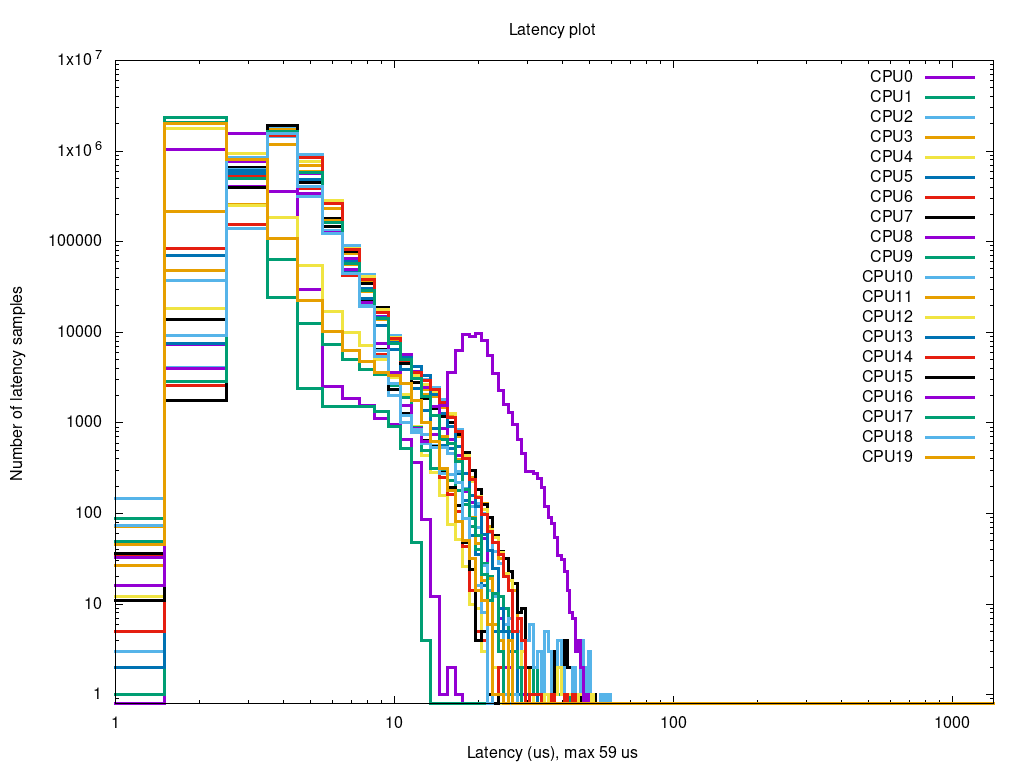
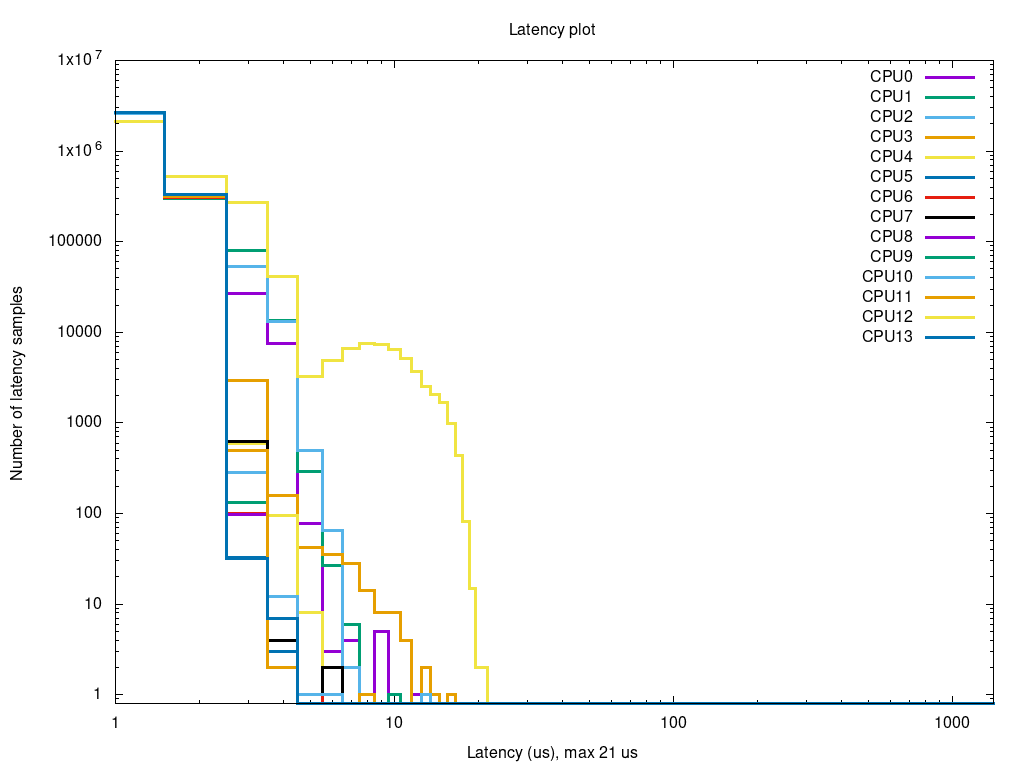
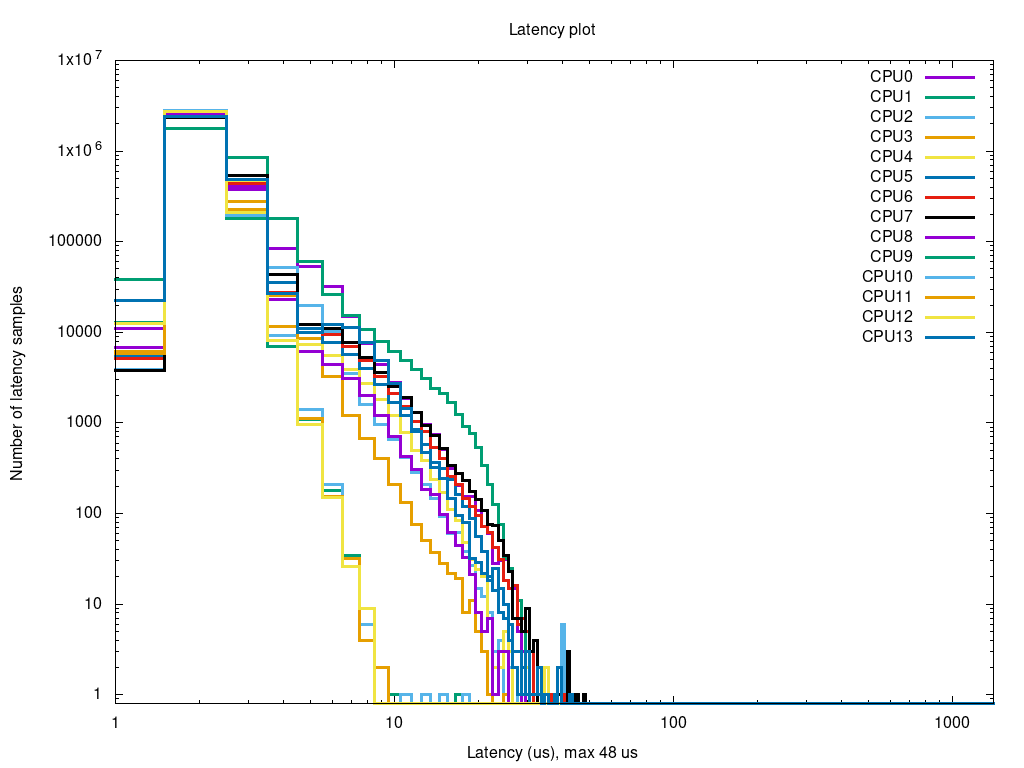
Those tests allow to see monitor the general latency of the system, and also to estimate when cores actually got a significant interrupt (trailing humps in the curves).
[CURRENT] First, we build a set of shielded cpus for the purpose of this testing, with 20 cores in and 16 cores left for general purpose. This 16-20 split is what is used for the CACAO RTC. This is done at runtime with cset:
$ sudo cset shield --kthread=on --cpu 16-35
$ cset set
cset:
         Name       CPUs-X    MEMs-X Tasks Subs Path
 ------------ ---------- - ------- - ----- ---- ----------
         root        0-35 y     0-1 y   956    2 /
         user       16-35 y       0 n     0    0 /user
       system        0-15 y       0 n   321    0 /system
The important part is those 321 tasks we managed to move away from our favorite CPUs 16-35... there are still 956 tasks that could be anywhere and we cannot move.
[ALTERNATIVE] We set isolated cpus right from the kernel launch options; this is done by adding - either in the GRUB_CMDLINE_LINUX_DEFAULT or editing the kernel launch line once in grub:
isolcpus=16-35 nohz=on nohz_full=16-35
We're are trying to avoid as many scexao-specific scripts for this tutorial, but many of the commands provided here are factored in the AOloop/SystemConfig script
Of all the parameters roughly tested - either with cset or isolcpus:
echo performance | sudo tee /sys/devices/system/cpu/cpu*/cpufreq/scaling_governor

echo 0,000001ff | sudo tee /proc/irq/default_smp_affinity
echo 0,000001ff | sudo tee /proc/irq/*/smp_affinity

echo 1000 | sudo tee /proc/sys/vm/stat_interval
echo 5000 | sudo tee /proc/sys/vm/dirty_writeback_centisecs

echo 0 | sudo tee /sys/devices/system/machinecheck/machinecheck*/check_interval
echo 0 | sudo tee /proc/sys/kernel/watchdog
echo 0 | sudo tee /proc/sys/kernel/nmi_watchdog

echo -1 | sudo tee /proc/sys/kernel/sched_rt_runtime_us
It seems that of those, the following may suffice (but moving the IRQs is a good idea too):
echo -1 | sudo tee /proc/sys/kernel/sched_rt_runtime_us
echo performance | sudo tee /sys/devices/system/cpu/cpu*/cpufreq/scaling_governor
Note: we do not add a
echo 0 | sudo tee /dev/cpu_dma_latency
for the tests, it is actually included in the cyclictest call.
For other operations, a sudo setlatency 0 & should be let run in the background for that purpose. The setlatency binary is the scexao-org/Real-Time-Control repository.
# Reenable the cpufreq throttling
echo ondemand | sudo tee /sys/devices/system/cpu/cpu*/cpufreq/scaling_governor
# And re-allow the reserved window for non-RT tasks
echo 950000 | sudo tee /proc/sys/kernel/sched_rt_runtime_us
runtestrt is available in scexao-org/Real-Time-Control.
[CURRENT]
runtestrt automatically detects a cset named "user" and runs everything on it - stressors and monitors.
[NOT USED] In case of using isolcpus we move our login shell onto the isolated CPUs, and set its scheduling policy to SCHED_RR. SCHED_RR is required for children to access all isolated CPUs and not just the first one. But this is dangerous... as the stressors become RT priority, and can lock us out of the machine due to them consuming all kernel time. This is not entirely debugged.
$ sudo taskset -p -c 16-35 `echo $$`
$ sudo chrt -r  -p 1 `echo $$`
Now for running
$ runtestrt [00XX] [0|1] 900
WARNING: other problems arise with the isolcpus tougher isolation mode (+ RT kernel), something that looks like drifting clocks after > 30 min uptime, with minimal measured latencies > 8 us. Not really debugged. Reverted to using cset at runtime.
The following are latency histograms for 10-minute tests, unloaded and under CPU stress. Cyclictest running at 5 kHz, polling each core at 200 us intervals. For stressed tests, the stressing command roughly is:
stress-ng --cpu $NBcores --io $NBcores --timeout $((${DURATION} + 15))s &
spawing 2 threads per core: one cpu stressor, one IO stressor. See runtestrt for how this is wrapped properly for starting in a cset or on given taskset affinity pool.
WARNING: Ideally, we'd also spawn one memory stressor thread with --vm $NBcores --vm-bytes 20G. This features of stress-ng, used on the two other kernels in this wiki, seems completely broken on 5.6 (or on this install at least), and inevitably leads to kernel panics and system lockdown. So we had to take it out.
See the last section for a little test relating to cpu + memory though.
This is done with a taskset - the difference with a cset is that we do not benefit from the cset utility moving away all processes that can be.
As runtestrt detects and prefers the existence of a cset named user, we need to destroy the latter (or we could have changed its name, let's do this):
$ sudo cset shield -r
$ sudo cset shield --kthread on --cpu 16-35 --userset=other
$ cset set
cset:
         Name       CPUs-X    MEMs-X Tasks Subs Path
 ------------ ---------- - ------- - ----- ---- ----------
         root        0-35 y     0-1 y   956    0 /
       system        0-15 y       0 n   368    0 /system
        other       16-35 y       0 n   368    0 /other


$ sudo taskset -p -c 2-15 `echo $$`
pid 3423's current affinity list: 2-15
pid 3423's new affinity list: 2-15
Overall, results are just slightly slower than on the cset. Of course, the system is not doing much during those tests, so there is way less concurrent activity on the 16 general-purpose CPUs than if, eg, graphical sessions were running.
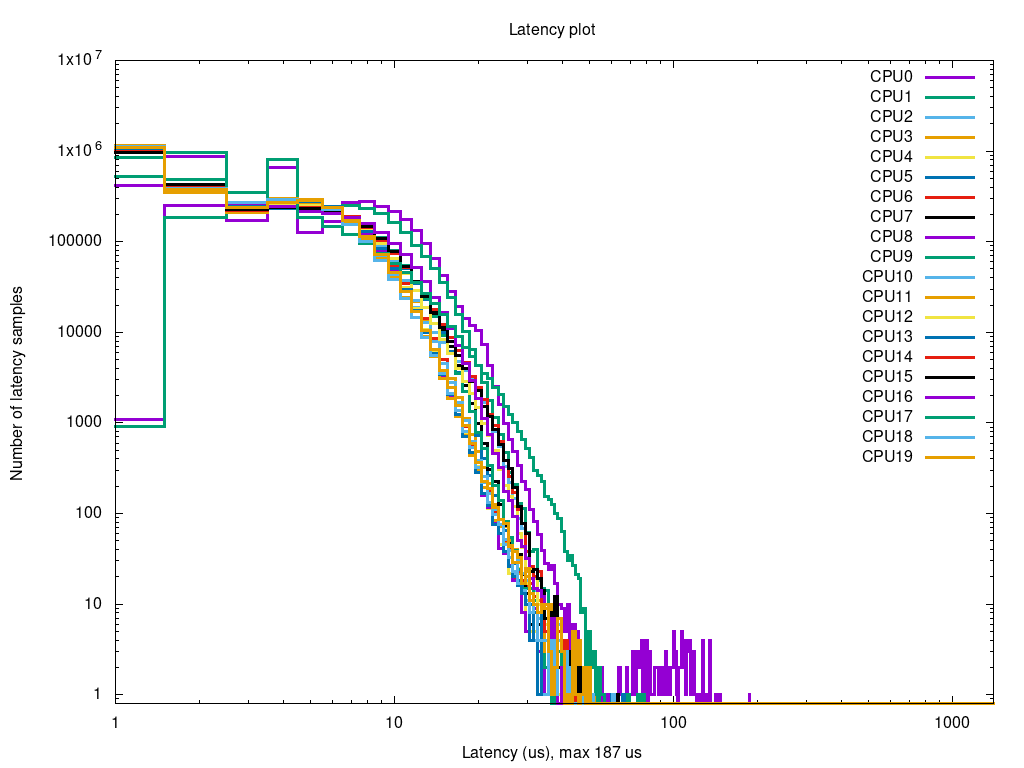
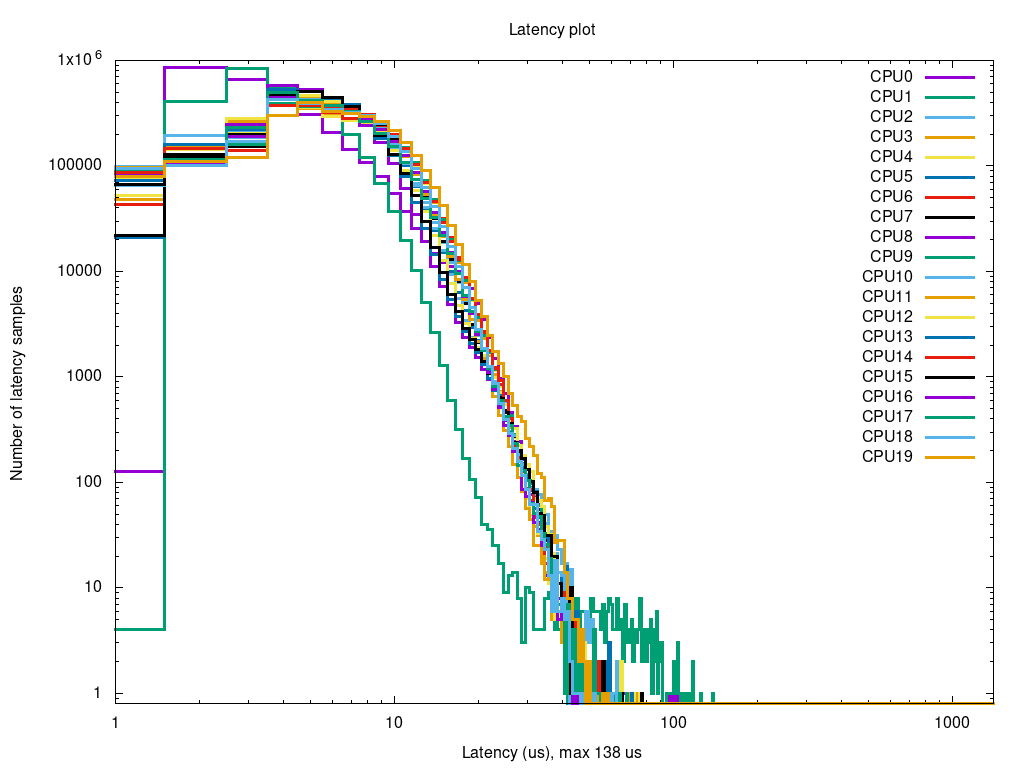
As a compensation to not using stress-ng for memory, we can stress CPU+memory with other tools. Here is a brief example, using numpy performing 30000x30000 matrix products on 20 shielded cores as a stresser.
As can be inferred from all the tests performed, this shape of the distribution tail is definitely typical of memory-bound stress latency.
compute and control for adaptive optics (cacao) - https://github.com/cacao-org/cacao
- Real-Time OS install
- OS Performance Tuning
- Real-time OS benchmarks:
- GPU drivers and tools
- cacao Performance