Stats
FIR has a statistics module that should be able to respond to most reporting needs. It breaks down into six main modules:
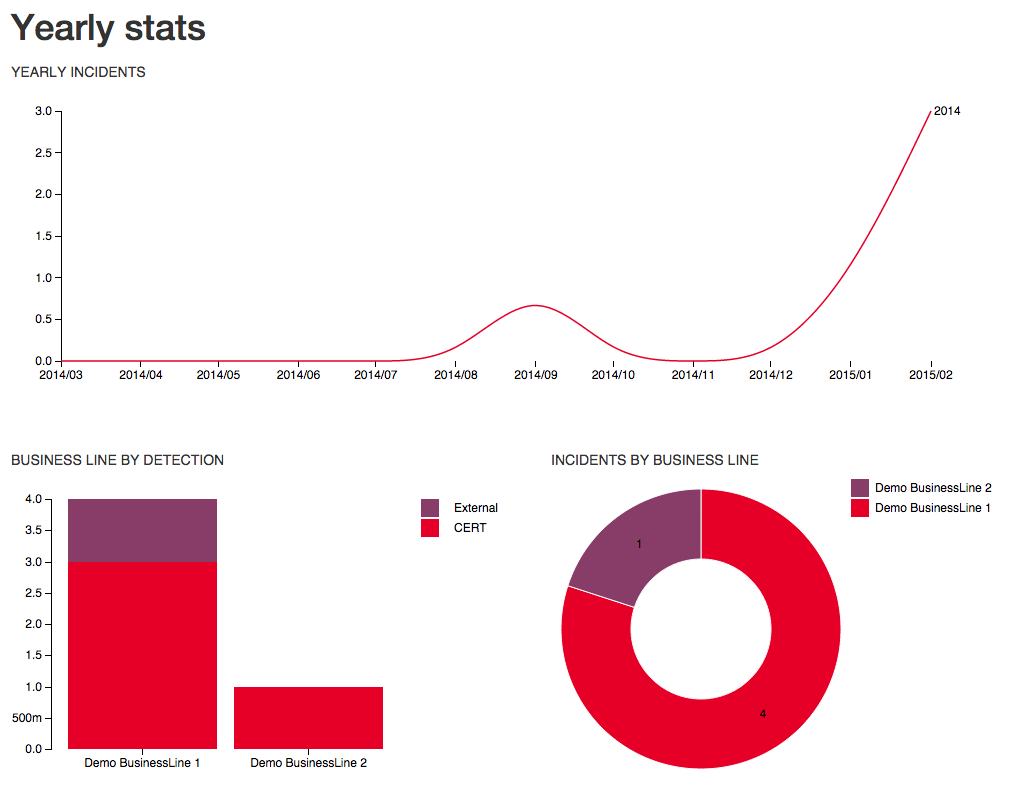
This is a yearly view of incidents and events in FIR. Different graphs show the same data broken down by category, severity, origin of detection, and business line.
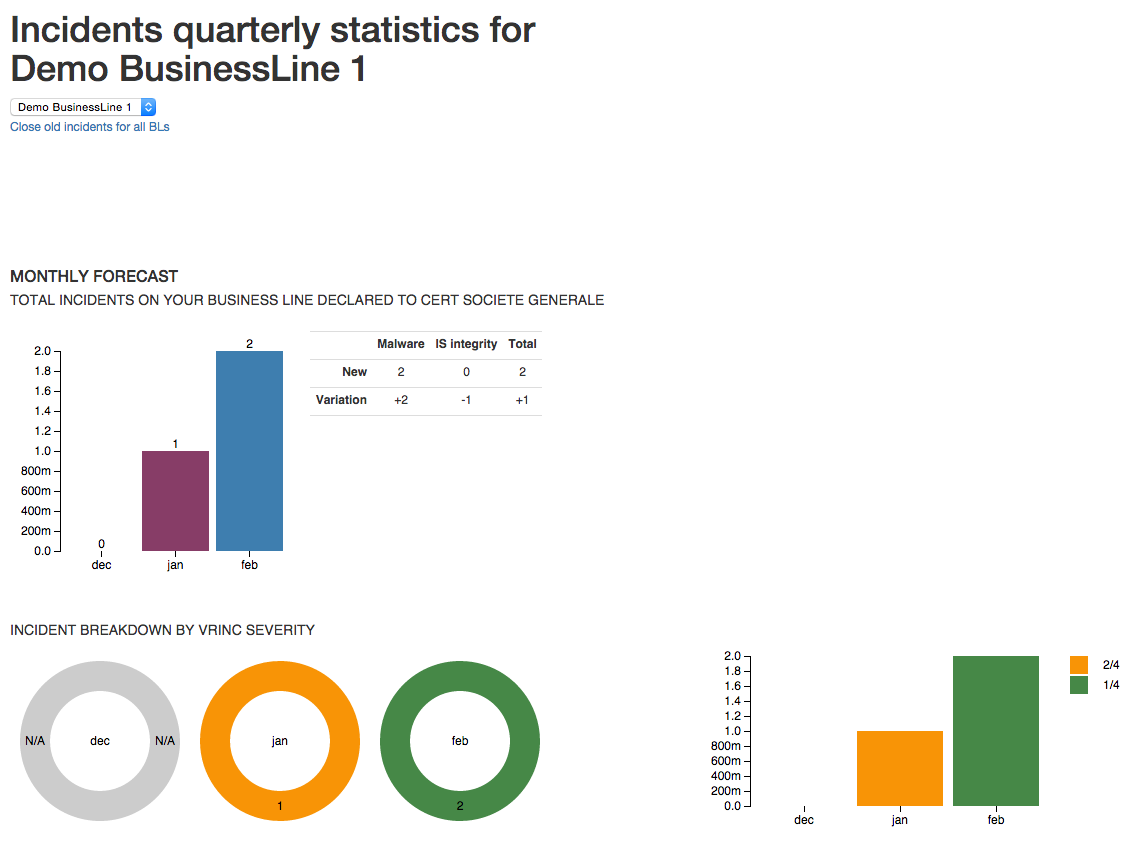
Incident statistics broken down by Business Line and by quarter. This page has a special @print stylesheet to generate PDF reports by printing the webpage.
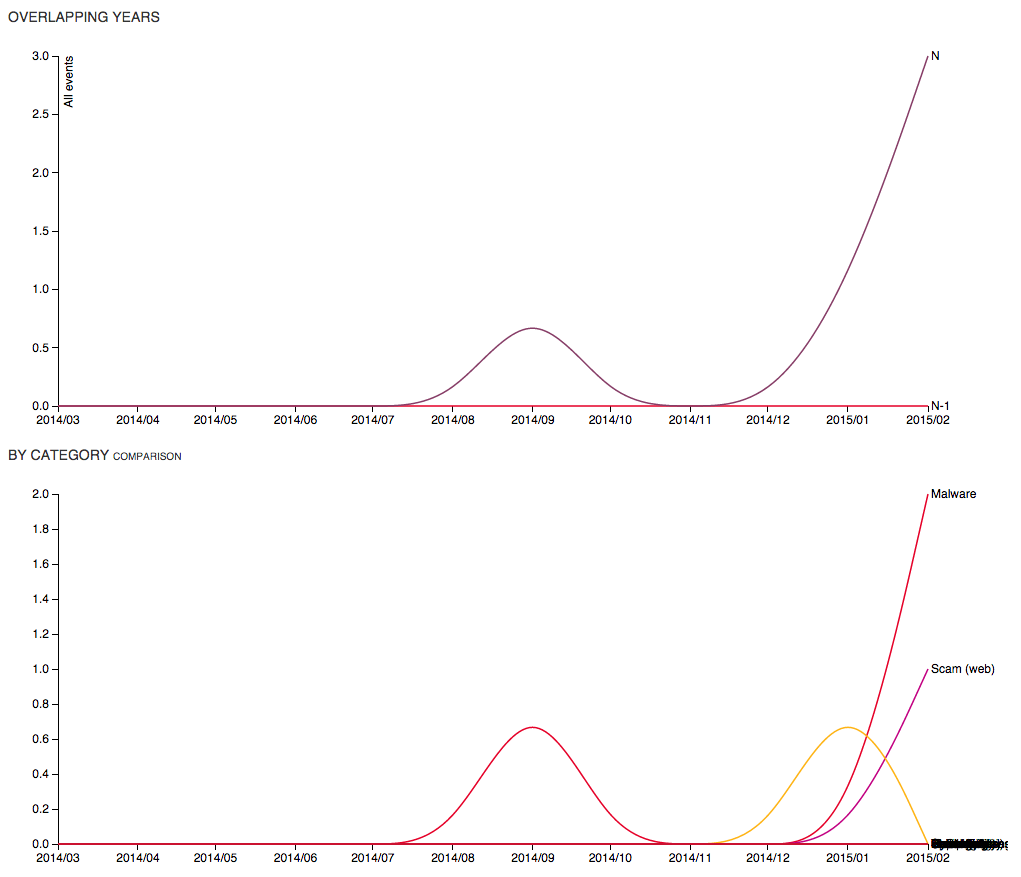
This will compare incident data with the previous year. Useful to see incident evolution and trends over a year.
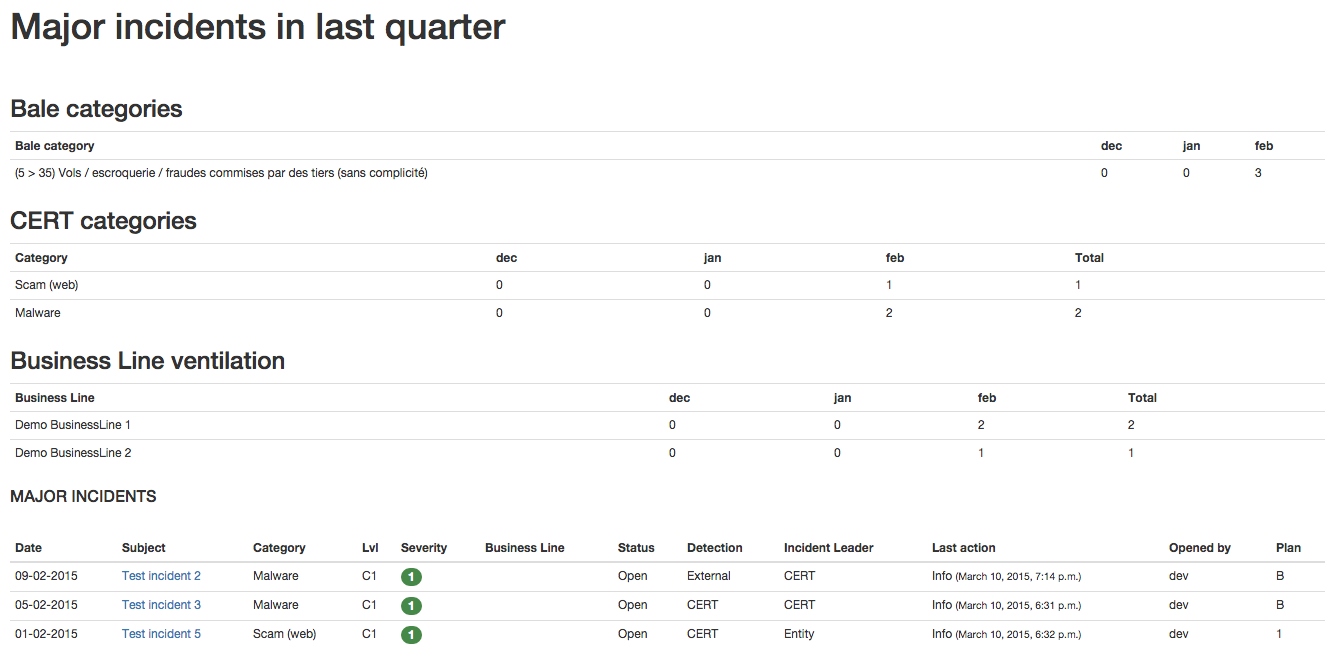
This will show incident data regarding major incidents and Basel III categories over the last quarter.
The sandbox is an experimental stats webpage. Odds are that the statistic you're looking can be generated here if it's not already in the other pages.
This is a special view that can generate statistics and compare them with eventual attributes that have been set on specific incidents. For example, it will allow you to graph downtime over DDoS incidents, or amount of impacted users over malvertisement campaigns (provided you have specified the correct attributes: see the Attributes page for more details on this).
