visualize flow execution
A flow usually consists of many tasks. Glow optimizes the task execution by grouping the tasks, avoiding disk IO as much as possible.
To see the execution graph, run this command, assuming the driver program is called "word_count":
 // generate a x.dot file, which describes a graph
 $ ./word_count --glow --glow.flow.plot > x.dot
 // generate a x.svg file
 $ dot -Tsvg -ox.svg x.dot
You can also generate the graph into png format, etc.
Take this graph as an exemple:
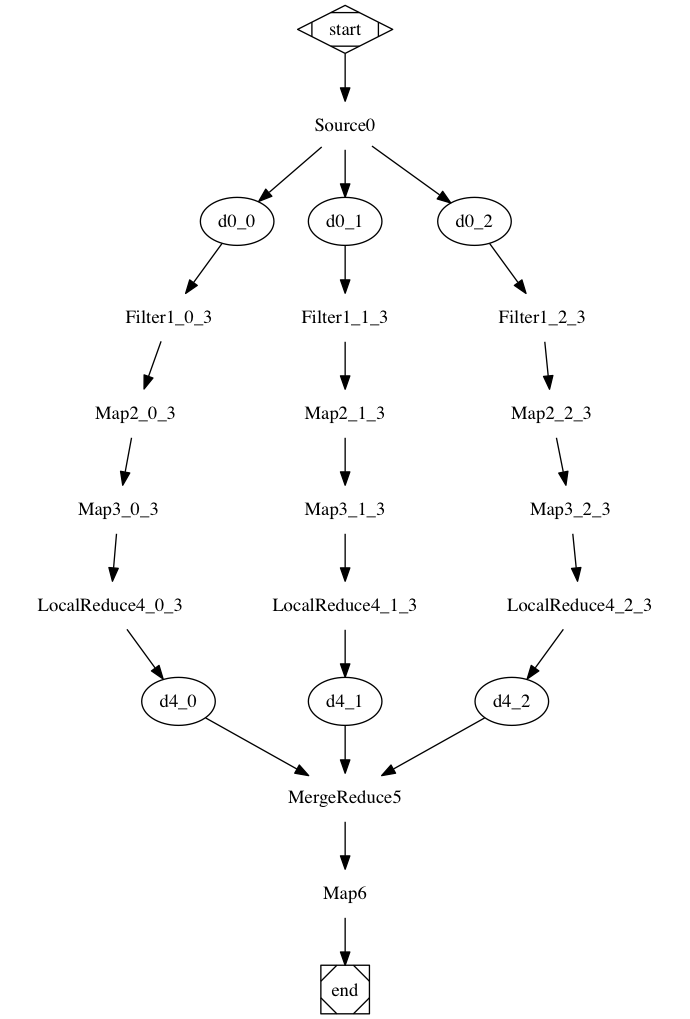
The Source0, Filter1, Map2, Map3, LocalReduce4, MergeReduce5 are actual computation steps. If a step is split into multiple shards, each task is named as [stepName][stepNumber][shardId][totalShards], for example: LocalReduce4_1_3 means the step is called LocalReduce4, shardId is 1, and total number of shards is 3.
Each dataset shard is named as [datasetName][datasetNumber]_[shardId], for example: d4_1 means the dataset is output of step 4(LocalReduce4), shardId is 1.
The shown datasets are actually written to disks. The datasets not written to disks are skipped.
Glow only writes dataset to disk in 2 cases:
- One task produces output for multiple tasks.
- One task consumes outputs from multiple tasks.
This would avoid any unnecessary delay or deadlock caused by waiting. For example, if one task produces outputs for task A and B. If task A runs fast, but task B runs slow, task A should just proceed. Task B can read the dataset later. If the dataset is kept in memory, at some point task A would need to slow down and wait for B, which is not ideal at all. In special cases, task B may be waiting for resources taken by task A. If task A waits for B, deadlock would happen.