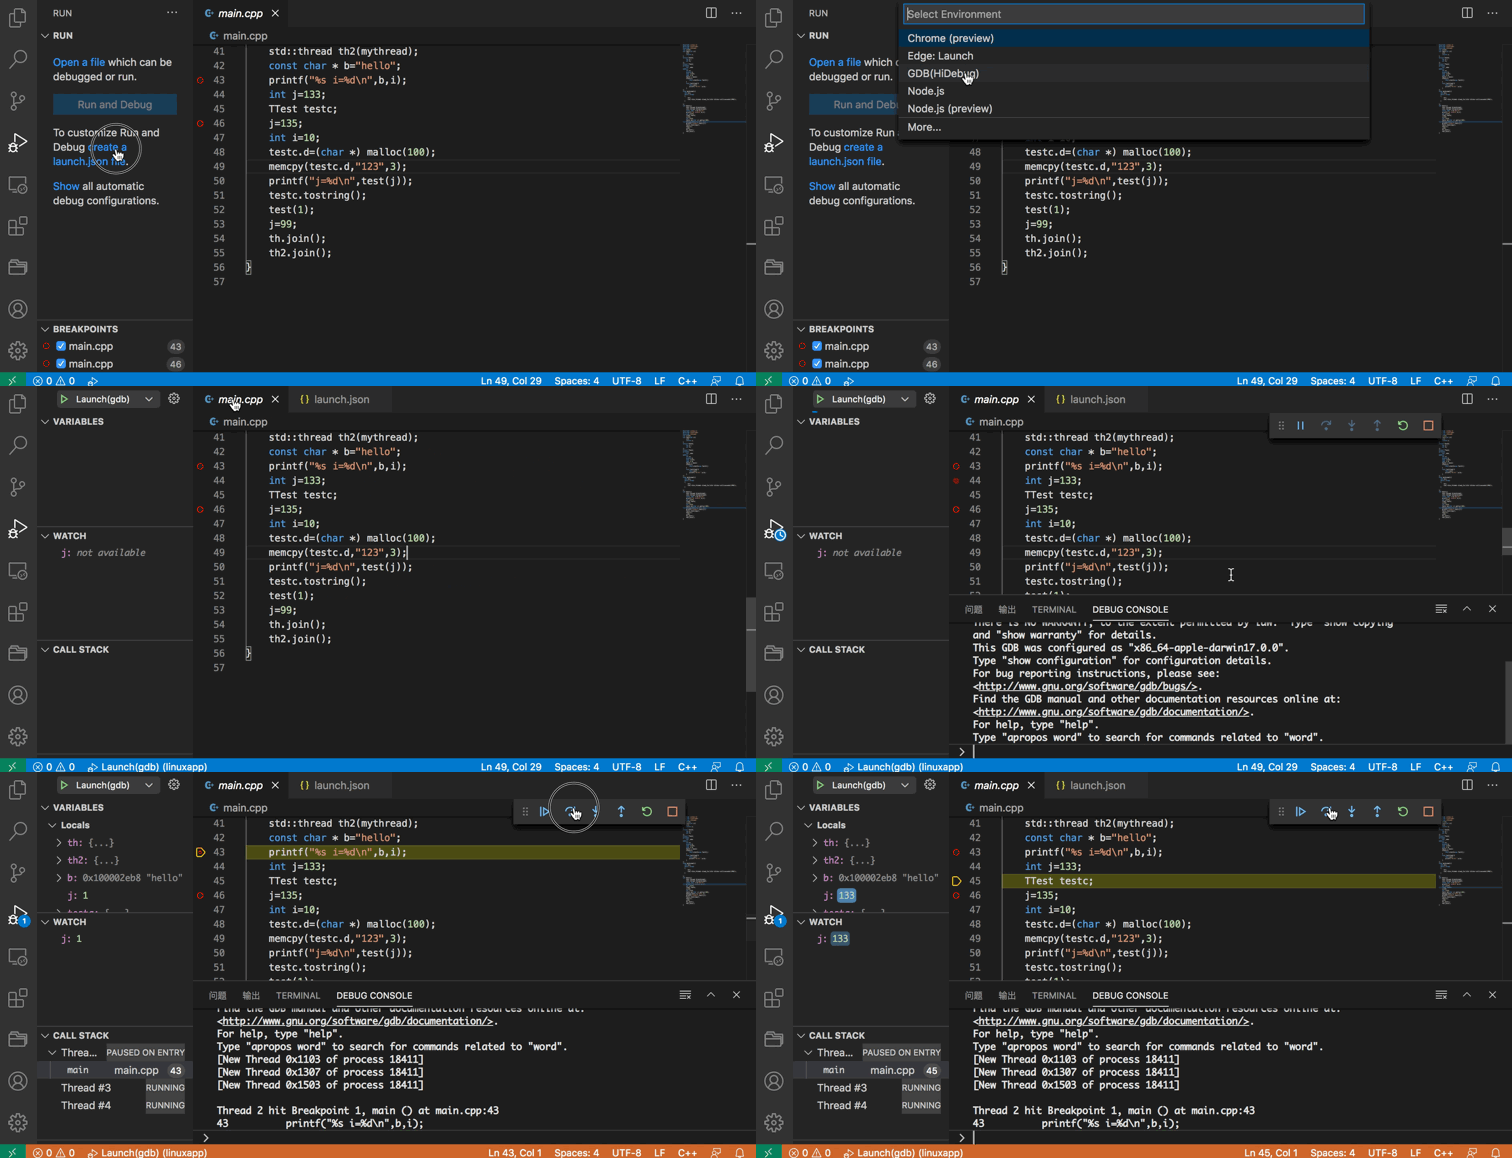
Hi all, Beyond Debug is a debug adapter for Visual Studio Code. It implemented through the GDB’s Machine Interface(MI).
- C, C++,Pascal,ObjectPascal, Fortran, D, Go, Objective-C, Fortran, OpenCL C, Rust, assembly, Modula-2, and Ada.
- insert, remove, enable, disable, condition breakpoints
- view local variables
- view watchs
- multi-threaded debugging
remote,extended-remotedebugginggdbserver --multisupported- transfer files from local to remote
- use native commands in debug console
- attach to process
- Install gdb on your system.
- Install the Beyond Debug extension in VS Code.
- Open your project
- Switch to the debug viewlet and press the gear dropdown.
- Select the debug environment "GDB(Beyond)".
- Press the green 'play' button to start debugging.
You can now debugging your program.
Use launch.json and setting request to "launch". You also need to specify the executable
path for the debugger to find the debug symbols.
{
    "type": "by-gdb",
    "request": "launch",
    "name": "Launch(gdb)",
    "program": "${fileBasenameNoExtension}",
    "cwd": "${workspaceRoot}"
}Attaching to existing processes currently only works by specifying the processId in the
launch.json and setting request to "attach". You also need to specify the executable
path for the debugger to find the debug symbols.
If the argument program arg is not set, a pickprocess window will be displayed.
If the argument program is set and only one process is found ,the debugger will start automatically.
{
    "type": "by-gdb",
    "request": "attach",
    "name": "Attach(gdb)",
    "program": "{fileBasenameNoExtension}",
    "cwd": "${workspaceRoot}"
}
This will attach to 5678 which should already run.
You can use gdbserver as your remote debugger. For that modify the
launch.json by setting request to "launch" and set remote section as below:
{
    "type": "by-gdb",
    "request": "launch",
    "name": "Launch(gdb)",
    "program": "${fileBasenameNoExtension}",
    "cwd": "${workspaceRoot}",
    "remote": {
        "enabled": true,
        "address": ":2345",
        "mode": "remote",
        "execfile": "${fileBasenameNoExtension}"
    }
}
You also need to specify the executable path for the debugger to find the debug symbols.
This will connect to the remote gdbserver on localhost:2345.
Often, if doing cross-platform compilation, we need to transfer locally compiled files to the server.
To do that, you need set remote - transfer as below:
{
    ...
    "remote": {
        "enabled": true,
        "address": ":2345",
        "mode": "remote",
        "execfile": "${fileBasenameNoExtension}",
        "transfer": [
            {
                "from": "${fileBasenameNoExtension}",
                "to":   "${fileBasenameNoExtension}"
            }
        ]
    }
}To use extende-remote mode. You must run gdbserver as gdbserver --multi.
Then change remote mode to extended-remote
in launch.json
{

    "remote": {
        "enabled": true,
        "address": ":2345",
        "mode": "extended-remote",
        "execfile": "[filename]",
    }
}To use gdb through SSH. You can use ssh mode like this.
{

    "ssh": {
        "enabled": true,
        "address": "123.123.1.1:1234",
        "username": "root",
        "passwordType": "none",
        "timeout":1000,
        //"privateKey":"~/.ssh/id_rsa"
        //"remoteSrcPrefix": "/root/test/src",
        //"loacalSrcPrefix": ""
        // "transfer": [
        //     {"from": "z:/tmp/src/project1","to": "/root/test/project1"}
        // ]
    }
}
If passwordType and privateKey is None, it will try to use .ssh/id_rsa file of system for authentication.
You can use all the GDB commands from the debug console. Just like in the shell.
You can view memory data on debug console or Microsoft Hex Editor if it installed.
Rignt click in editor on deubgging or use command byeond:View Memory.
If no content is selected, you can input address like this:[address or variable]:[address length (default:100) ], e.g. 0x1111:12 or 0x1111 or va:123 or s.c_str():100 ...
| name | type | default | desc | attach |
|---|---|---|---|---|
| debuggerPath | string | gdb | The path to the debugger (such as gdb) | |
| debuggerArgs | array | Additional arguments for the debugger | ||
| program | string | Full path to program executable | ||
| programArgs | string | Command line arguments passed to the program | ||
| cwd | string | ${workspaceRoot} |
The working directory of the target | |
| stopAtEntry | boolean | false | If true, the debugger should stop at the entrypoint of the target | |
| commandsBeforeExec | array | One or more GDB/GDB-MI commands to execute before launch. | ||
| varUpperCase | boolean | false | Convert all variables to uppercase. Used in case insensitive language, e.g. pascal. | |
| defaultStringCharset | string | Set the charset of a string variable on display. e.g. utf-8 | ||
| remote | ||||
| enabled | boolean | true | If true, the remote mode will be actived. | |
| address | string | Remote address and port. [ip:port] | ||
| mode | string | remote | Extended target mode. Can be remote or extended-remote |
|
| execfile | string | Remote exec file. | ||
| transfer | array | Transfer local file to remote before launch. | ||
| ssh | ||||
| enabled | boolean | true | If true, the ssh mode will be actived. | |
| address | string | Remote address and port. [ip:port] | ||
| username | string | User name for login | ||
| passwordType | string | How to use password. Can b input or inputAndSave. |
||
| privateKey | string | File path of privateKey to login.(eg. id_rsa) \n This will be ignored if password is not empty. | ||
| timeout | string | Time out for SSH.(ms) | ||
| remoteSrcPrefix | string | Path prefix of remote source code.\n It will be replaced by localSrcPrefix if not empty. | ||
| loacalSrcPrefix | string | Path prefix of local source code. | ||
| transfer | array | Transfer local file to remote before launch. |
- Add i18n supports
- lldb-mi support
- dbgmits This library used to programmatically control debuggers that implement the GDB/Machine Interface via JavaScript.
