request spike creates memory spike #2593
Comments
|
@szuecs : Thanks you for isolating this problem in its own issue. QUESTION: I guess that the outage you experiences is the one that is reported in this issue : #2554. I read that post-mortem outage description but did not relate that was the description of THIS outage. Let me verify I understand properly the different scenario you went throuhg:
During this outage, you think you queries at most hundredth of different domains. 2- your created a setup to show the problem using "old setup" and the result is what is visible in the graphs here The test is just pinging always the same upstream domain (www.exemple.org). 3- you run 3 uses cases of the similar test, just changing the config of CoreDNS and dnsmasq, using "new setup", and modifying the max allocation of memory.
QUESTION: in this latter case (3). You are still using the same tool for sending load to CoreDNS ? I guess you modified the options of the test until finding the crashing point of coreDNS. Am I correct ? Without running the test yet .. I came to same conclusions as here @rajansandeep is proposing to reproduce locally the same configuration so we can investigate what is really happening (and validate the above hypothesis or not). |
Yes
no it was requesting not one but multiple names (up to 100).
Yes
No, we increased the replicas and set the same 100 names on all of them to make it more similar to one nodejs application with 150 replicas that hit the dns setup.
I think the best would be to use
+1 for try to reproduce it locally, sometimes it's hard but if you have success in this it will be much easier to pinpoint the cause. |
|
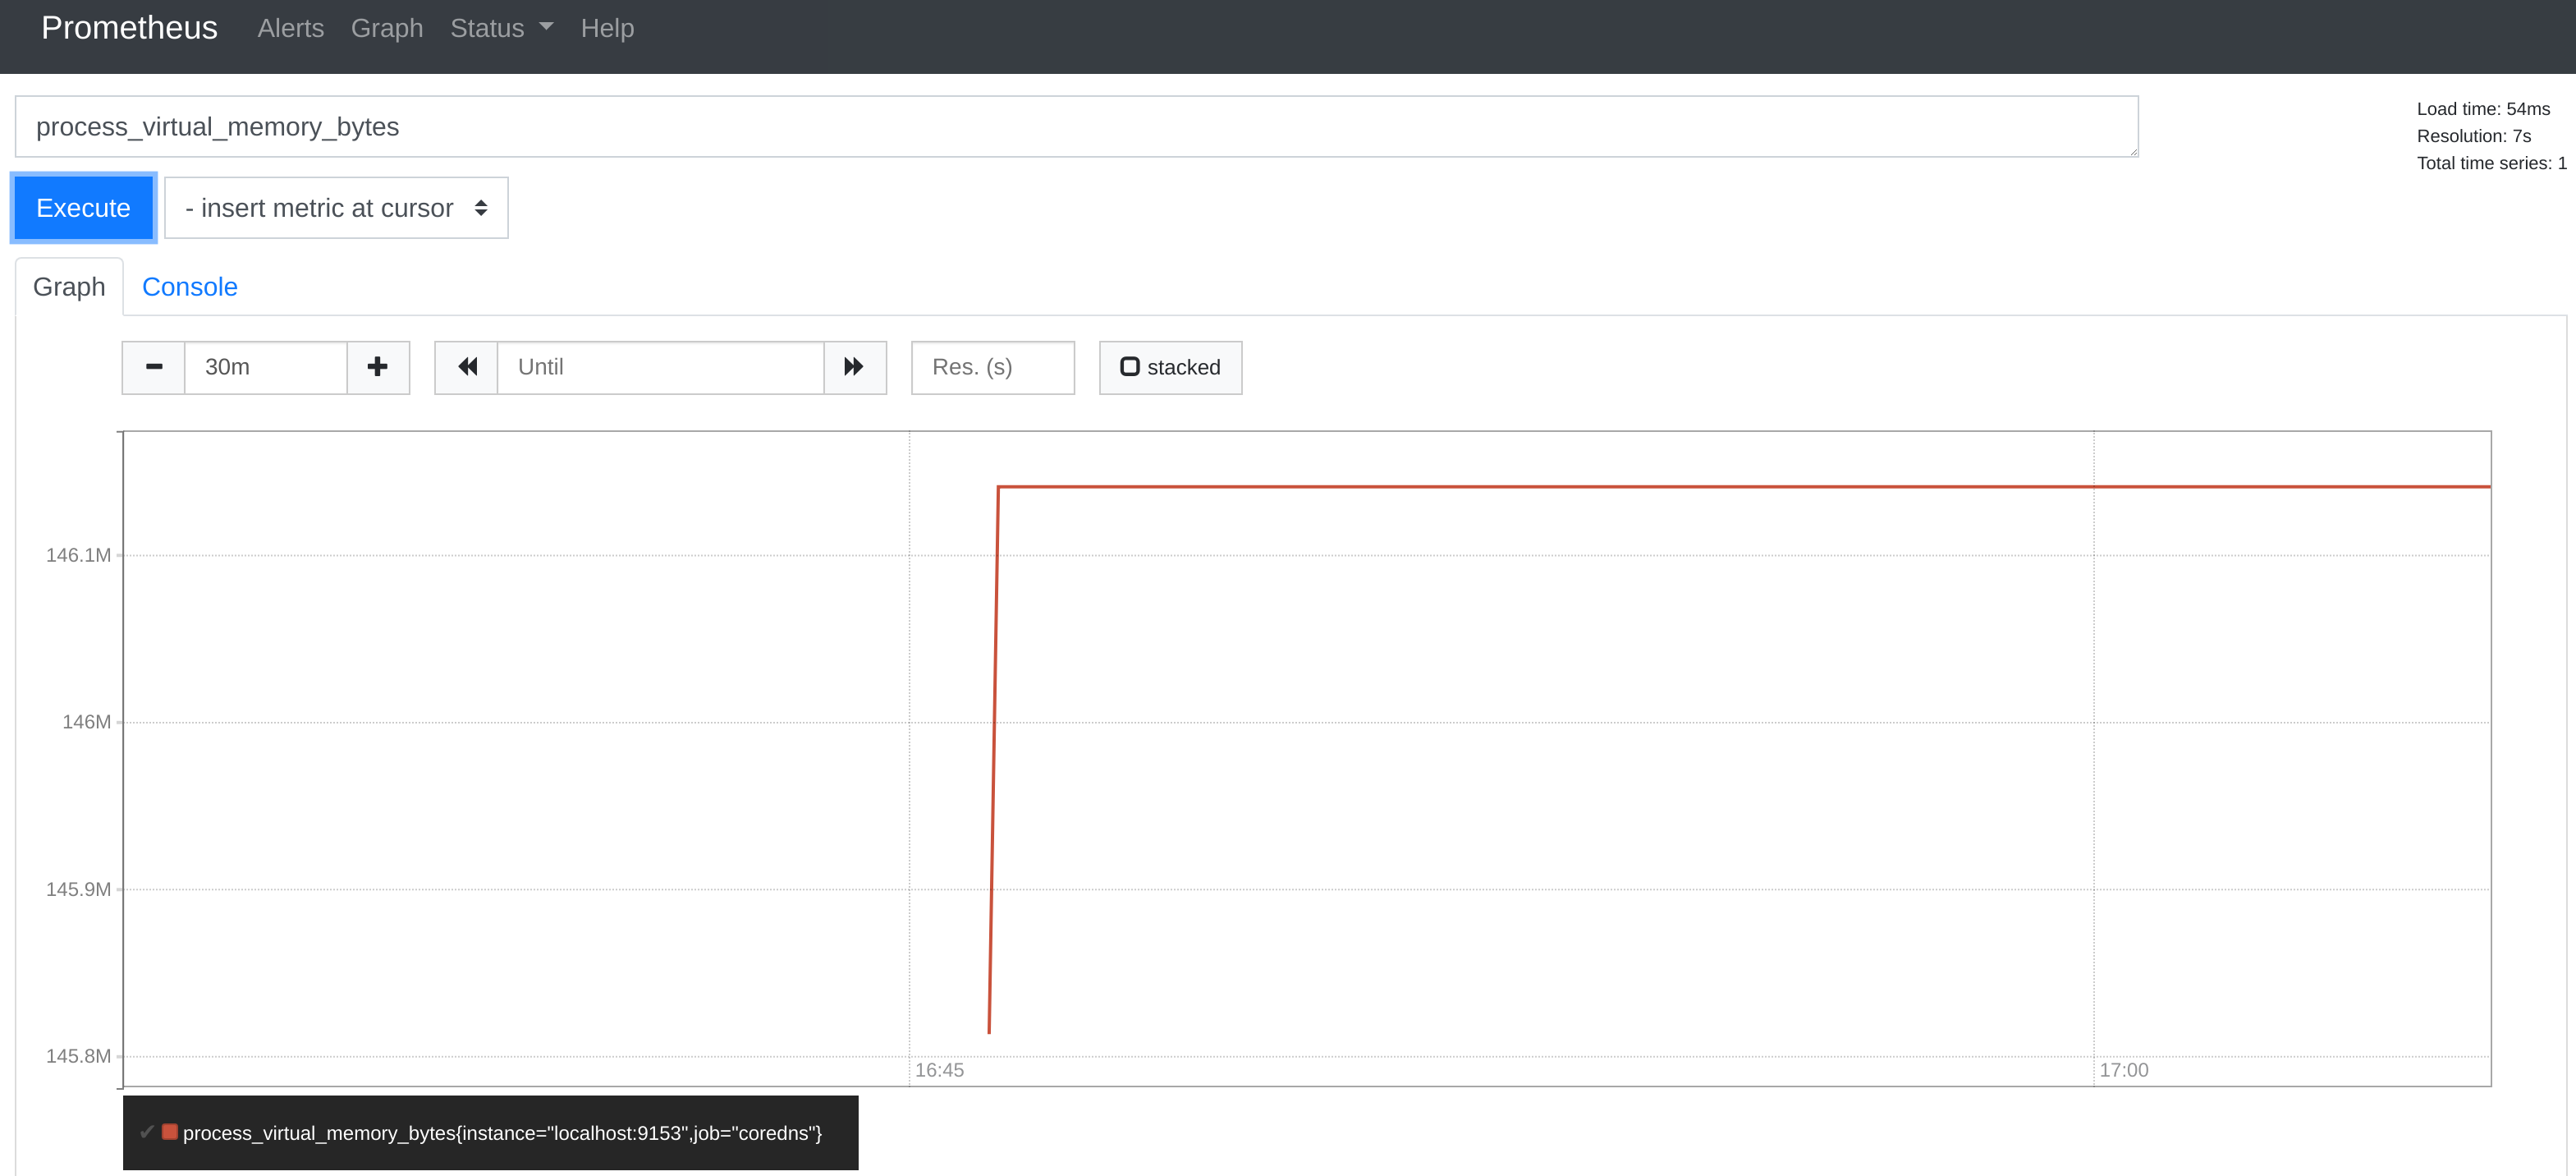
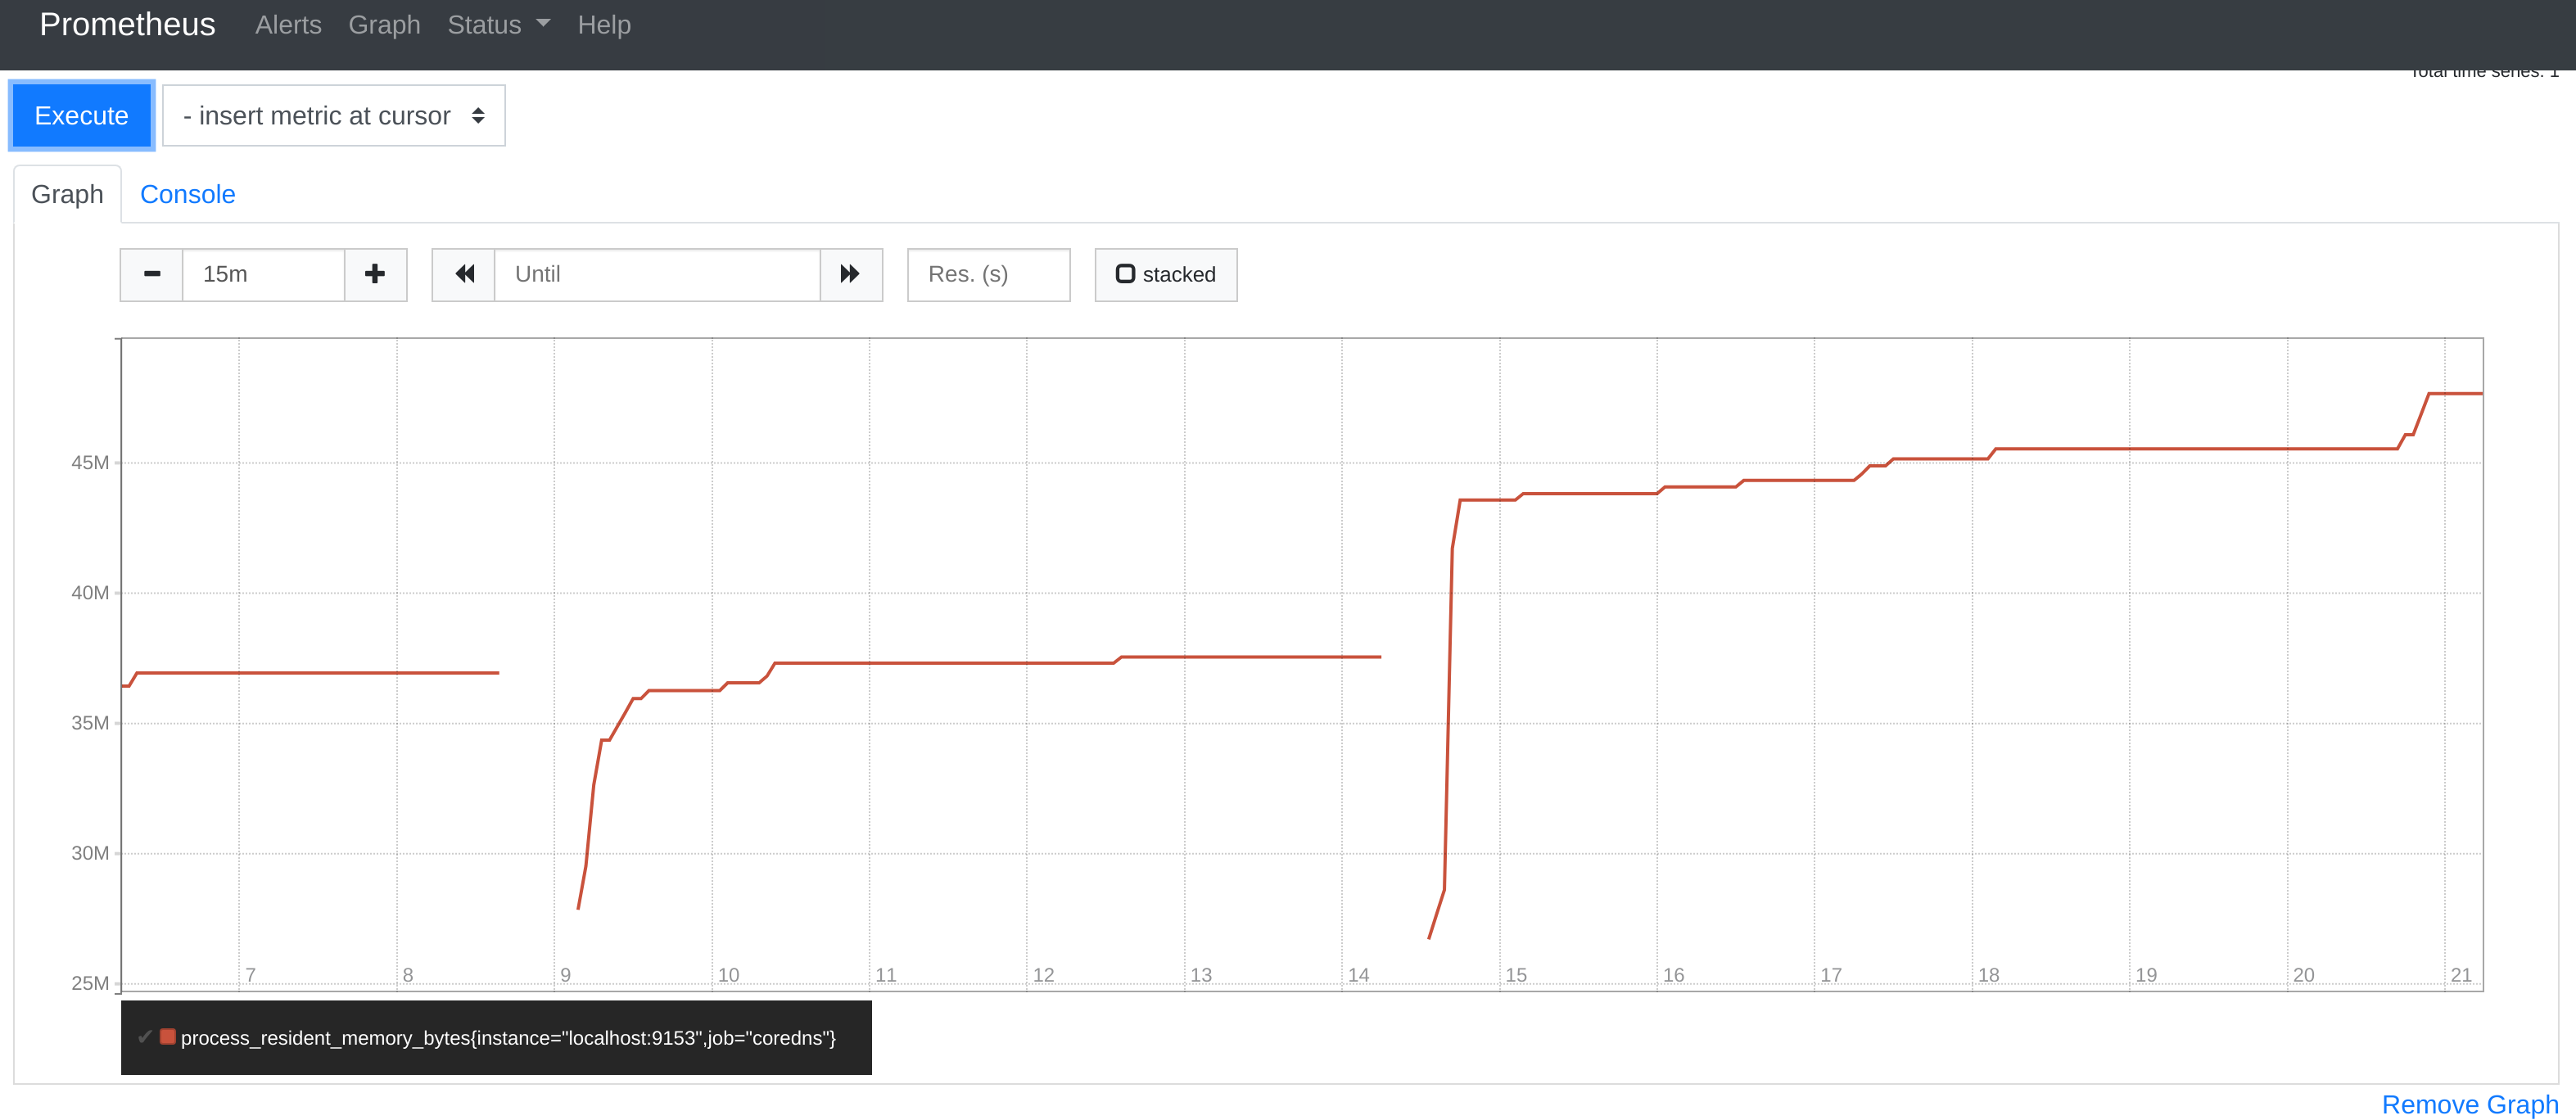
I'm (once again) coming from the other side with a bare minimal setup and going from there. This is running on Packet, with a dst and src machine that query via the network. Both dst and src running coredns, where the one on A bare Add more plugins as go, prometheus and errors enabled; this then drops then to 20Kqps; depending on the output of this issue we may also want to look into that; there is still a The following prometheus metrics are from a half our run, which this outcome:
|

|
Adding all plugins, except kubernetes, because that's so too hard to test outside k8s (see #2575). Drops a few qps. Memory according to Prometheus. (right most graph). If its easy to swap out, can you try a new coredns and change proxy to forward? |
|
Ok, now having the dst coredns forward to 1.1.1.1, 8.8.8.8 and 8.8.4.4 and running alexa 1k. Running this again, for 65 second (expunges the cache at least once) and also because of the 2nd forwarding this is actually internet data.
So this cuts out everything except the k8s plugin. |
|
Note this Corefile Is inefficient, the entire reverse trees are tunneled through k8s and only if they are nxdomain ( Much better would be to split this up into multiple servers and specify a more specific reverse for k8s: |
|
I think what we need to do is perf just the k8s plugin and check where memory is being used . |
|
@miekg the problem with all dnsperf tools is that they do not create load that makes sense for general case. https://github.com/mikkeloscar/go-dnsperf uses /etc/resolv.conf settings to generate queries. We got completely other results when we used other tools to create load. |
|
[ Quoting <notifications@github.com> in "Re: [coredns/coredns] request spike..." ]
@miekg the problem with all dnsperf tools is that they do not create load that makes sense for general case. https://github.com/mikkeloscar/go-dnsperf uses /etc/resolv.conf settings to generate queries. We got completely other results when we used other tools to create load.
this should not matter, a request is a request.
|
|
What @szuecs is saying if i'm not mistaken, is that most DNS performance tools (for good reason) send requests directly (as a single request), whereas go-dnsperf appends search domains from |
|
@chrisohaver exactly, but @miekg while you are correct, it's not, because of TLD nameservers are different, caching might be different, .... Details really matter in this case. |
|
[ Quoting <notifications@github.com> in "Re: [coredns/coredns] request spike..." ]
@chrisohaver exactly, but `( 1 + number of search path) * 2` (A and AAAA records are requested separately)
Yep. Noted. That's why you shouldn't use that to debug or test. This can be
easily done with the performance tools that are available and a generic (fully
qualified) lists of domain is also preferable to having a dependency on
/etc/resolv.conf.
I'll add a bunch of reverse names and names that I know will return nxdomain.
Coming back to the Corefile used in the first comment - any reverse lookup will
give atrocious performance.
|
|
@szuecs, are there a large number of reverse lookups in your load? |
Actually, any reverse lookup of an IP outside the cluster would have bad performance. For reverse lookups inside the cluster, there would be no performance penalty. |
|
re: mem usage |
@szuecs So the queries in the test are all external names or are there internal name queries as well? |
|
@szuecs, can you share the list of names you tested with? |
|
We don’t use PTR records and the last time I saw something like a reverse lookup was when Apache did a reverse lookup for every access log. :D The host name pattern looks like this:
Our current tested idea to make it even better is |
|
OK thanks. Due to the ndots/search path thing, Regarding the go-client, there is the k8s api watch (asynchronous from queries), but the resource usage there should not be correlated to the RPS load. i.e. we should not expect the client-go watch to start taking up more resources when the RPS ramps up. Of course there is also the response cache (cache plugin). Which means that at these high RPS loads, practically 100% of queries are actually being served from cache, and with a small set of distinct query names (5 or so), the cache should not be write locked very much at all during the test. |
|
@szuecs do you have a graph of the number of goroutines and cpu? also not sure anymore if this is kubernetes plugin related |
|
I think I have reproduced the memory issue. SetupI used the perf-tool used by @szuecs from https://github.com/mikkeloscar/go-dnsperf to check performance of CoreDNS in Kubernetes.
Case 1Number of client replicas deployed : 50 CoreDNS was able to handle the requests, with memory consumption peaking at 220 MiB and going down slightly as time went by, stabilizing at around 157Mi.
Case 2Number of client replicas deployed :90 CoreDNS gets OOMKilled constantly and is not able to handle all the requests from the clients. Logs from one of the client replica: Looking at the memory consumption of CoreDNS, it seems to take up around 1.2 GiB of memory before getting OOMKilled and restarting.
CPU Usage:
Requests handled: CoreDNS is unable to keep up.
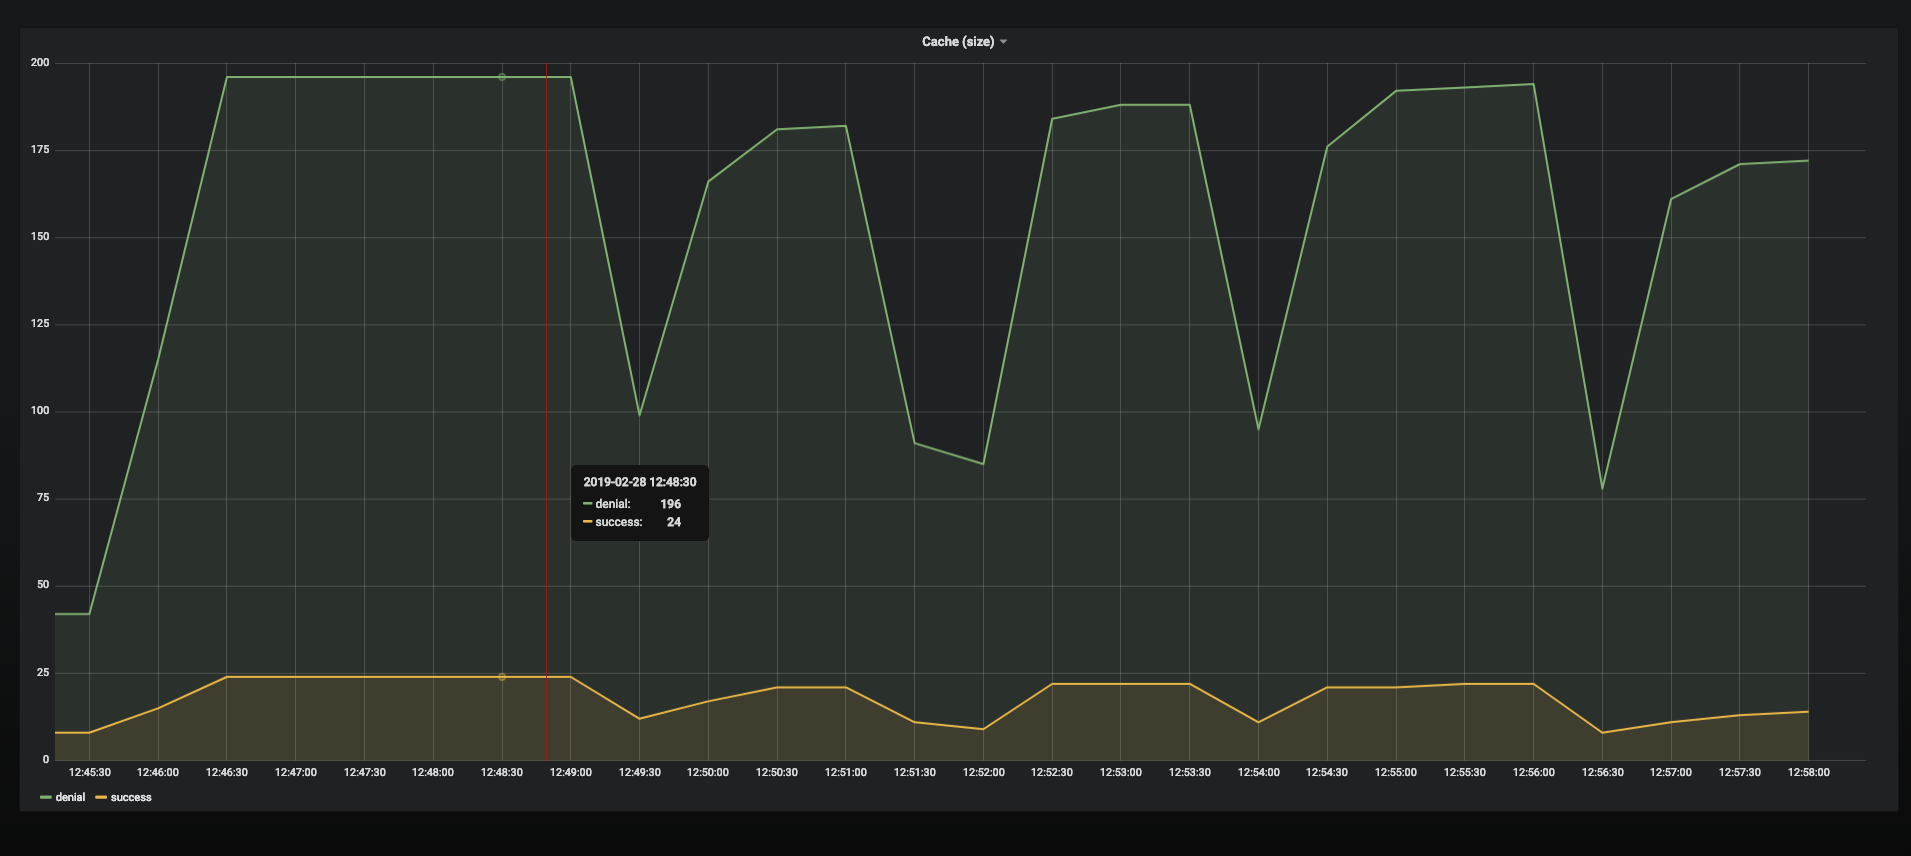
Cache Hitrate: Looks like we are hitting the cache as expected.
I will be continuing my investigation further. |


|
I will be continuing my investigation further.
Thank you!
|
|
Continuing my investigation, on the same setup as #2593 (comment),
Observations made during the test:
Further test analysis:
I have attached the metrics (Can be zoomed in for better readability) in the following order:
Also attaching pprof: pprof.coredns.samples.cpu.007.pb.gz |

|
Very interesting observations and data! You reproduced the same we saw in our production outage. |
|
@tommyulfsparre good catch, I could not disclose it before, because we had to create a fix for our infrastructure first. The underlying issue is more huge, than I expected. @miekg probably this is helpful, not DNS but this will crash any go http/proxy, that has unbounded growth of goroutines and this leads to memory spikes and oom kill if you run in a memory limited cgroup. |
|
Thanks @szuecs for filing that. As go dns closely mimics how net/http does (these kinds) of things, I wonder what they will implement. Meanwhile we need to do something in the forward plugin, or more generic in miekg/dns |
This introduces improvements to the CoreDNS configuration as suggested
in coredns/coredns#2593 (comment)
The change is to use multiple server directives to avoid expensive
lookup from Kubernetes plugin in terms of reverse DNS lookup or
expensive regex matching for `ingress.cluster.local` names.

* Use the `ready` plugin for readinessProbe
  https://github.com/coredns/coredns/tree/master/plugin/ready

Signed-off-by: Mikkel Oscar Lyderik Larsen <mikkel.larsen@zalando.de>
|
see #3640 for a potential fix. You need to manually fiddle with the new |
|
@miekg thanks! |
Thanks - we changed the name during the review, and i missed a place. |
|
Since we have now the possibility to fix the issue, can we have a release and close this issue? |
|
[ Quoting <notifications@github.com> in "Re: [coredns/coredns] request spike..." ]
Since we have now the possibility to fix the issue, can we have a release and close this issue?
:)
yeah, was pondering going for 1.6.x or 1.7.0, but doing another 1.6.x won't hurt
|
|
Since https://github.com/coredns/coredns/releases/tag/v1.6.9 we can set a concurrency limit |
@chrisohaver why? Could you please explain it for me? thanks |
|
@rootdeep, in the default Kubernetes deployment, all reverse lookups are intercepted by the kubernetes plugin which searches for the IP address in the Service and Endpoints indexed object cache. If no IPs match, then the request is passed to the next plugin, forward, which forwards the request upstream. Thus any reverse lookup of an IP outside the cluster results in extra work (e.g. parsing IP from qname, and two indexed object lookups) before the request is forwarded upstream. This could be avoided by more precisely defining the reverse zones for the kubernetes plugin in the Corefile so they match the actual Cluster IP and Pod IP subnets. However, it is not trivial to automatically determine those subnets during an install of Kubernetes, hence the default behavior. |
|
@chrisohaver Could you provide an example optimal Corefile somewhere with placeholders for the cluster IP and pod subnets? Then we could substitute in the values for our clusters and have better performance. |
|
It would be as per the default kubernetes CoreDNS configuration, with the kubernetes plugin replaced with, for example ... ... for a cluster with a ClusterIP subnet 10.9.8.0/24 and Pod subnet 172.0.0.0/16 . Note that there should not be a |
|
Ok, so replace: with: Perfect. Thank you @chrisohaver. |
To show the numbers in our tests, created by https://github.com/mikkeloscar/go-dnsperf
RPS

Memory

During an outage we had 18k RPS and 800MB memory consumption per CoreDNS instance. 800MB shown in grafana, but I expect the peak was much higher, because we had to increase memory from 1GB to 2 GB to survive). Before the outage we had 3.5k RPS and 64MB memory consumption per CoreDNS instance.
The usage pattern in test and outage are to have a couple of external (not cluster.local) DNS names to resolve.
CoreDNS configuration
CoreDNS deployment
/etc/resolv.conf is kubernetes default with
ndots 5andsearch default.svc.cluster.local svc.cluster.local cluster.local eu-central-1.compute.internal. A call to www.example.org will do 5x 2 DNS queries.More careful and detailed results by load tests with CoreDNS as daemonset and dnsmasq in front of that daemonset show these numbers:
old setup
We used this config in our old setup:
If you need the version from the outage and start params of the deployment: https://github.com/zalando-incubator/kubernetes-on-aws/blob/dc008aa07ae480d9ba25dc9f6ca8d9d56aa813f4/cluster/manifests/coredns/deployment-coredns.yaml
new setup
Tests were running with CoreDNS 1.2, daemonset:
https://github.com/zalando-incubator/kubernetes-on-aws/blob/dev/cluster/manifests/coredns-local/daemonset-coredns.yaml
configmap: https://github.com/zalando-incubator/kubernetes-on-aws/blob/dev/cluster/manifests/coredns-local/configmap-local.yaml
The text was updated successfully, but these errors were encountered: