R functions for parsing of Illumina SAV (sequence analysis viewer) files, plotting with ggplot2 and generation of a website.
The website allows you to interactively explore the data (see screenshot).
Uses: R, angular.js, d3.js
library("devtools")
install_github("illuminasavr", "csf-ngs")
library("illuminasavr")

#generate web-site in outputfolder
makeSite("/full/path/to/InterOp", "/full/path/to/outputfolder")

#generate web-site in runfolder
makeSiteInRunfolder("/full/path/to/Runfolder")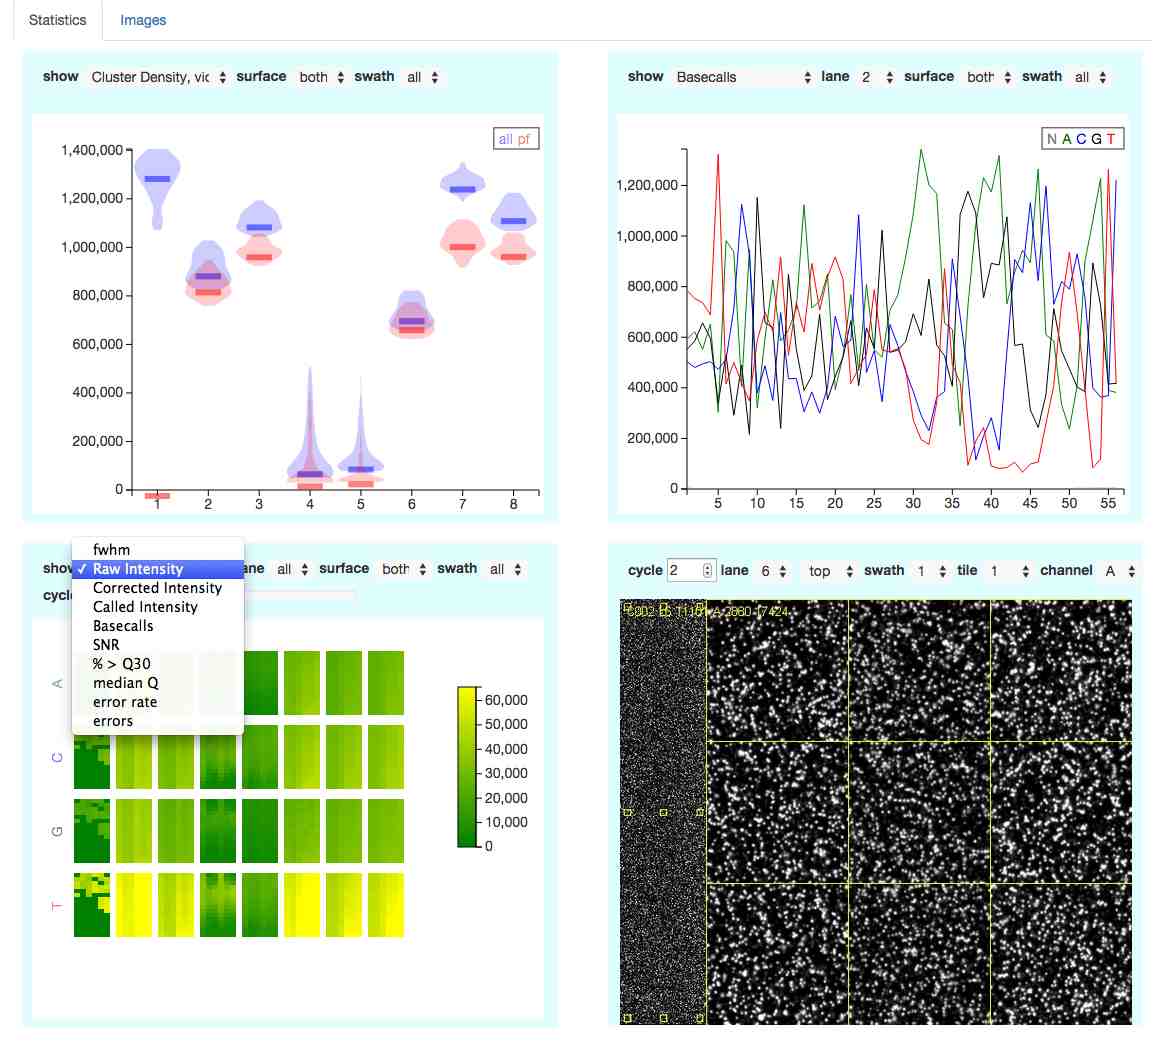
- switch binary parsing backend to https://github.com/Illumina/interop
- [] make Q30,Q20 mean/median/truncated mean identical to illuminas (don't really know what illumina uses).
- [] table of data
- [] add request to server for sample info metadata
- [] don't load everything multiple times in the controller
-
The website now also soft links the Thumbnails_Images folder into the generated folder to be able to view the images.
-
Currently it parses QMetricsOut.bin version 5 files RTA 1.18.64+ There is a parser for QMetricsOut.bin version 4 in the source code. In parser.R just change
  qmet <- parseFile(qmet, qualityMetricsParser5(), FALSE)
  qmet <- qualityMetricsParser5()$toStats(qmet)
 //to
  qmet <- parseFile(qmet, qualityMetricsParser4(), FALSE)
  qmet <- qualityMetricsParser4()$toStats(qmet)
-
MiSeq is not supported
-
NextSeq is not supported
-
NovaSeq is not supported
If there is time in the future, the backend parsing will be done by https://github.com/Illumina/interop and this package will only create a website with the data