![]()


![]()
![]()
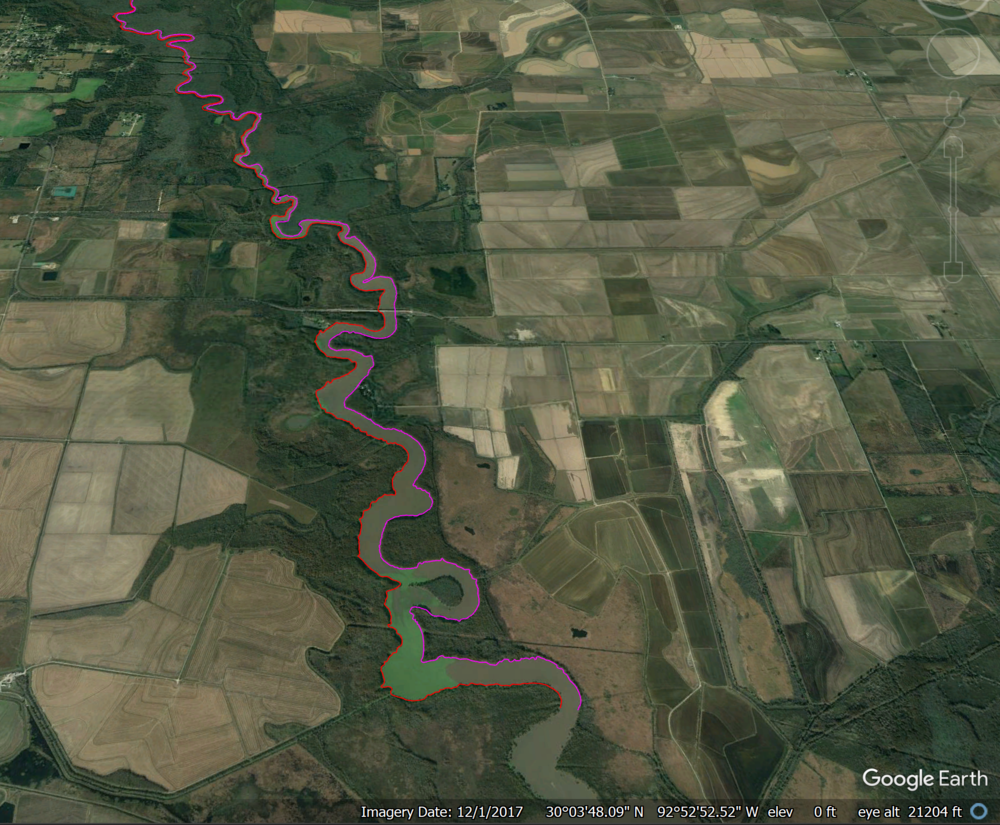
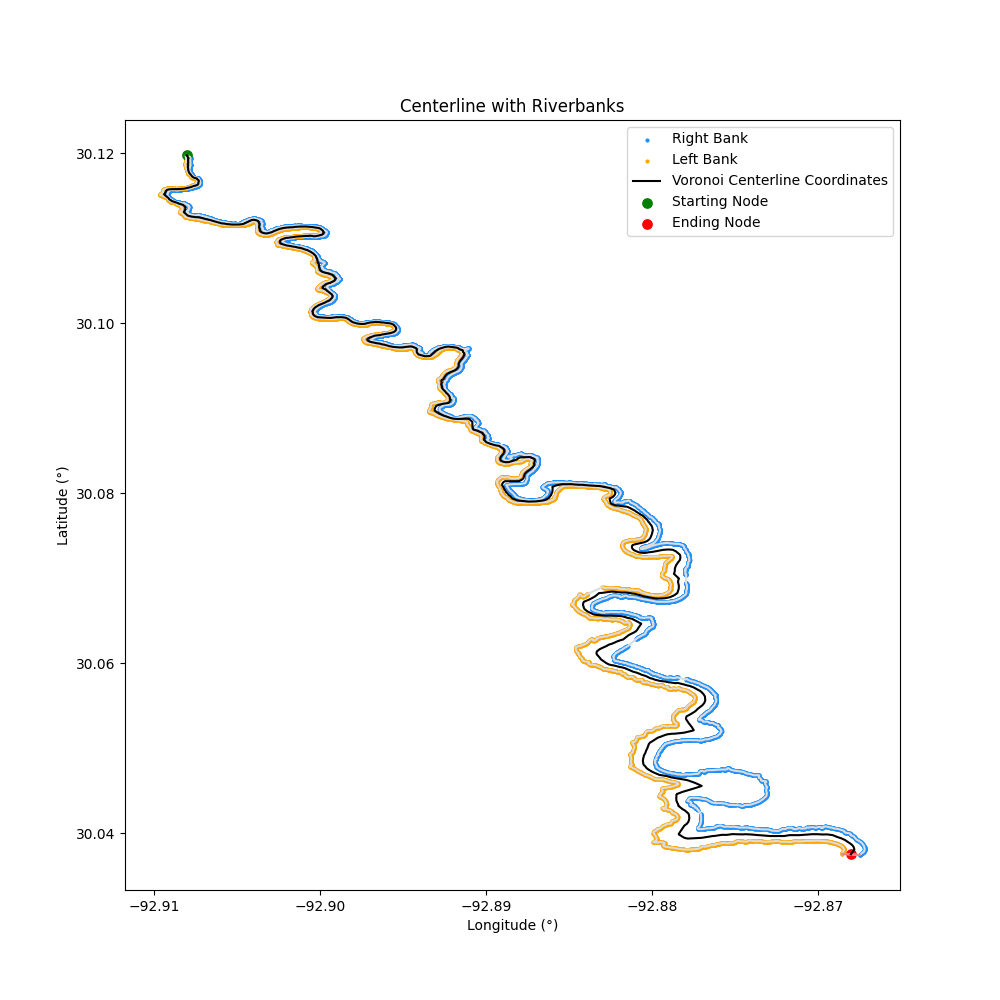
Find the centerline and width of rivers based on the latitude and longitude positions from the right and left bank
- Convert raw data from Google Earth Pro to CSV
- extractPointsToTextFile()
- convertColumnsToCSV()
- Find centerline and width of river
- plotCenterline()
- plotCenterlineWidth()
- riverWidthFromCenterline()
- centerlineVoronoi
- centerlineEqualDistance
- centerlineEvenlySpaced
- centerlineSmoothed
- centerlineLength
- Return river features
- rightBankLength
- leftBankLength
- riverArea
- Export centerline to .CSV and .MAT files
- saveCenterlineCSV()
- saveCenterlineMAT()
| River Outlined in Google Earth Pro | Generated Centerline for the Riverbank |
|---|---|
 |
 |
NOTE: This is Beta quality software that is being actively developed, use at your own risk. This project is not supported or endorsed by either JPL or NASA. The code is provided “as is”, use at your own risk.
PyPi pip install at pypi.org/project/centerline-width/
pip install centerline-width
The core of centerline-width works with a .csv file of the left and right bank latitude/longitudes. So, if starting from Google Earth Pro, two .kml must first be translated to a single .csv file
import centerline_width
centerline_width.extractPointsToTextFile(left_kml="left_bank.kml",
					right_kml="right_bank.kml",
					text_output_name="river_coordinates_output.txt")
centerline_width.convertColumnsToCSV(text_file="river_coordinates_output.txt")
Then once the .csv file is created, to run the centerline-width functions, generate a river object from the river_coordinates_output.csv
river_object = centerline_width.riverCenterline(csv_data="river_coordinates_output.csv")To plot the centerline, run the plotCenterline() function from river_object created. By default, will display with Decimal Degrees (latitude/longitude) coordinates
river_object.plotCenterline()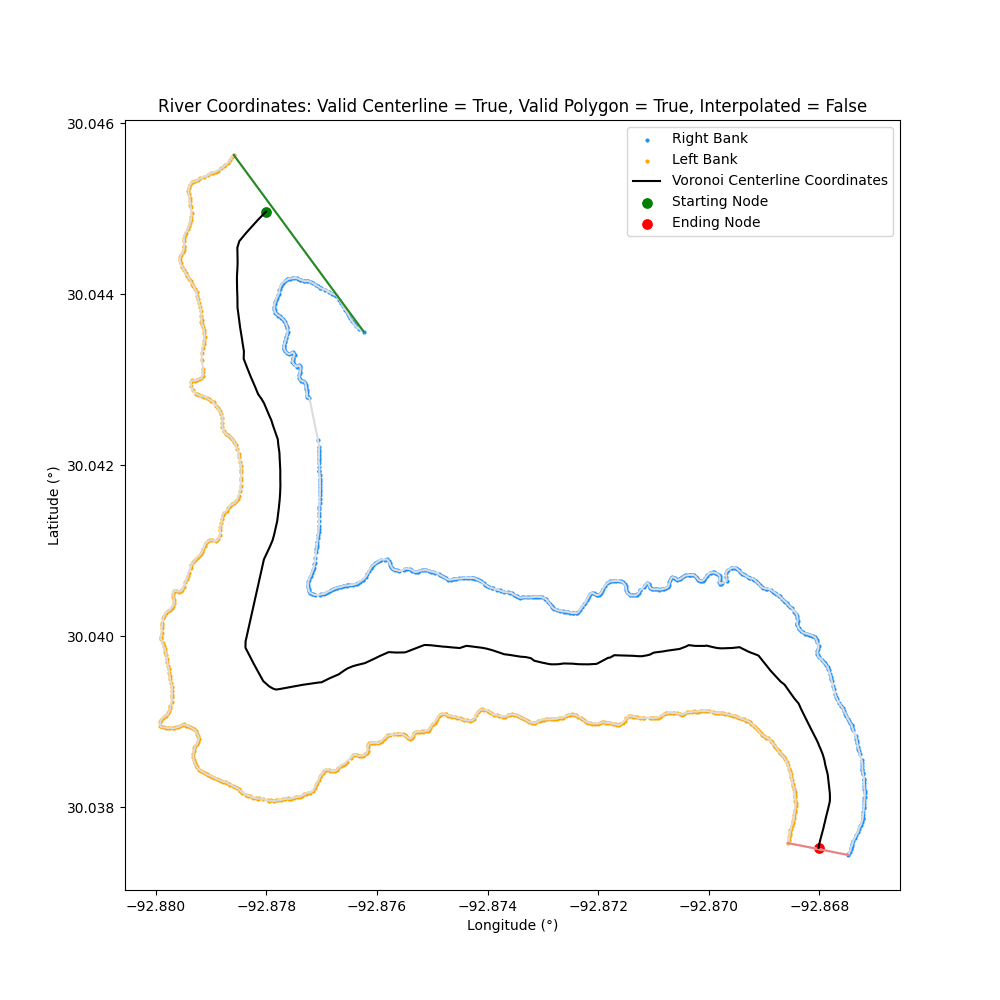
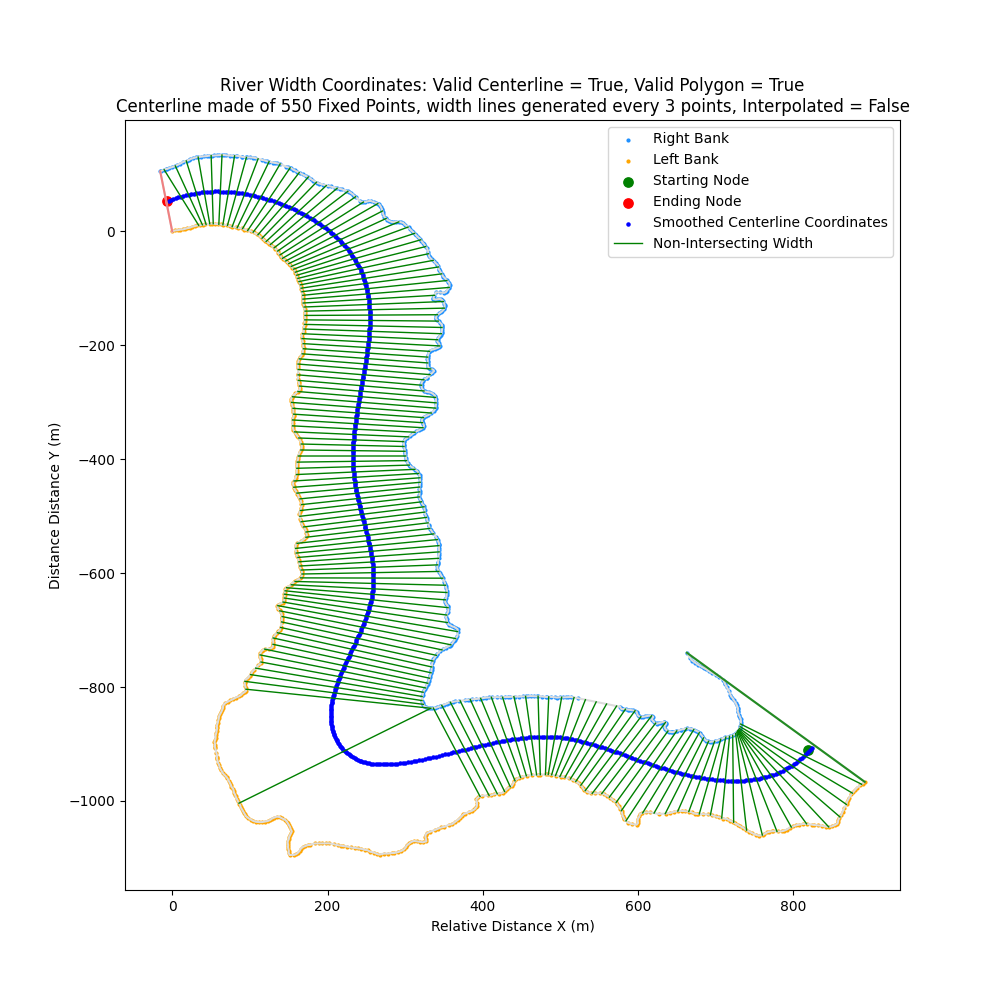
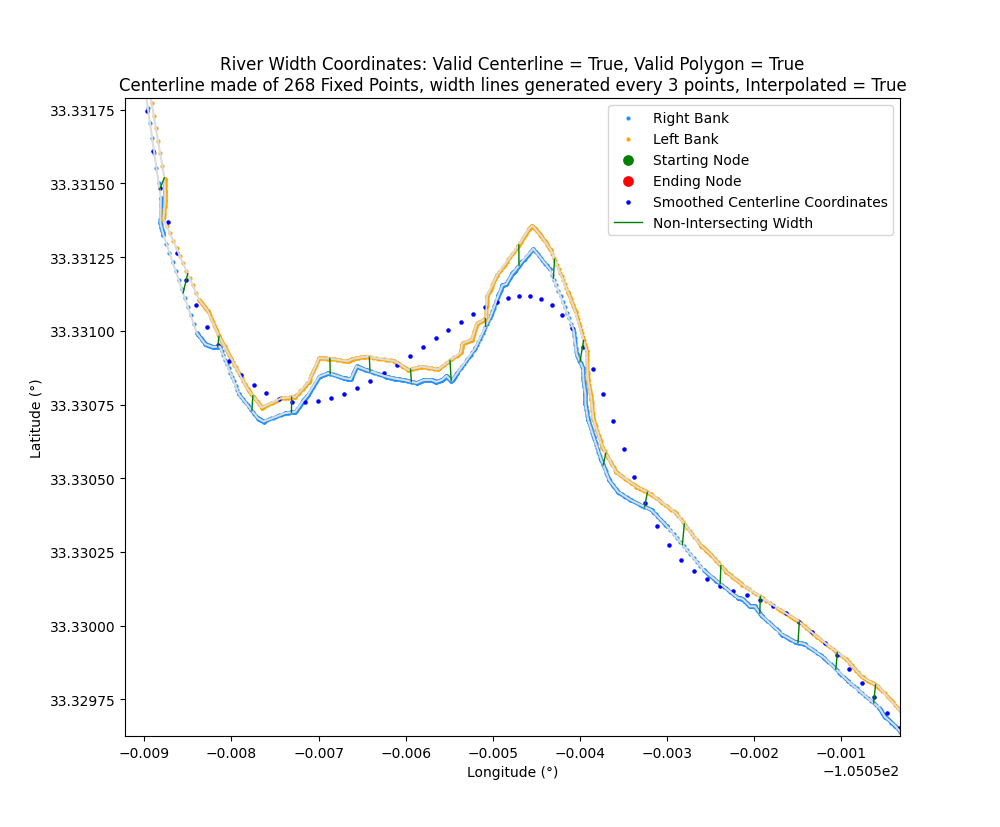
To plot the width of the river at intervals along the bank, run plotCenterlineWidth
While apply_smoothing, remove_intersections, and display_true_centerline are optional, they are recommended to generate a minimal width diagram
river_object.plotCenterlineWidth(apply_smoothing=True, remove_intersections=True, display_true_centerline=False)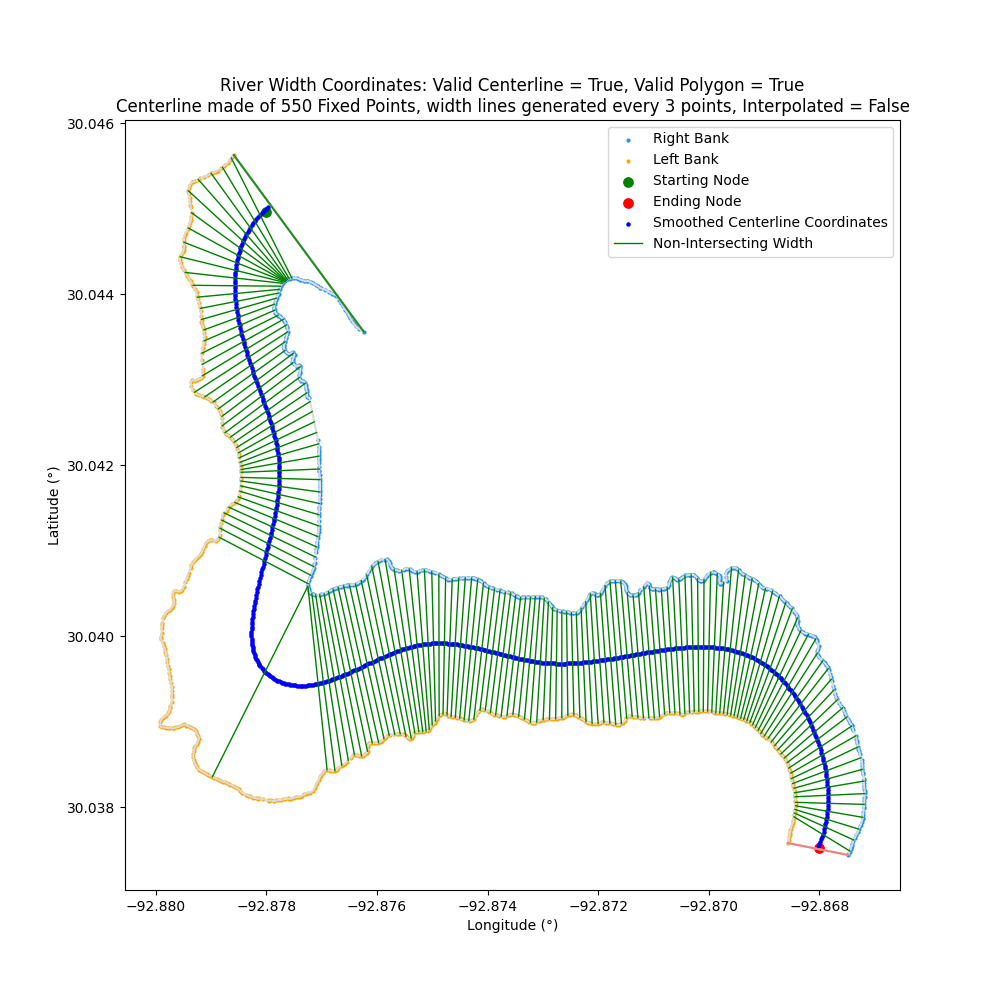
It is possible to also display all the coordinates as a Relative Distance, where all the coordinates are converted to a relative distance (in meters) from the first point on the left bank
river_object.plotCenterline(coordinate_unit="Relative Distance")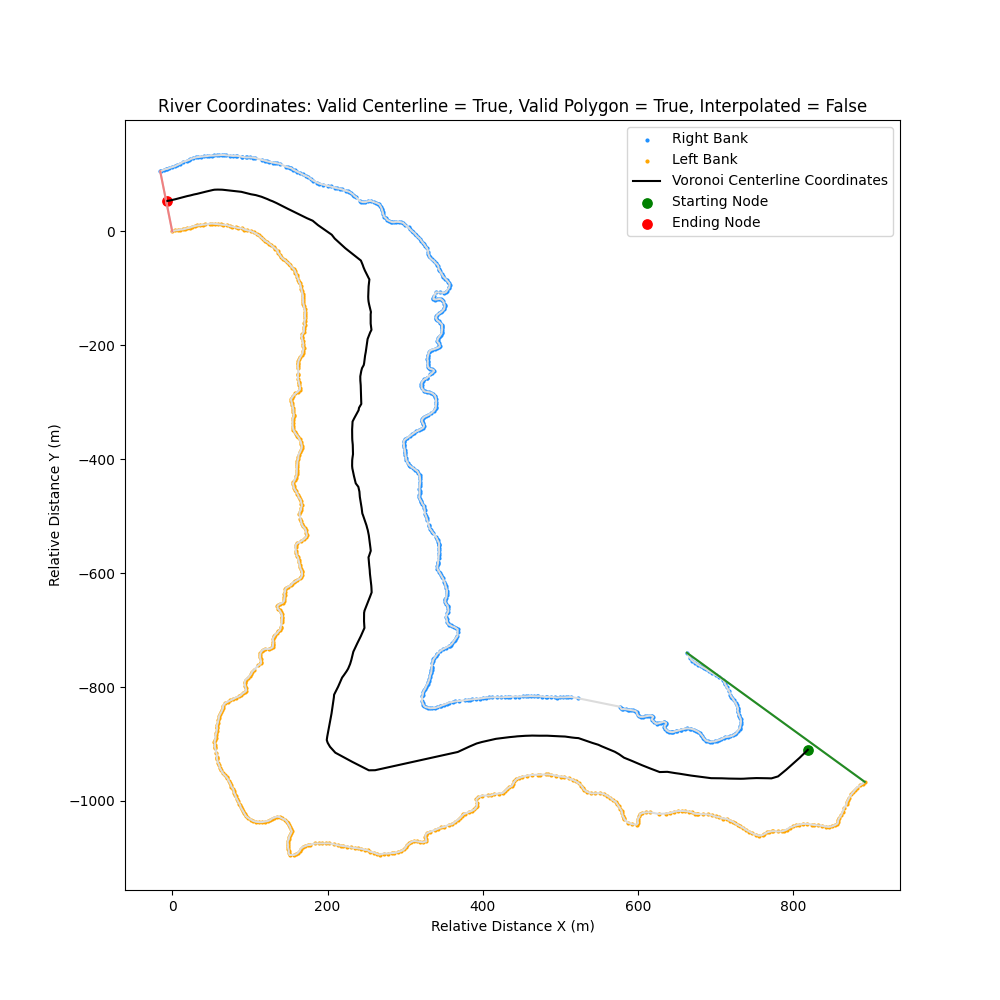
For more details to fix unexpected behavior or error code: Debugging, Error Handling, and Edge Cases
For a complete example script to run centerline-width: centerline_width_example_script.py with example outputs
Riverbanks can be defined here as the high-contrast boundary between active/recently-active flow and the surrounding landscape. We will be mapping the right and left bank separately
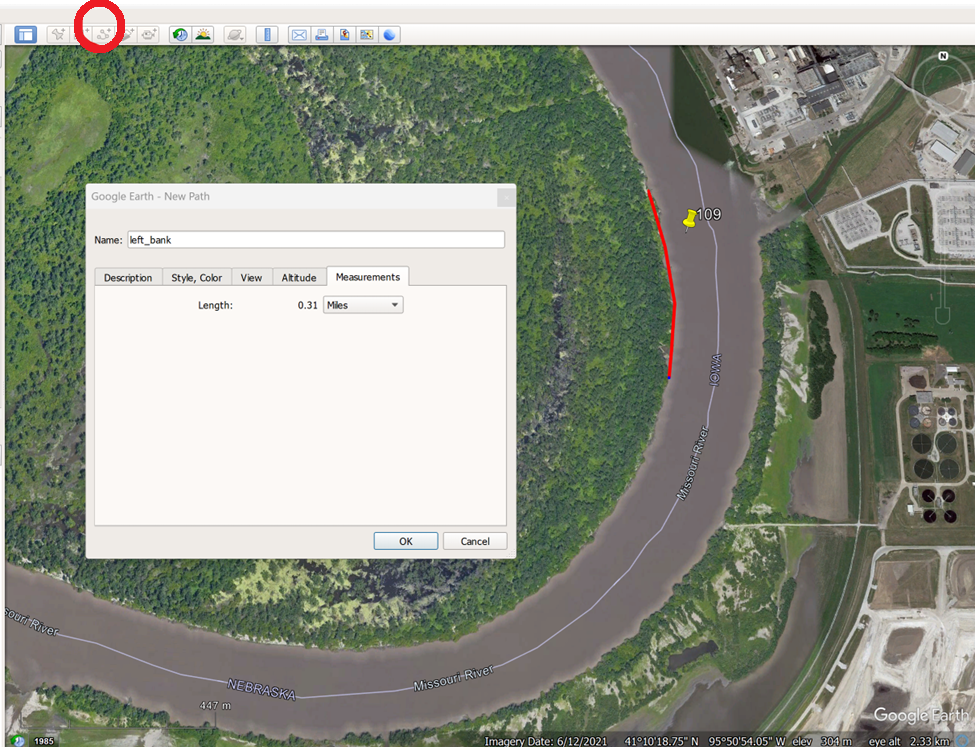
Step 1
Map the left bank using the path tool. You can zoom into the river using the scroll-wheel. Flatten the mapping projection by pressing u. Leave the pop-up window open while you are mapping. You can erase the last point placed in a path by left-clicking. To erase a different point on the path, select the point with a right-click and then erase with a left-click and then select the last point to continue mapping downstream. To move a point, select it with a right-click. The selected point is highlighted blue, other points in the current path are highlighted red. The mapped distance downstream is shown in the measurements tab in the path tool pop-up window. When done mapping the left bank, close the pop-up window for the path
Step 2
Save the path to a .kml file by right clicking on the path in Places and selecting 'save as'. Be sure to save as a .kml and not .kmz file. It is generally good practice to do this for each new path to ensure that no work is lost if Google Earth Pro crashes
Step 3
Repeat (1) and (2) for the right bank by starting a new path
Convert two .kml files from Google Earth Pro (for the left and right bank) and export the coordinates into a text file
extractPointsToTextFile(left_kml=None,
			right_kml=None,
			text_output_name=None)
- [REQUIRED] left_kml (string): File location of the kml file for left bank
- [REQUIRED] right_kml (string): File location of the kml file for right bank
- [REQUIRED] text_output_name (string): Output file name (and location)
import centerline_width
centerline_width.extractPointsToTextFile(left_kml="leftbank.kml",
					right_kml="rightbank.kml",
					text_output_name="data/river_coords_output.txt")
Output: The text file data/river_coords_output.txt with the headers llat, llon, rlat, rlon (for the left latitude, left longitude, right latitude, and right longitude)
Example:
     llat       llon      rlat       rlon
30.037581 -92.868569 30.119804 -92.907933
30.037613 -92.868549 30.119772 -92.907924
30.037648 -92.868546 30.119746 -92.907917
30.037674 -92.868536 30.119721 -92.907909
30.037702 -92.868533 30.119706 -92.907905
Convert a text file with coordinates for a left and right bank's latitude and longitude to a csv file with columns for the left bank latitude (llat), left bank longitude (llon), right bank latitude (rlat), right bank longitude (rlon)
convertColumnsToCSV(text_file=None, flip_direction=False)
- [REQUIRED] text_file (string): File location of the text file to convert
- [OPTIONAL] flip_direction (boolean): If the latitude/longitude of the banks are generated in reverse order, flip the final values so left/right bank are in order
Scripts expects data as a list of point for left and right banks:
- Header: llat, llon, rlat, rlon
import centerline_width
centerline_width.convertColumnsToCSV(text_file="data/river_coords.txt",
				flip_direction=True)
Converts text file:
     llat       llon      rlat       rlon
30.037581 -92.868569 30.037441 -92.867476
30.037613 -92.868549 30.037448 -92.867474
30.037648 -92.868546 30.037482 -92.867449
30.037674 -92.868536 30.037506 -92.867432
30.037702 -92.868533 30.037525 -92.867430
To a CSV file:
llat,llon,rlat,rlon
30.037581,-92.868569,30.037441,-92.867476
30.037613,-92.868549,30.037448,-92.867474
30.037648,-92.868546,30.037482,-92.867449
30.037674,-92.868536,30.037506,-92.867432
30.037702,-92.868533,30.037525,-92.867430
Output: A csv file data/river_coords.csv with the headers llat, llon, rlat, rlon
First, generate a river object to contain river data and available transformations
centerline_width.riverCenterline(csv_data=None,
				optional_cutoff=None,
				interpolate_data=False,
				interpolate_n=5,
				interpolate_n_centerpoints=None,
				equal_distance=10,
				ellipsoid="WGS84")
- [REQUIRED] csv_data (string): File location of the text file to convert
- [OPTIONAL] optional_cutoff (int): Include only the first x number of the data to chart (useful for debugging)
- [OPTIONAL] interpolate_data (boolean): Interpolate between existing data by adding additional points
- [OPTIONAL] interpolate_n (int): Number of additional points to add between existing data, defaults to 5 (note: larger numbers will take exponentially longer to run, recommends less than 15)
- [OPTIONAL] interpolate_n_centerpoints (int): Number of points used to interpolate the Voronoi centerline, defaults to the the length of the data frame (df_len)
- [OPTIONAL] equal_distance (int): Equal distance between points (in meters) used to interpolate the Voronoi centerline, defaults 10 meters
- [OPTIONAL] ellipsoid (string): Ellipsoid definition of Earth to provide size and shape for built-in functions to convert degrees to meters, options include (is sensitive to case): ["GRS80", "airy", "bessel", "clrk66", "intl", "WGS60", "WGS66", "WGS72", "WGS84", "sphere"] for more details: "Built-in ellipsoid definitions", defaults to "WGS84"
Equal Distance - Equal linear distance between points
equal_distance will generate points along the centerline that are an equal linear distance from one another in meters. When equal_distance=5 each point will be 5 meters apart
| equal_distance=5 | equal_distance=20 |
|---|---|
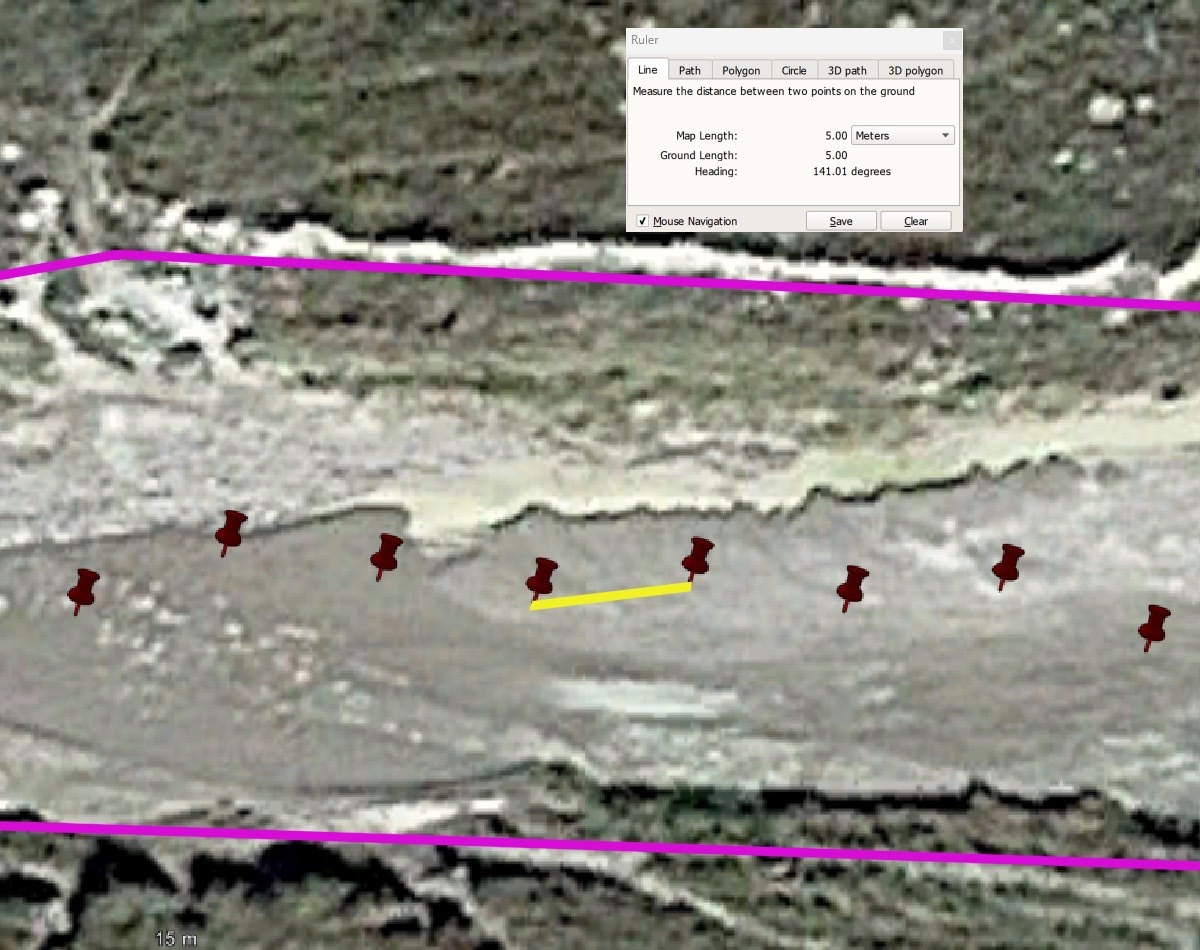 |
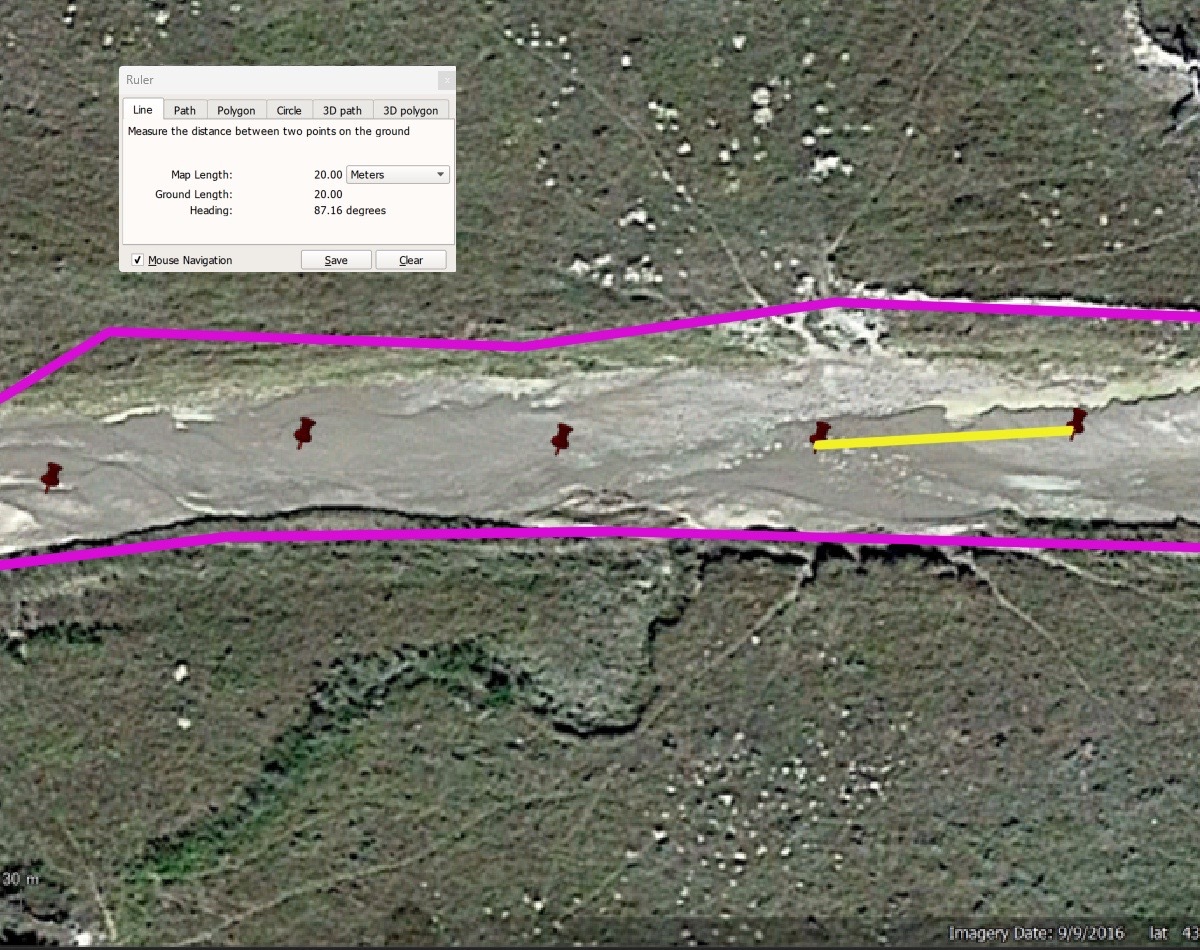 |
The red pins represent the equal distance centerline coordinates produced by centerline-width. The yellow line is the distance measured in Google Earth Pro between the points. The mapped river banks are in purple.
Interpolation - A solution for sparse data
interpolate_data is an option that can be used to find a centerline when the existing data generates a Voronoi graph that is jagged or contains gaps due to the combination of sparse data and a narrow river (See: Debugging, Error Handling, and Edge Cases - Fix Gaps and Jagged Centerlines). By default, interpolate_data=True will add 5 additional points between each existing point but can be increased or decreased by modifying the interpolate_n option
interpolate_n_centerpoints is an option that can be used to increase the resolution (number of points) of the centerline found by the Voronoi vertices. By default, will evenly space out to the size of the dataframe. Can artificially increase the amount of width lines generated by increasing the number of center points. When interpolate_n_centerpoints increases, the number of width lines generated will increase (and visa versa)
| interpolate_n_centerpoints=75 | interpolate_n_centerpoints=200 |
|---|---|
 |
 |
Object (class) useful attributes:
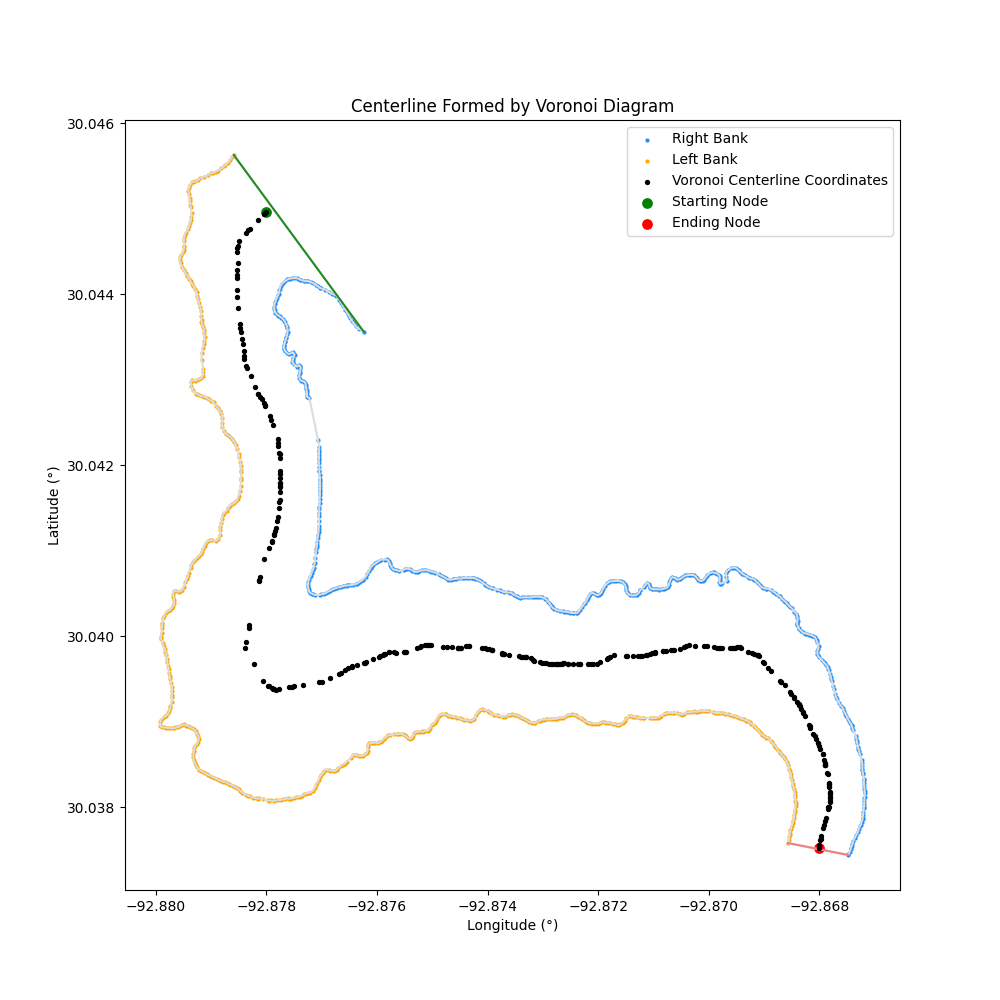
- centerlineVoronoi (list of tuples): List of the latitude and longitude coordinates of the centerline generated by Voronoi diagrams
- centerlineEqualDistance (list of tuples): List of the latitude and longitude coordinates of the centerline generated by equal distances between coordinates from the Voronoi diagrams
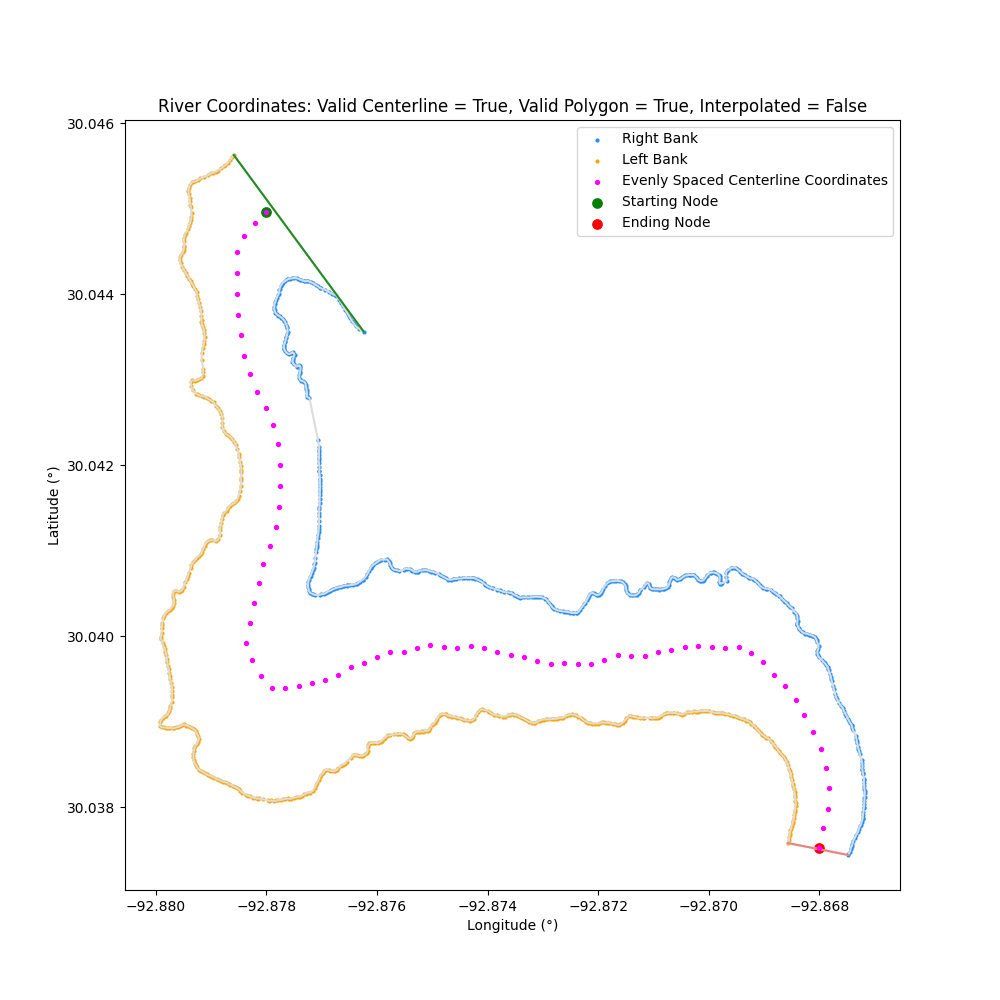
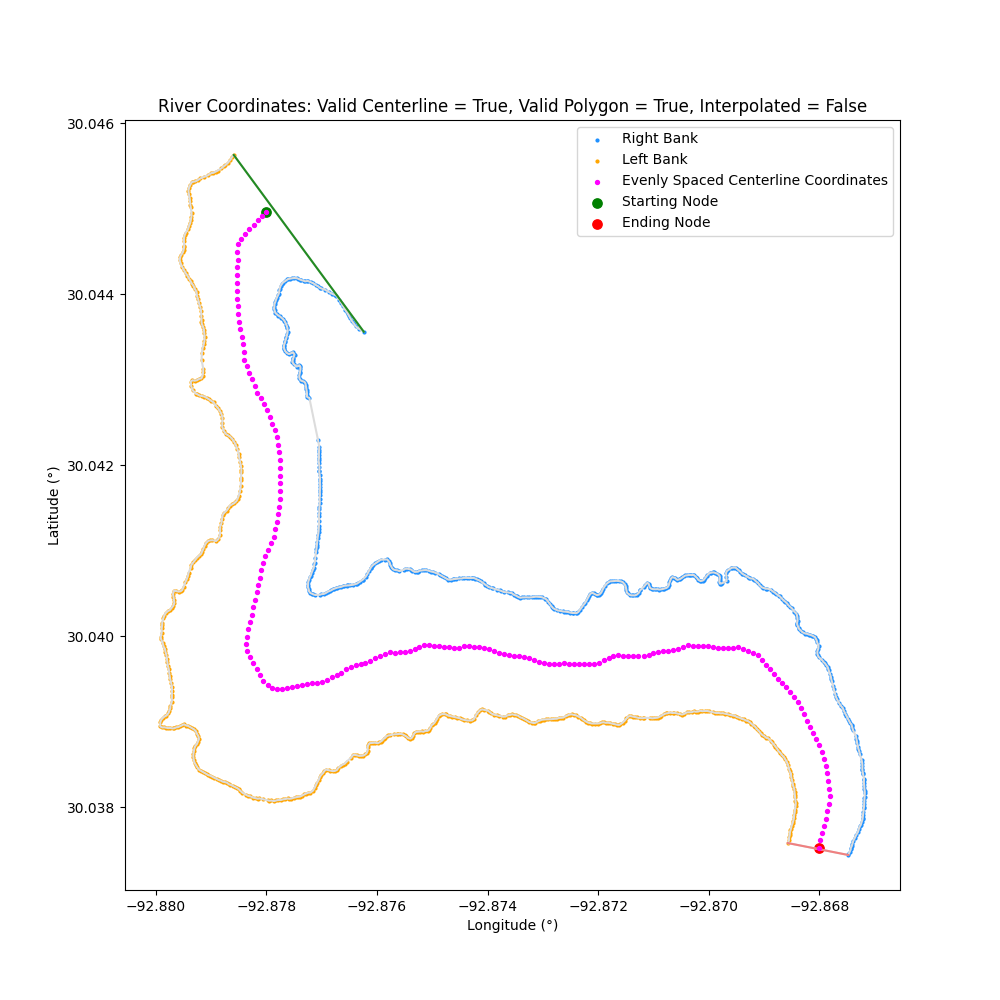
- centerlineEvenlySpaced (list of tuples): List of the latitude and longitude coordinates of the centerline generated by evenly spacing out points generated by the Voronoi diagrams
- centerlineSmoothed (list of tuples): List of the latitude and longitude coordinates of the centerline generated by smoothing out the evenly spaced-out points generated by the Voronoi diagrams
- centerlineLength (float): Length of the centerline of the river (in km)
- rightBankLength (float): Length of the right bank of the river (in km)
- leftBankLength (float): Length of the left bank of the river (in km)
- riverArea (float): Area contained within river bank polygon (in km^2)
- centerlineVoronoiRelative (list of tuples): List of the relative distance coordinates of the centerline generated by Voronoi diagrams
- centerlineEqualDistanceRelative (list of tuples): List of the relative distance coordinates of the centerline generated by equal distances between coordinates from the Voronoi diagrams
- centerlineEvenlySpacedRelative (list of tuples): List of the relative distance coordinates of the centerline generated by evenly spacing out points generated by the Voronoi diagrams
- centerlineSmoothedRelative (list of tuples): List of the relative distance coordinates of the centerline generated by smoothing out the evenly spaced out points generated by the Voronoi diagrams
Object (class) additional attributes:
- river_name (string): name of object, set to the csv_data string
- left_bank_coordinates (list of tuples): list of latitude/longitude coordinates of the left bank generated from the csv file (
[(x, y), (x, y)]) - right_bank_coordinates (list of tuples) list of latitude/longitude coordinates of the right bank generated from the csv file (
[(x, y), (x, y)]) - left_bank_relative_coordinates (list of tuples): list of relative distances coordinates of the left bank, measured as the distance in meters from the first point on the left bank (
[(x, y), (x, y)]) - right_bank_relative_coordinates (list of tuples): list of relative distances coordinates of the right bank, measured as the distance in meters from the first point on the left bank (
[(x, y), (x, y)]) - df_len (int): Length of the data frame of the csv data (spliced by the optional_cutoff)
- equal_distance (int): Distance between points (in meters) used in centerlineEqualDistance, defaults to points every 10 meters
- ellipsoid (string): Built-in ellipsoid definition of Earth to determine how degrees are converted to meters used by centerlineEqualDistance, defaults to "WGS84"
- bank_polygon (Shapley Polygon): Multi-sided polygon generated to encapsulate the latitude/longitude coordinate riverbank (used to define an inside and an outside of the river)
- bank_polygon_relative (Shapley Polygon): Multi-sided polygon generated to encapsulate the relative distance coordinate riverbank (used to define an inside and an outside of the river)
- top_bank (Shapley Linestring): Linestring that represents the top of the river/polygon for the latitude/longitude coordinate system
- top_bank_relative (Shapley Linestring): Linestring that represents the top of the river/polygon for the relative distance coordinate system
- bottom_bank (Shapley Linestring): Linestring that represents the bottom of the river/polygon for the latitude/longitude coordinate system
- bottom_bank_relative (Shapley Linestring): Linestring that represents the bottom of the river/polygon for the relative distance coordinate system
- starting_node (tuple): Tuple of the starting position (latitude and longitude) of the centerline path
- starting_node_relative (tuple): Tuple of the starting position (relative distance x and relative distance y) of the centerline path
- ending_node (tuple): Tuple of the end position (latitude and longitude) of the centerline path
- ending_node_relative (tuple): Tuple of the end position (relative distance x and relative distance y) of the centerline path
- bank_voronoi (scipy Voronoi object): Voronoi generated by left/right banks of the latitude/longitude coordinate system
- bank_voronoi_relative (scipy Voronoi object): Voronoi generated by left/right banks of the relative distance coordinate system
- x_voronoi_ridge_point (list of tuples): X positions on Voronoi ridge (starting Latitude position to ending Latitude position)
- y_voronoi_ridge_point (list of tuples): Y position on Voronoi ridge (starting Longitude position to ending Longitude position)
- x_voronoi_ridge_point_relative (list of tuples): X positions on Voronoi ridge (starting Relative Distance X position to ending Relative Distance X position)
- y_voronoi_ridge_point_relative (list of tuples): Y position on Voronoi ridge (starting Relative Distance Y position to ending Relative Distance Y position)
- interpolate_data (boolean): if interpolating between existing data, defaults to False
- interpolate_n (int): specifies how many additional points will be added between points along the riverbank when interpolating data, defaults to 5
- interpolate_n_centerpoints (int): specifies how many points will be used to interpolate the Voronoi centerline, defaults to the length of the data frame (df_len)
import centerline_width
river_object = centerline_width.riverCenterline(csv_data="data/river_coords.csv")Return the coordinates of the centerline based on the left and right banks with either Decimal Degree (latitude/longitude) or Relative Distance (meters)
Types of Centerlines
There are four types of centerline coordinates formed from the riverbank data
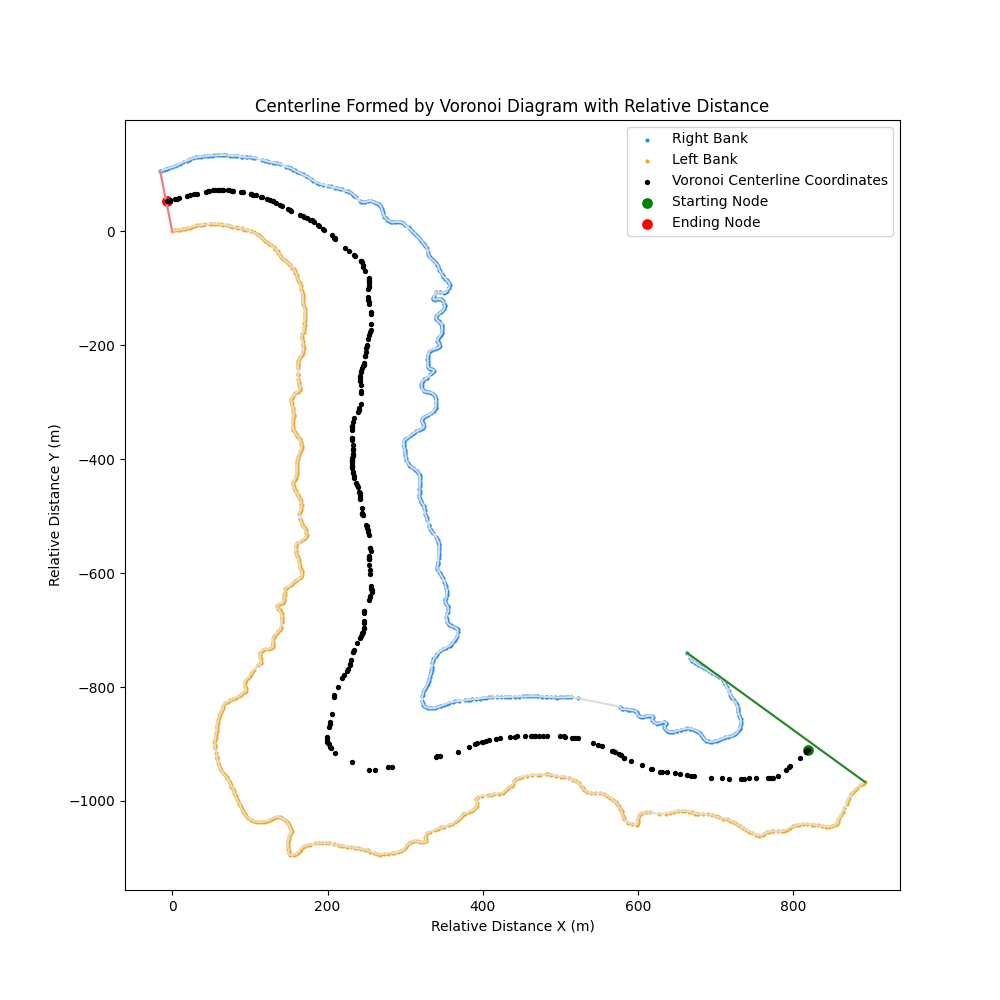
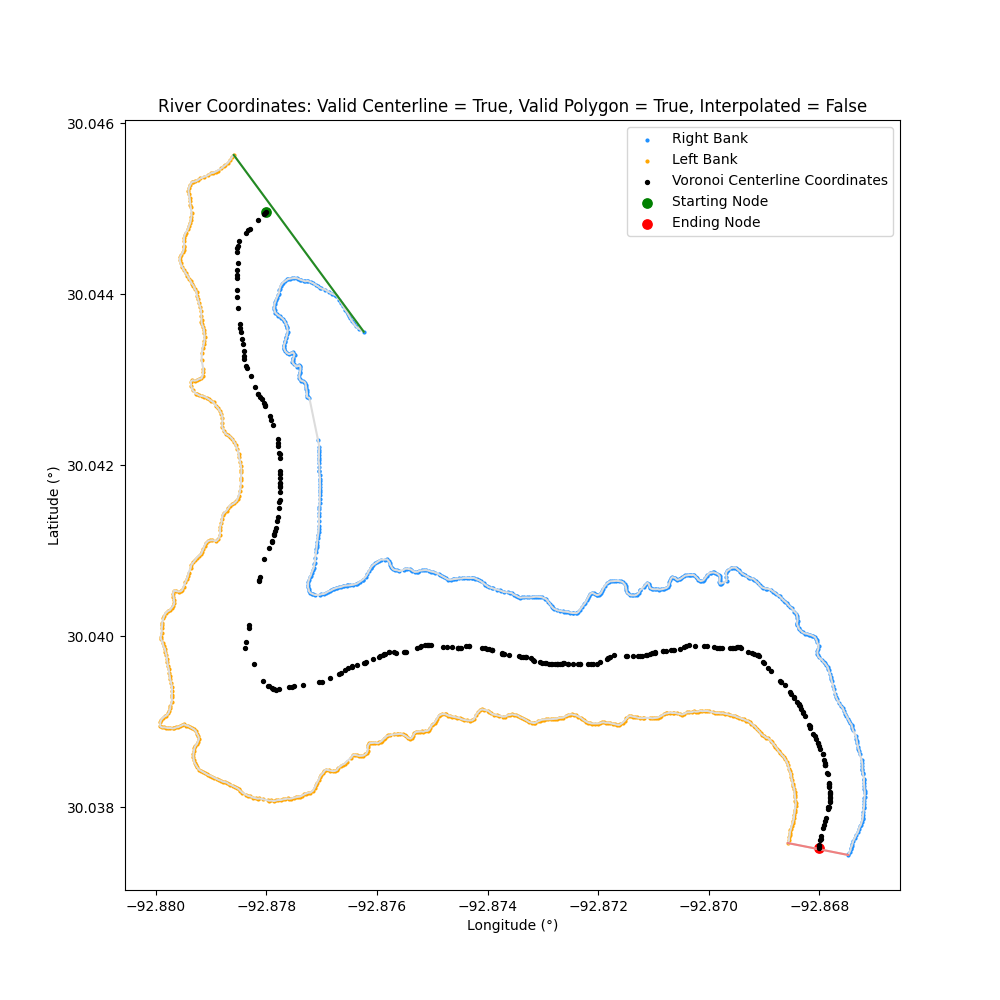
- Voronoi centerline: centerline generated from where Voronoi vertices intersect within the river
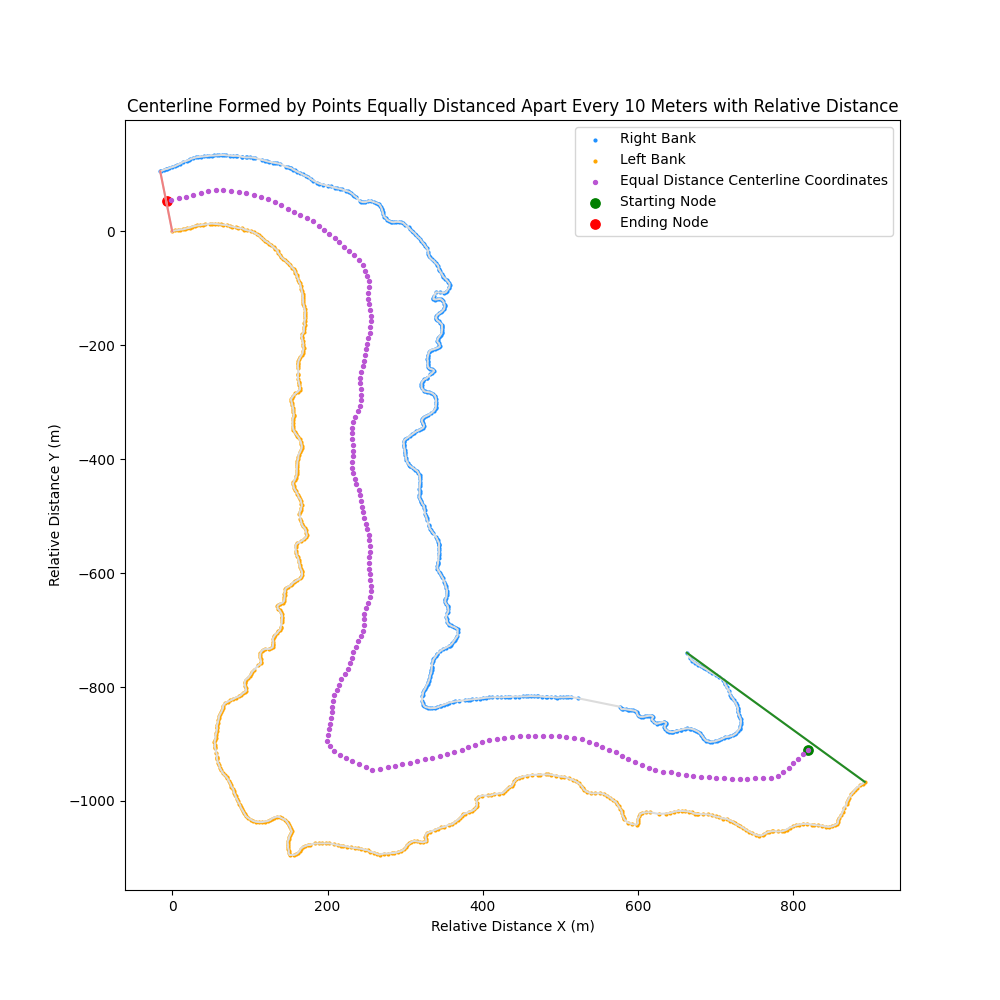
- Equal Distance Centerline: centerline based on Voronoi centerline but each point is equally spaced out from the previous (in meters) and takes into account the radius of the Earth to convert degrees to meters (example below:
equal_distance=10)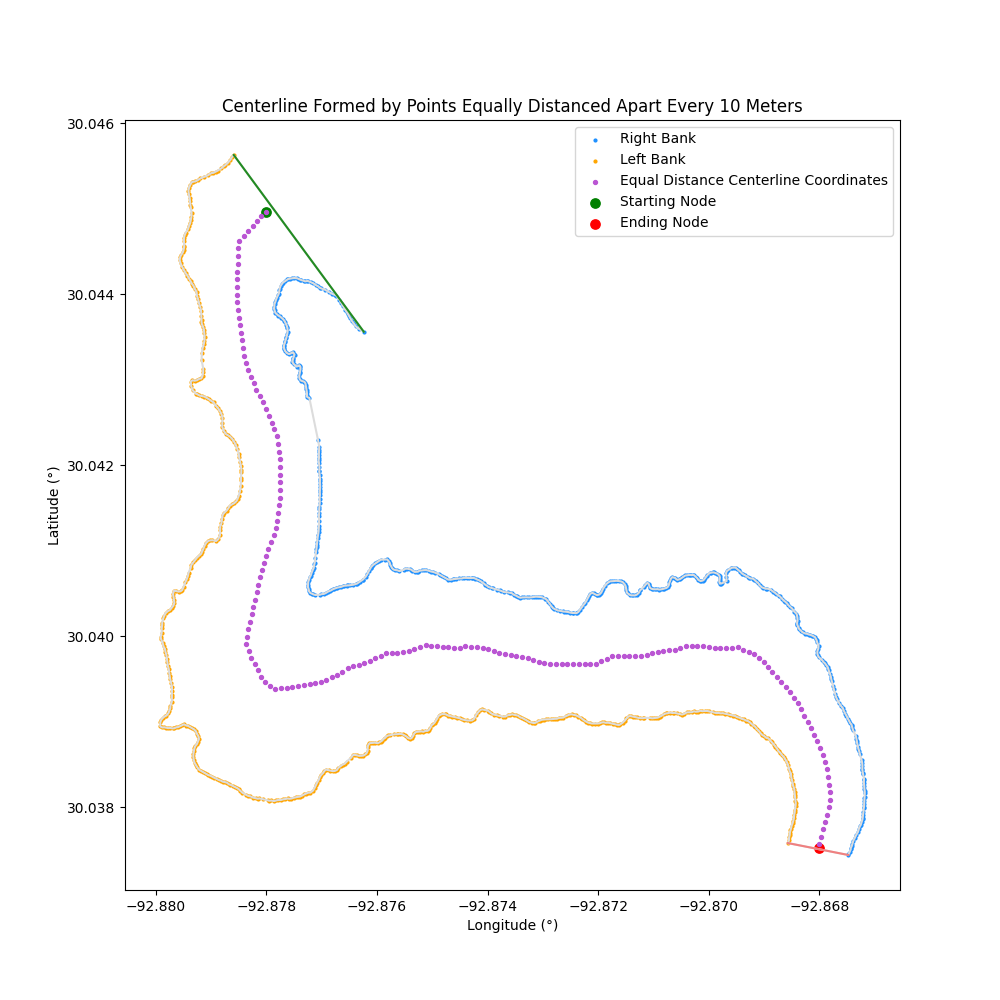
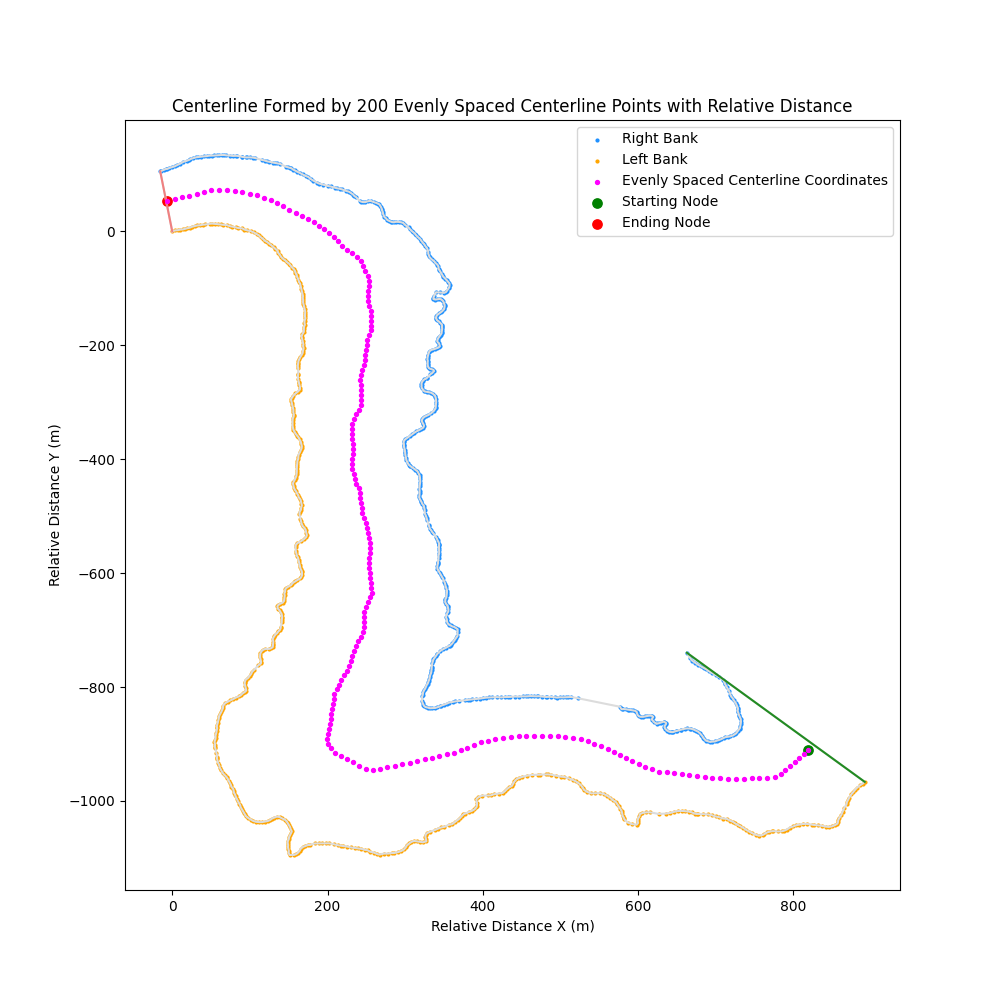
- Evenly Spaced Centerline: centerline based on Voronoi centerline but evenly spaced with a fixed number of points (example:
interpolate_n_centerpoints=200)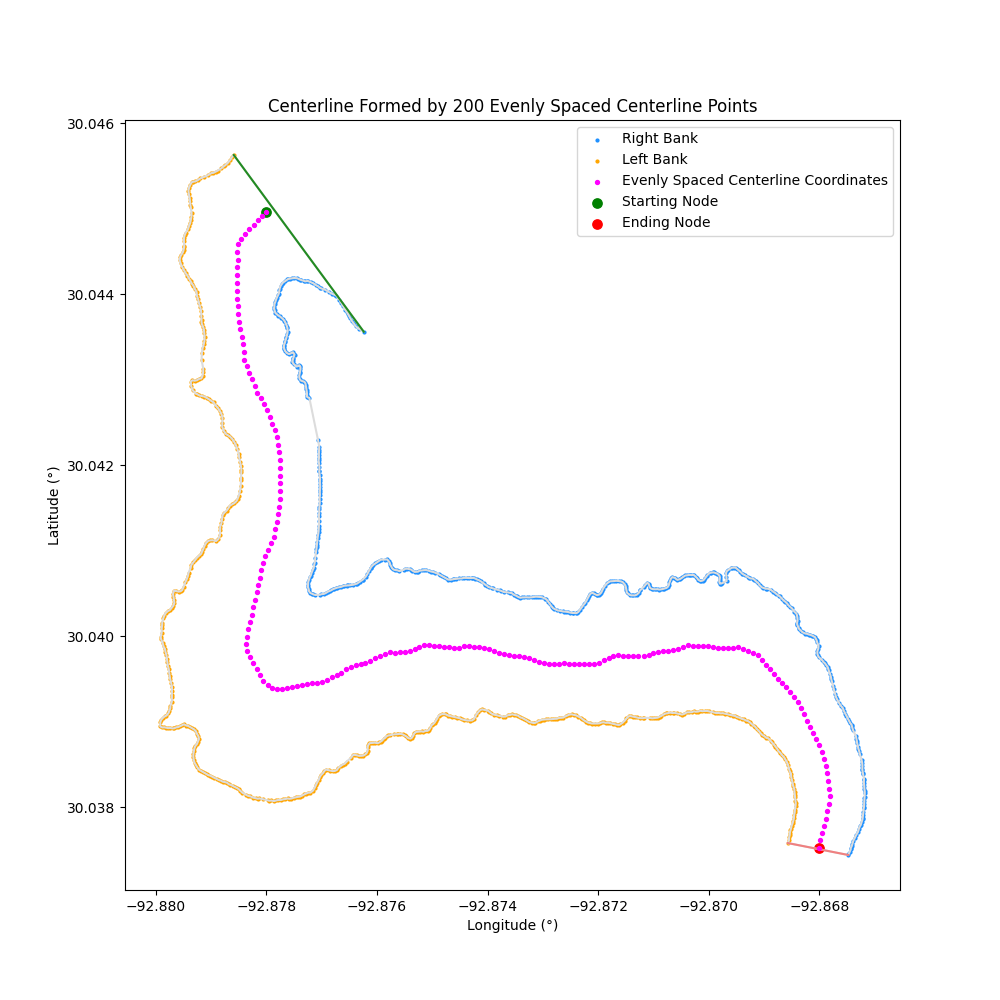
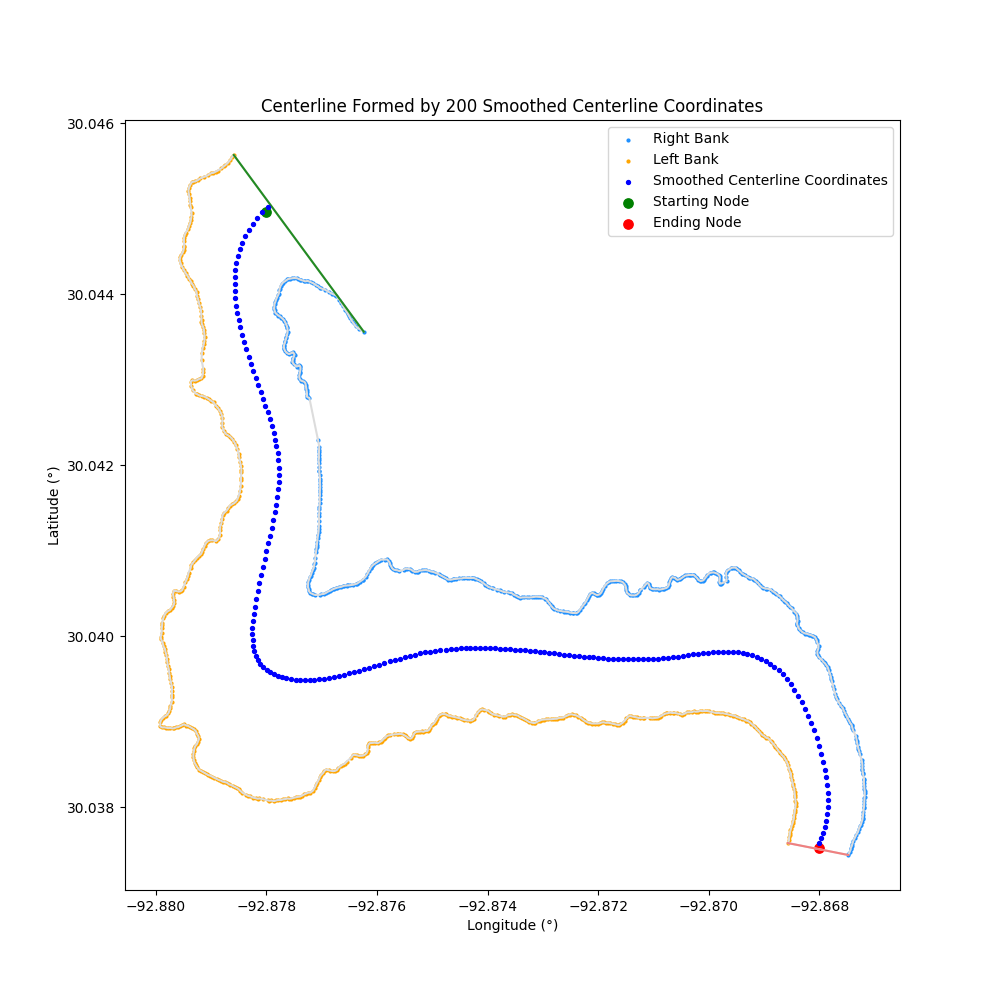
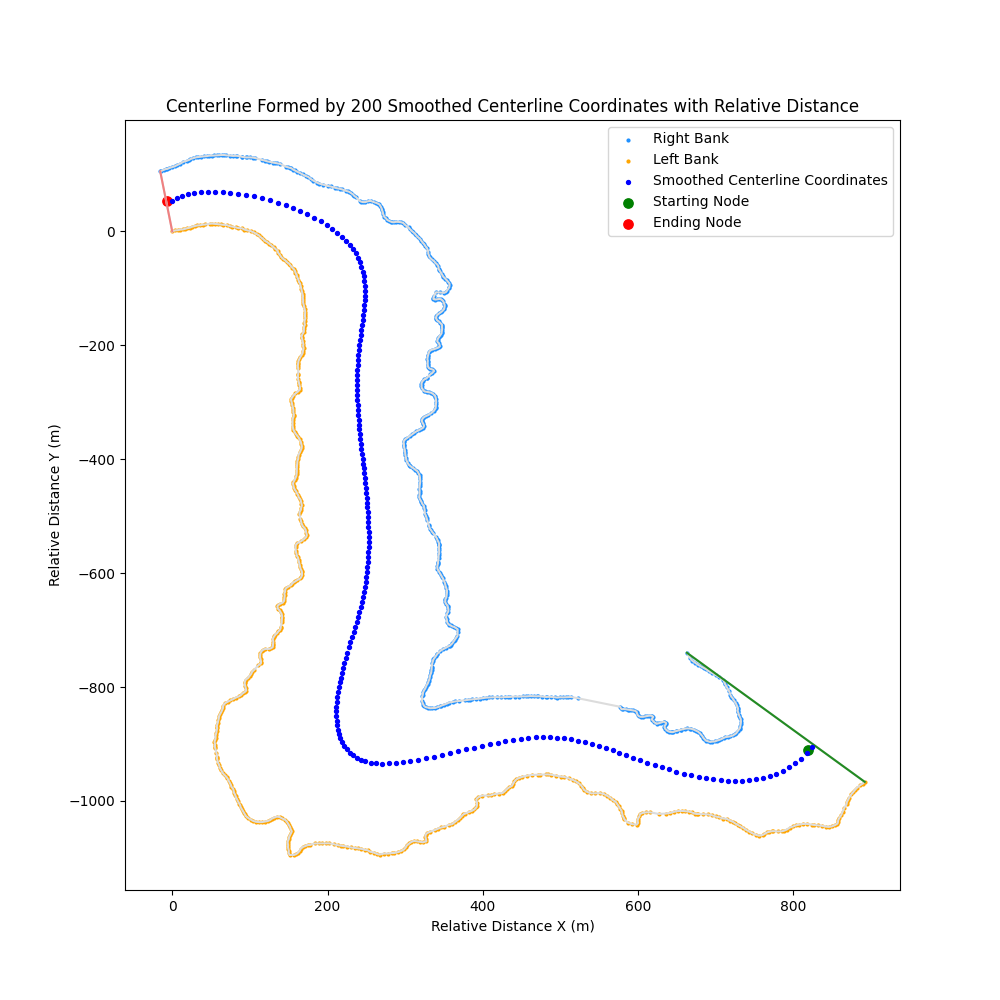
- Smoothed Centerline: centerline generated from the evenly spaced centerline but smoothed by a b-spline
By default, coordinates are formed in Decimal Degrees, but can be set to Relative Distance. Relative Distance measures the distance (in meters) of a point from the first point on the left bank
Centerline coordinates are formed by the Voronoi vertices
river_object.centerlineVoronoi
| river_object.centerlineVoronoi | river_object.centerlineVoronoiRelative |
|---|---|
|
 |
Centerline coordinates are formed by Equally Distanced vertices, set by equal_distance
river_object.centerlineEqualDistance
| river_object.centerlineEqualDistance | river_object.centerlineEqualDistanceRelative |
|---|---|
|
 |
Centerline coordinates are formed by Evenly Spaced vertices, set by interpolate_n_centerpoints
river_object.centerlineEvenlySpaced
| river_object.centerlineEvenlySpaced | river_object.centerlineEvenlySpacedRelative |
|---|---|
|
 |
Centerline coordinates are formed from Smoothed vertices
river_object.centerlineSmoothed
| river_object.centerlineSmoothed | river_object.centerlineSmoothedRelative |
|---|---|
|
 |
Example:
import centerline_width
river_object = centerline_width.riverCenterline(csv_data="data/river_coords.csv")
river_centerline_coordinates = river_object.centerlineVoronoi
Output is a list of tuples: (example) [(-92.86788596499872, 30.03786596717931), (-92.86789573751797, 30.037834641974108), (-92.8679141386283, 30.037789636848878), (-92.8679251193248, 30.037756853899904), (-92.86796903819089, 30.03765423778148), (-92.86797335733262, 30.037643336049054), (-92.8679920356456, 30.037592224469797), (-92.86800576063828, 30.037555441489403), (-92.86800841510367, 30.037546512833107), (-92.8680119498663, 30.03753043193875)]
Save the centerline coordinates to a csv file with columns for latitude and longitude. This is the file format for a table of (latitude,longitude) pairs accepted to import back into Google Earth Pro.
saveCenterlineCSV(save_to_csv=None, centerline_type="Voronoi", coordinate_unit="Decimal Degrees")
- [REQUIRED] save_to_csv (string): CSV filename, requires a .csv extension
- [OPTIONAL] centerline_type (string): Centerline type to save to CSV (not case-sensitive), options: ["Voronoi", "Evenly Spaced", "Smoothed", "Equal Distance"], defaults to "Voronoi"
- [OPTIONAL] latitude_header (string): Column header for latitude values, defaults to
<centerline_type> Centerline Latitude (Deg)or<centerline_type> Relative Distance Y (from Latitude) (m) - [OPTIONAL] longitude_header (string): Column header for longitude values, defaults to
<centerline_type> Centerline Longitude (Deg)or<centerline_type> Relative Distance X (from Longitude) (m) - [OPTIONAL] coordinate_unit (string): Coordinates of the river are return as "Decimal Degrees" (latitude/longitude) or converted to a distance from the first point on the left bank as "Relative Distance", defaults to "Decimal Degrees"
import centerline_width
river_object = centerline_width.riverCenterline(csv_data="data/river_coords.csv")
river_object.saveCenterlineCSV(save_to_csv="centerline_coordinates.csv", centerline_type="Smoothed")
Returns a csv with the Latitude and Longitude coordinates of the specified centerline with column headers with centerline type: Smoothed Centerline Latitude (Deg), Smoothed Centerline Longitude (Deg)
Note: it is best practice to plot the centerline with plotCenterline() to ensure that the results saved are as expected
Save the centerline coordinates to a .mat file with columns for latitude and longitude
saveCenterlineMAT(save_to_mat=None, centerline_type="Voronoi", coordinate_unit="Decimal Degrees")
- [REQUIRED] save_to_mat (string): MAT filename, requires a .mat extension
- [OPTIONAL] centerline_type (string): Centerline type to save to MAT (not case-sensitive), options: ["Voronoi", "Evenly Spaced", "Smoothed", "Equal Distance"], defaults to "Voronoi"
- [OPTIONAL] latitude_header (string): Column header for latitude values, defaults to
<centerline_type>_Centerline_Latitude_(Deg)or<centerline_type>_Relative_Distance_Y_From_Latitude_m(cannot include spaces or special characters) - [OPTIONAL] longitude_header (string): Column header for Longitude values, defaults to
<centerline_type>_Centerline_Longitude_(Deg)or<centerline_type>_Relative_Distance_X_From_Longitude_m(cannot include spaces or special characters) - [OPTIONAL] coordinate_unit (string): Coordinates of the river are return as "Decimal Degrees" (latitude/longtidue) or converted to a distance from the first point on the left bank as "Relative Distance", defaults to "Decimal Degrees"
import centerline_width
river_object = centerline_width.riverCenterline(csv_data="data/river_coords.csv")
river_object.saveCenterlineMAT(save_to_mat="centerline_coordinates.mat", centerline_type="Smoothed")
Returns a .mat file with the Latitude and Longitude coordinates of the specified centerline with column headers with centerline type: Smoothed_Centerline_Latitude_(Deg), Smoothed_Centerline_Longitude_(Deg)
Note: it is best practice to plot the centerline with plotCenterline() to ensure that the results saved are as expected
Return the length of the centerline found between the left and right bank generated by the Voronoi diagram
river_object.centerlineLength
Length returned in kilometers
import centerline_width
river_object = centerline_width.riverCenterline(csv_data="data/river_coords.csv")
river_centerline_length = river_object.centerlineLength
The length of the river centerline returns 215.34700589636674 km
Return the area contained within the polygon generated the left and right bank latitude/longitudes
river_object.riverArea
Area returned in kilometers^2
import centerline_width
river_object = centerline_width.riverCenterline(csv_data="data/river_coords.csv")
river_area = river_object.riverArea
The area of the river returns 334.0398585246558 km^2
Plot the centerline created from a list of right and left banks
plotCenterline(centerline_type="Voronoi",
		marker_type="line",
		centerline_color="black",
		dark_mode=False,
		equal_axis=False,
		display_all_possible_paths=False,
		plot_title=None,
		save_plot_name=None,
		display_voronoi=False,
		show_plot=True,
		coordinate_unit="Decimal Degrees")
- [OPTIONAL] centerline_type (string): Centerline type graph within river (not case-sensitive), options: ["Voronoi", "Evenly Spaced", "Smoothed", "Equal Distance"], defaults to "Voronoi"
- [OPTIONAL] marker_type (string): Graph type (not case-sensitive), options: ["Line", "Scatter"], defaults to "Line"
- [OPTIONAL] centerline_color (string): Color of centerline coordinates on graph (not case-sensitive), options: matplotlib named colors, defaults to "black"
- [OPTIONAL] dark_mode (bool): Change plot to a black ground (and override if
centerline_color="black"tocenterline_color="white"), defaults to False - [OPTIONAL] equal_axis (bool): Set x/y axes in plot to be equal, defaults to False
- [OPTIONAL] display_all_possible_paths (boolean): Display all possible paths, not just the centerline (useful for debugging), defaults to False
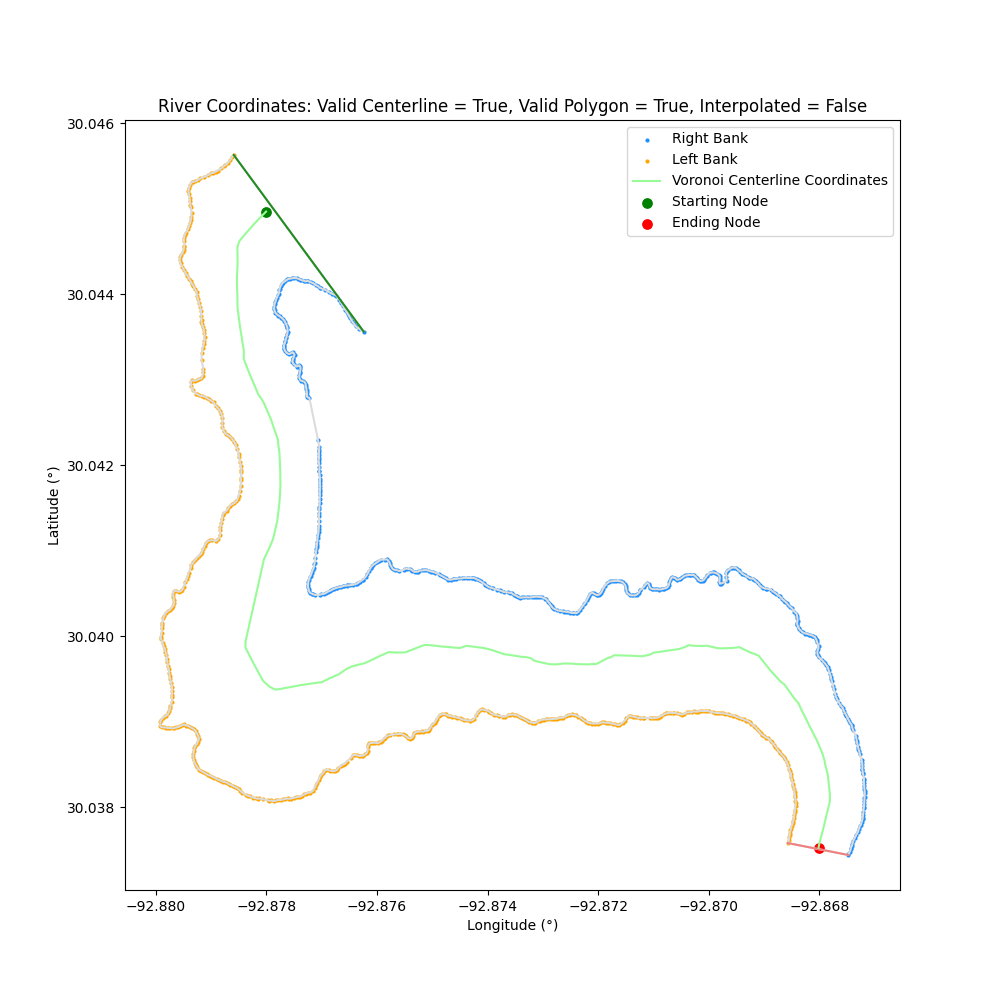
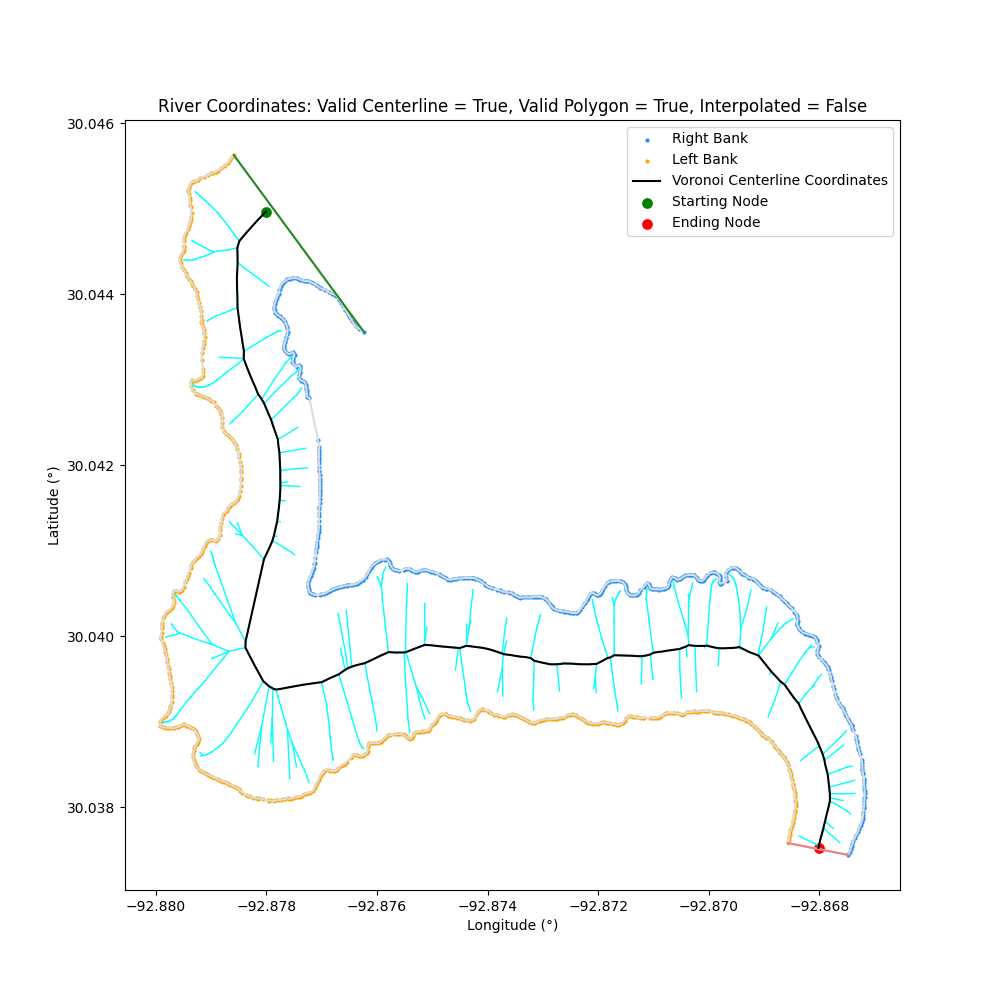
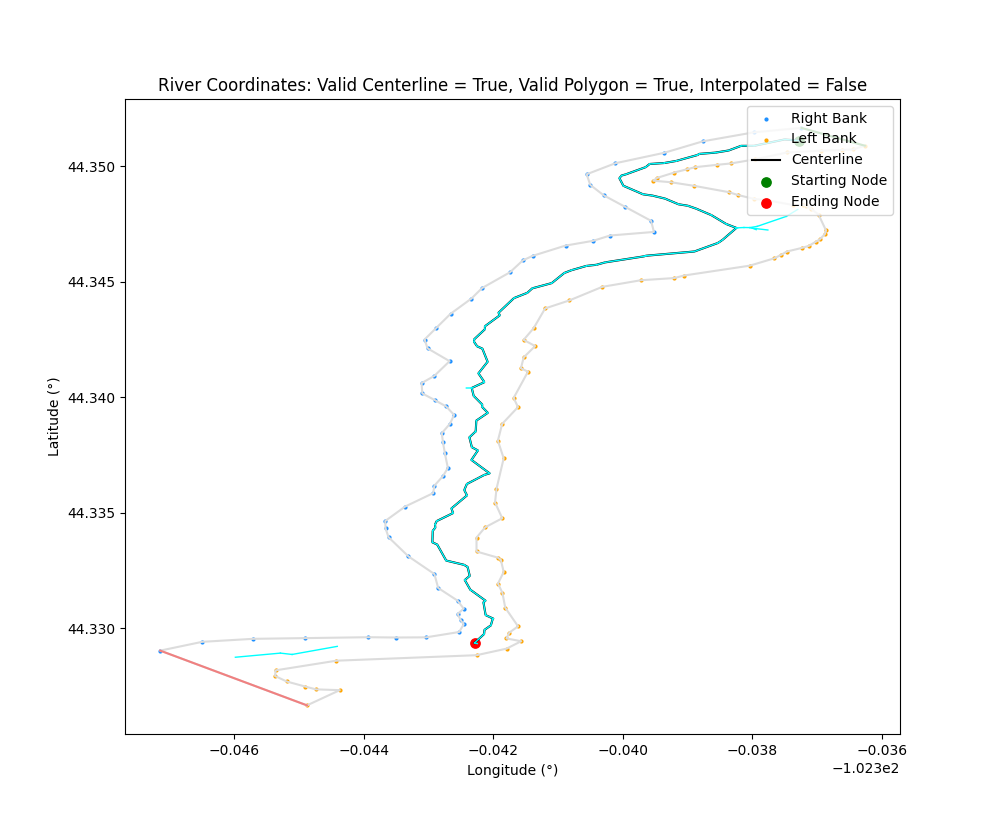
- [OPTIONAL] plot_title (string): Change plot title, defaults to "River Coordinates: Valid Centerline = True/False, Valid Polygon = True/False, Interpolated = True/False"
- [OPTIONAL] save_plot_name (string): Save the plot with a given name and location
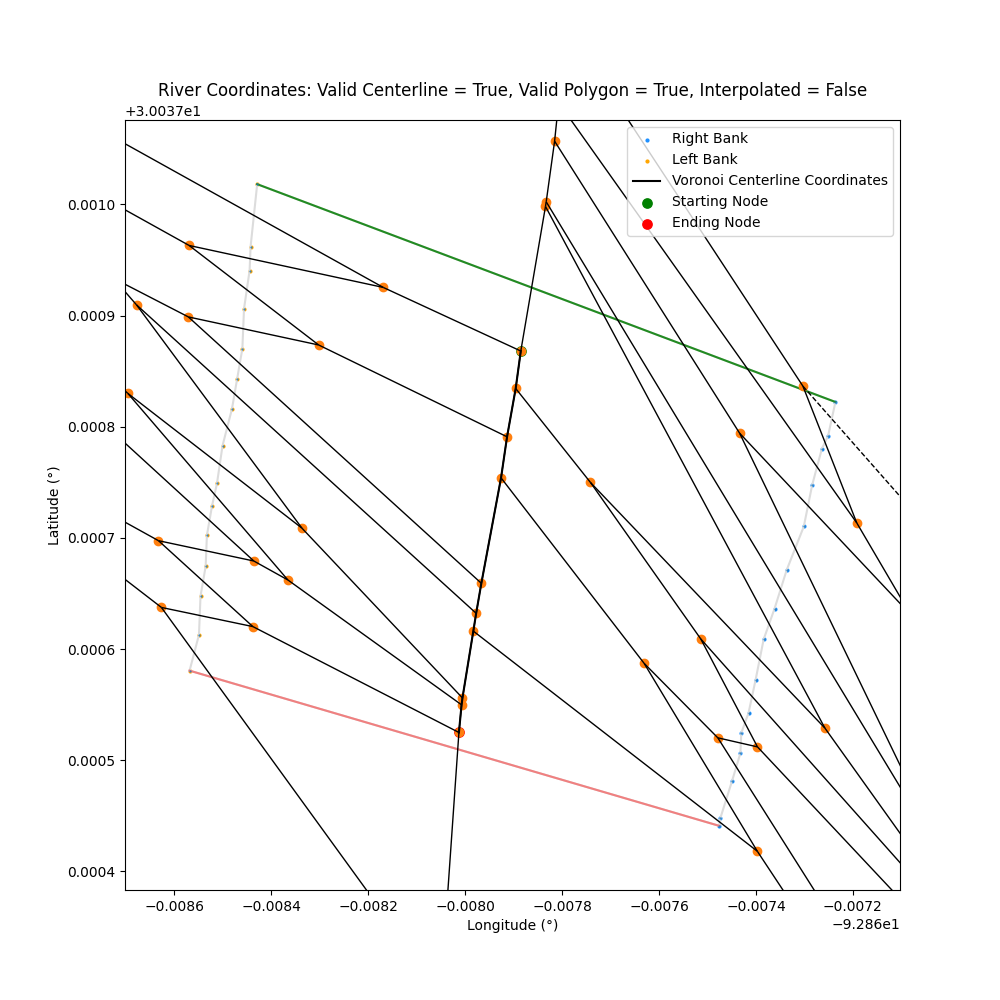
- [OPTIONAL] display_voronoi (boolean): Overlay Voronoi diagram used to generate centerline, defaults to False
- [OPTIONAL] show_plot (boolean): display and open plots (plt.show() in Matplotlib), defaults to True
- [OPTIONAL] coordinate_unit (string): Coordinates of the river are return as "Decimal Degrees" (latitude/longitude) or converted to a distance from the first point on the left bank as "Relative Distance", defaults to "Decimal Degrees"
import centerline_width
river_object = centerline_width.riverCenterline(csv_data="data/river_coords.csv")
river_object.plotCenterline()
centerline_type
Display different centerline types in plot ("Voronoi", "Evenly Spaced", "Smoothed", "Equal Distance"), but defaults to "Voronoi"
| centerline_type="Voronoi" | centerline_type="Smoothed" |
|---|---|
|
 |
marker_type
Display centerline plot as either line or scatter
| marker_type="Line" | marker_type="Scatter" |
|---|---|
|
 |
centerline_color
Change the color of the centerline, defaults to black
| centerline_color="black" | centerline_color="palegreen" |
|---|---|
|
 |
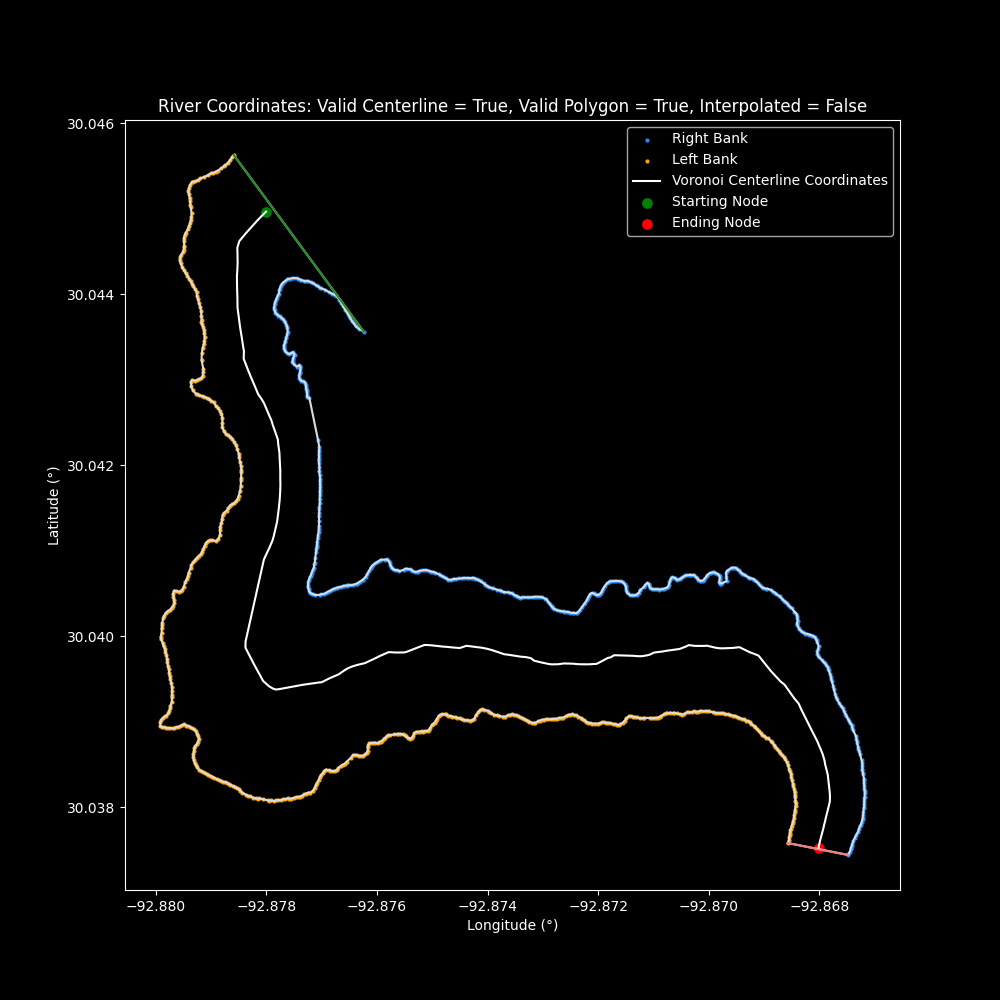
dark_mode
dark_mode will change the default Matplotlib background black and swap centerline_color from default black to white
| dark_mode=False | dark_mode=True |
|---|---|
|
 |
equal_axis
equal_axis will set the x and y axis of the plot to be equal
| equal_axis=False | equal_axis=True |
|---|---|
 |
 |
display_all_possible_paths
Display all possible paths generated by Voronoi edge ridges, defaults to False
| display_all_possible_paths=False | display_all_possible_paths=True |
|---|---|
|
 |
display_voronoi
Overlay Voronoi diagram used to generate centerline, defaults to False
| display_voronoi=False | display_voronoi=True |
|---|---|
 |
 |
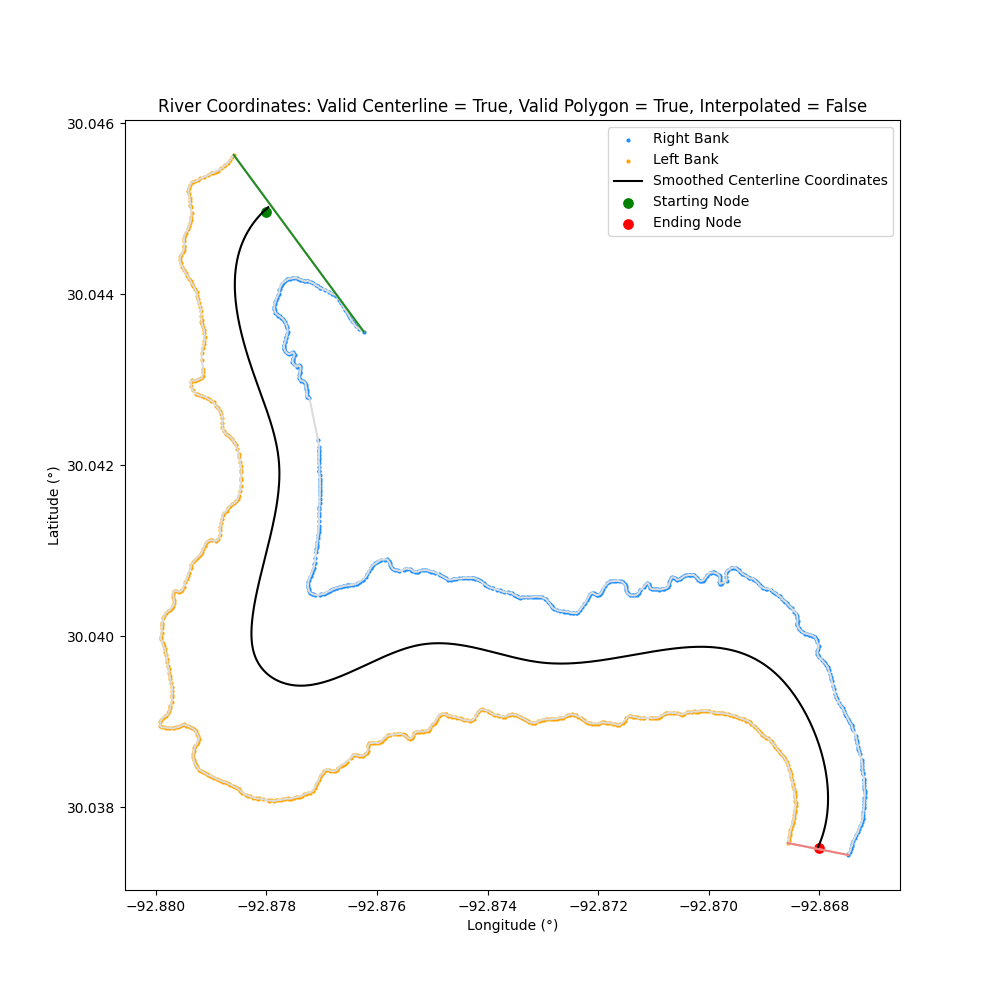
coordinate_unit
Plot as either "Decimal Degrees" and "Relative Distance". defaults to "Decimal Degrees"
| coordinate_unit="Decimal Degrees" | coordinate_unit="Relative Distance" |
|---|---|
|
 |
Plot the width of the river based on the centerline
plotCenterlineWidth(plot_title=None,
		save_plot_name=None,
		display_true_centerline=True,
		transect_span_distance=3,
		transect_slope="Average",
		apply_smoothing=False,
		flag_intersections=True,
		remove_intersections=False,
		dark_mode=False,
		equal_axis=False,
		show_plot=True,
		coordinate_unit="Decimal Degrees")
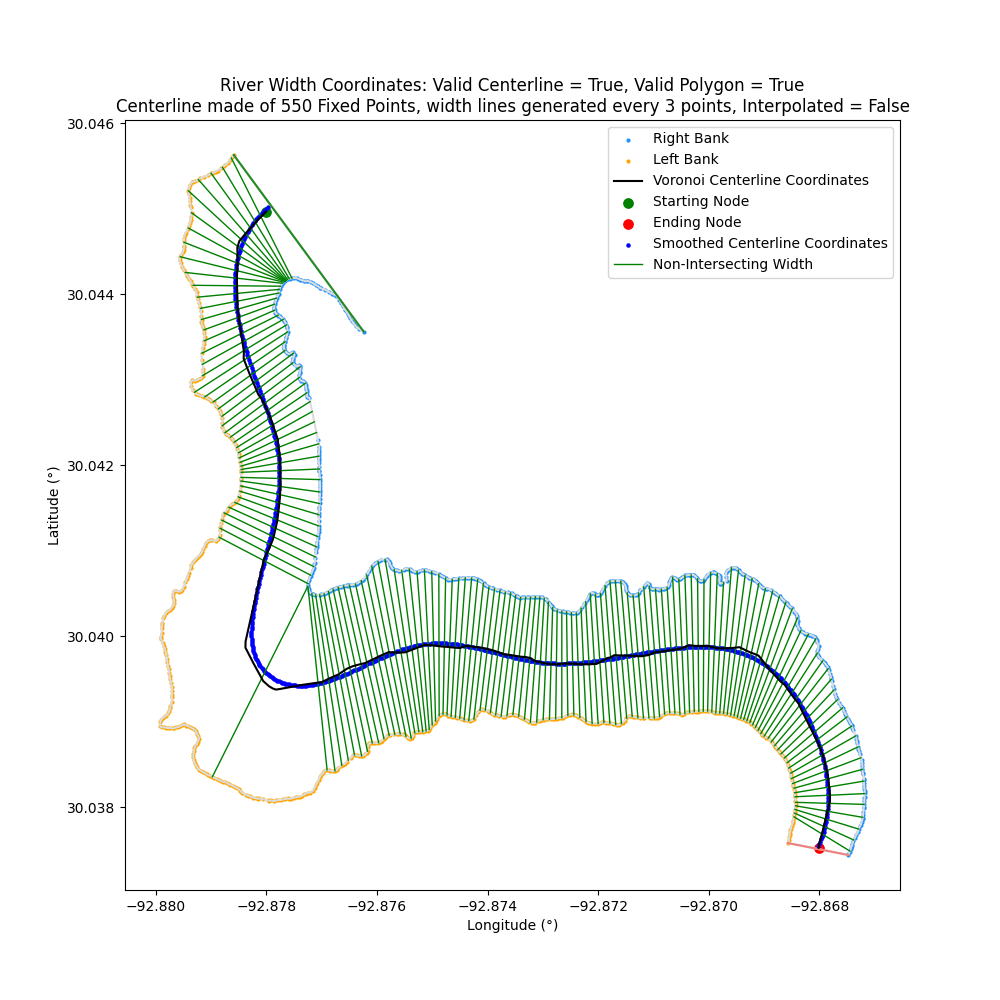
- [OPTIONAL] plot_title (string): Change plot title, defaults to "River Width Coordinates: Valid Centerline = True/False, Valid Polygon = True/False, Centerline made of <interpolate_n_centerpoints> Fixed Points, width lines generated every <transect_span_distance> points, Interpolated = True/False"
- [OPTIONAL] save_plot_name (string): Save the plot with a given name and location
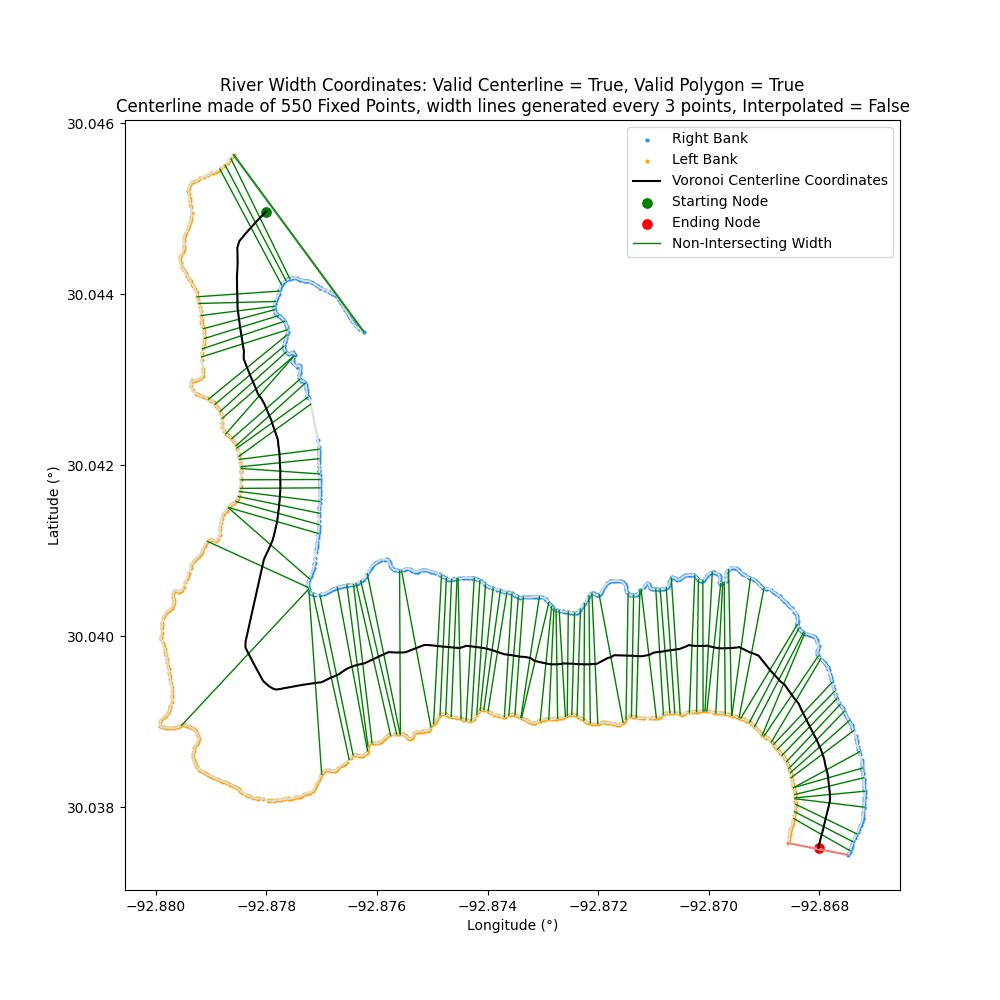
- [OPTIONAL] display_true_centerline (boolean): Display generated true centerline based on Voronoi diagrams, defaults to True
- [OPTIONAL] transect_span_distance (int): Number n points around a center point to determine the slope (increase to decrease the impact of sudden changes), defaults to 3, must be greater than 1 (since the slope is found from the difference in position between two points)
- [OPTIONAL] transect_slope (str): Determine how the width lines are generated, either by averaging all slopes "Average" or directly from the first to last point in the span distance as "Direct", defaults to "Average"
- [OPTIONAL] apply_smoothing (boolean): Apply a B-spline smoothing to centerline
- [OPTIONAL] flag_intersections (boolean): Display intersecting width lines as red in graph, defaults to True
- [OPTIONAL] remove_intersections (boolean): Remove intersecting lines (but maintain the most width lines as possible) and only return non-intersecting width lines, defaults to False
- [OPTIONAL] dark_mode (bool): Change plot to a black ground (and override if
centerline_color="black"tocenterline_color="white"), defaults to False - [OPTIONAL] equal_axis (bool): Set x/y axes in plot to be equal, defaults to False
- [OPTIONAL] show_plot (boolean): display and open plots (plt.show() in Matplotlib), defaults to True
- [OPTIONAL] coordinate_unit (string): Coordinates of the river are return as "Decimal Degrees" (latitude/longitude) or converted to a distance from the first point on the left bank as "Relative Distance", defaults to "Decimal Degrees"
import centerline_width
river_object = centerline_width.riverCenterline(csv_data="data/river_coords.csv")
river_object.plotCenterlineWidth(apply_smoothing=True, remove_intersections=True, display_true_centerline=False)
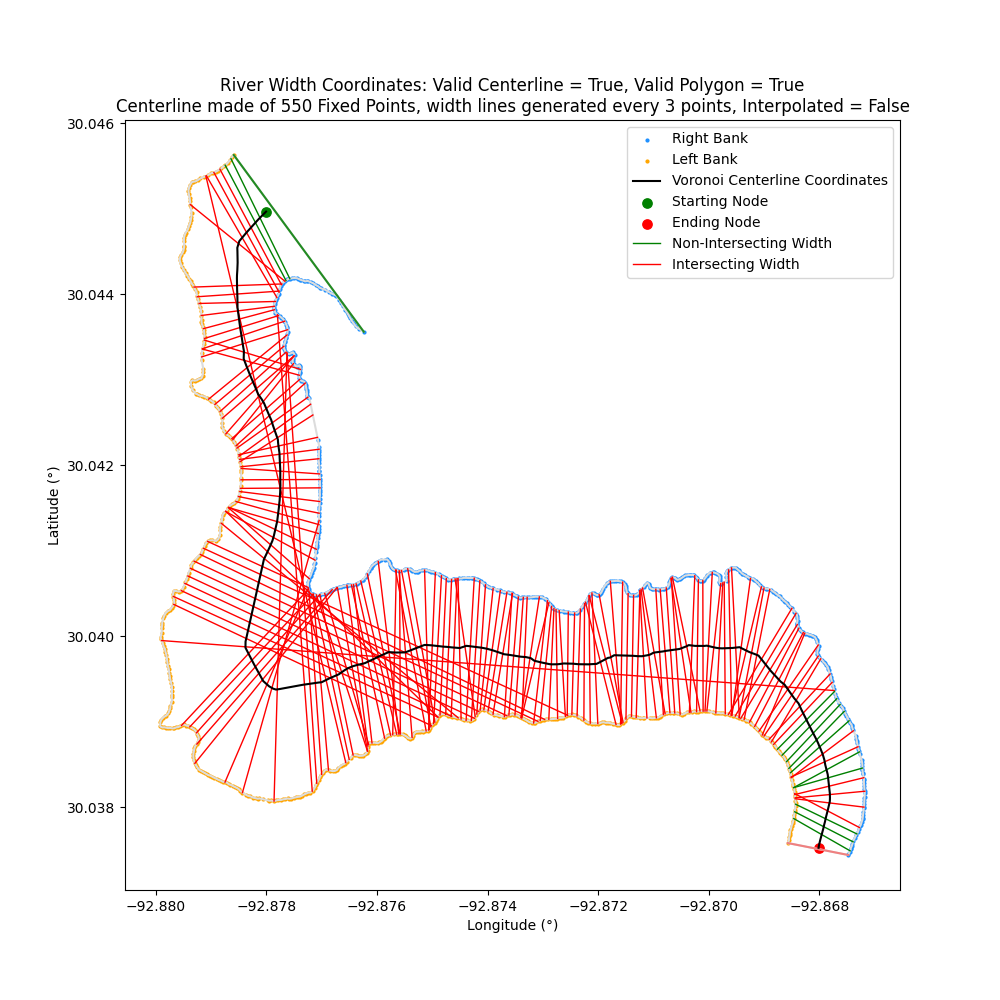
display_true_centerline
The width lines are generated from the evenly spaced coordinate (by default) or with the smoothed coordinates (when apply_smoothing=True), but display_true_centerline will overlay the Voronoi centerline on top of the plot
| display_true_centerline=True | display_true_centerline=False |
|---|---|
 |
 |
apply_smoothing
apply_smoothing applies a spline to smooth the centerline points created by the Voronoi vertices. This reduces the noise of the slopes and can create width lines that are less susceptible to small changes in the bank
| apply_smoothing=False | apply_smoothing=True |
|---|---|
 |
 |
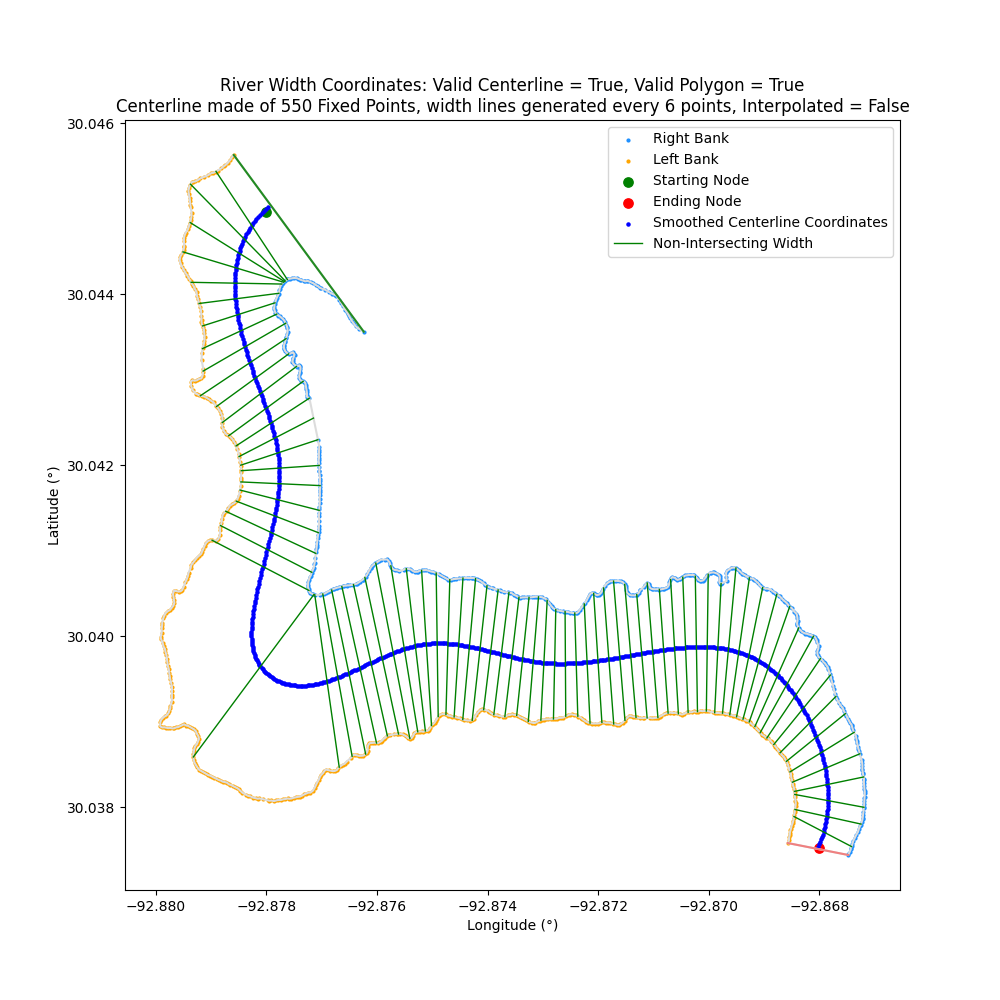
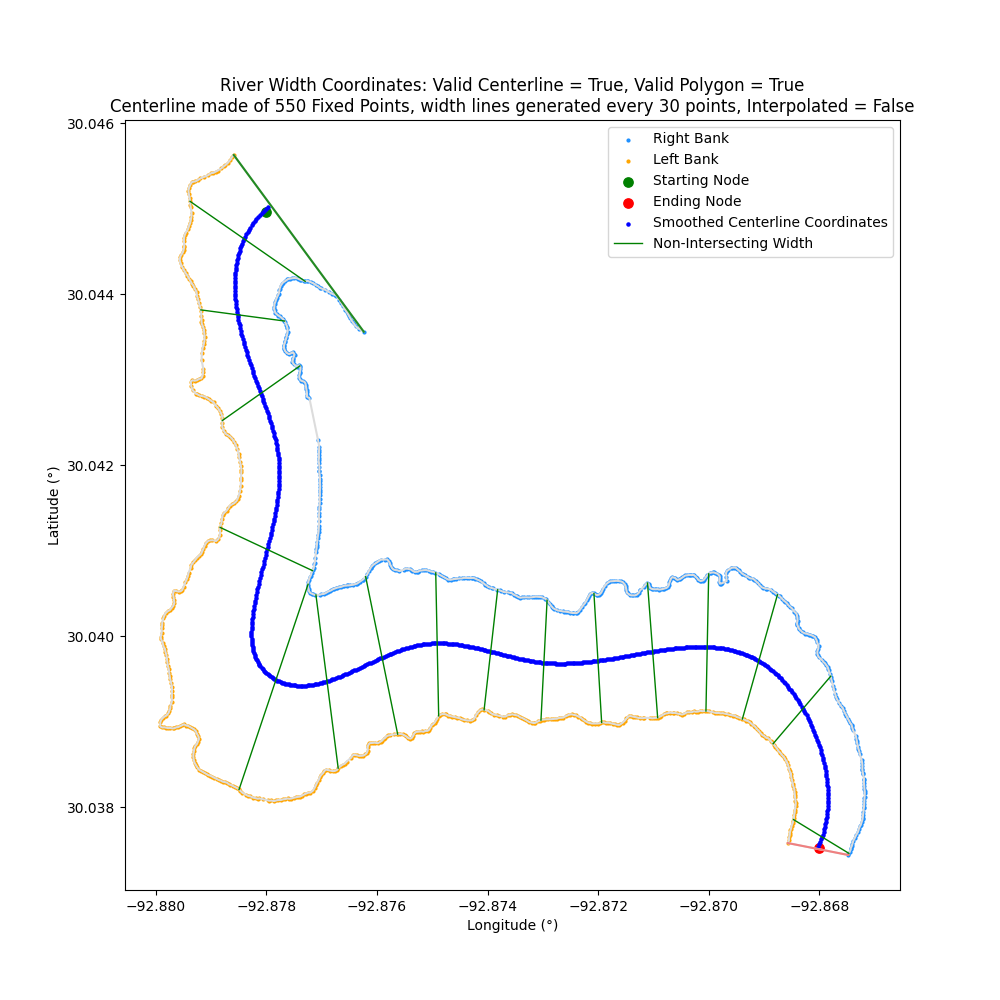
transect_span_distance
Transect span describes the number of points that are averaged to generate the slope of the width line (example: transect_span_distance=3, average of three slopes). The slope of the width line is orthogonal to the average slopes measured along the transect span
If the span is odd then the width line will be generated at the position of the middle of the span on n/2. If the span is even, then the width line will be generated at 1 + n/2, for example, [A, B, C, D] will generated a width line at point C
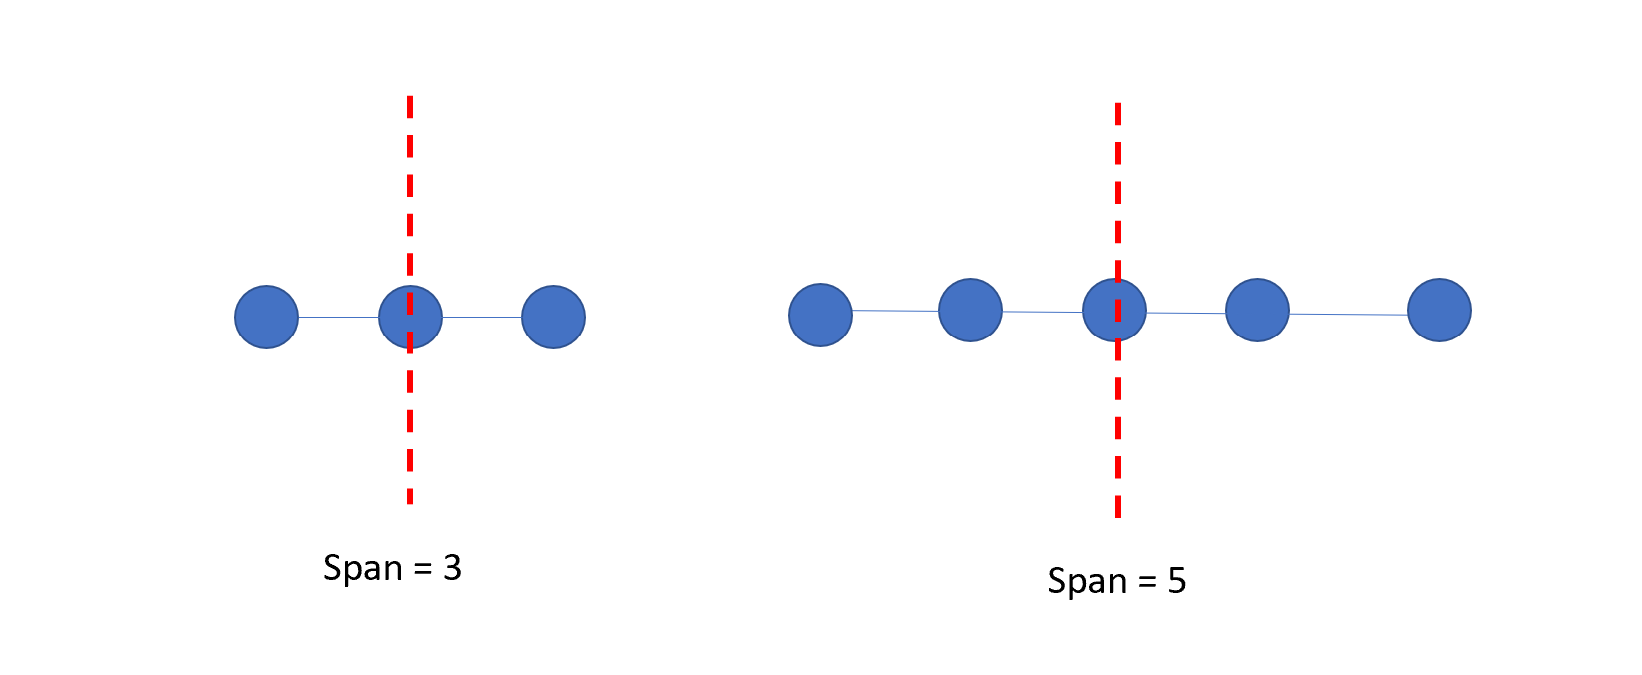
| transect_span_distance=6 | transect_span_distance=30 |
|---|---|
 |
 |
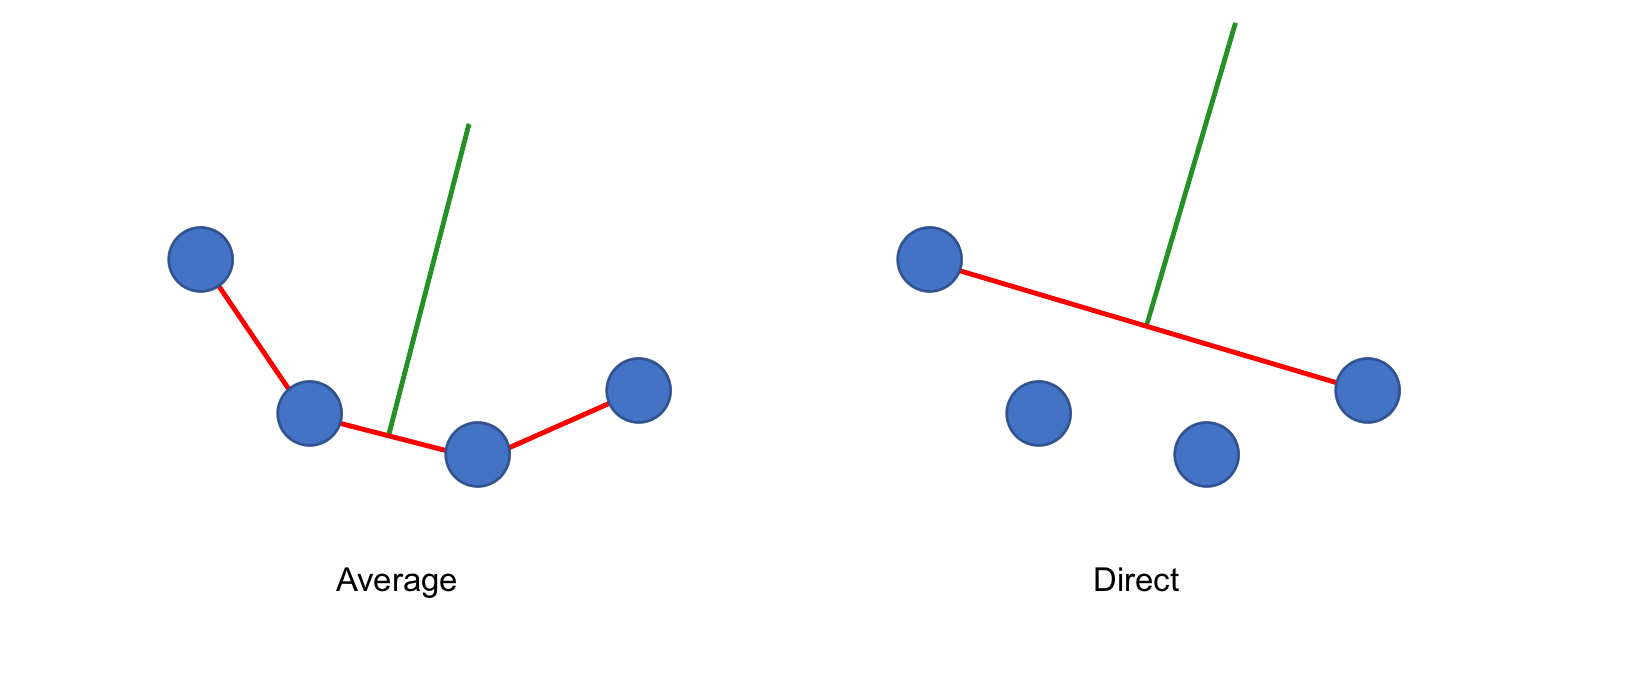
transect_slope
The width lines are generated as perpendicular to the slopes of the points across transect_span_distance
By default, transect_slope="Average" where the width lines are perpendicular to the average slopes of the across span distance. For example: [A, B, C, D] = avg( slope([A, B]) + slope([B, C]) + slope([C+D]) )
Optionally, if transect_slope="Direct" then the width lines will be perpendicular to slope of the first and last point. For example: [A, B, C, D] = slope([A, D]) to avoid being susceptible to rapid small changes along the centerline
| transect_slope="Average" | transect_slope="Direct" |
|---|---|
 |
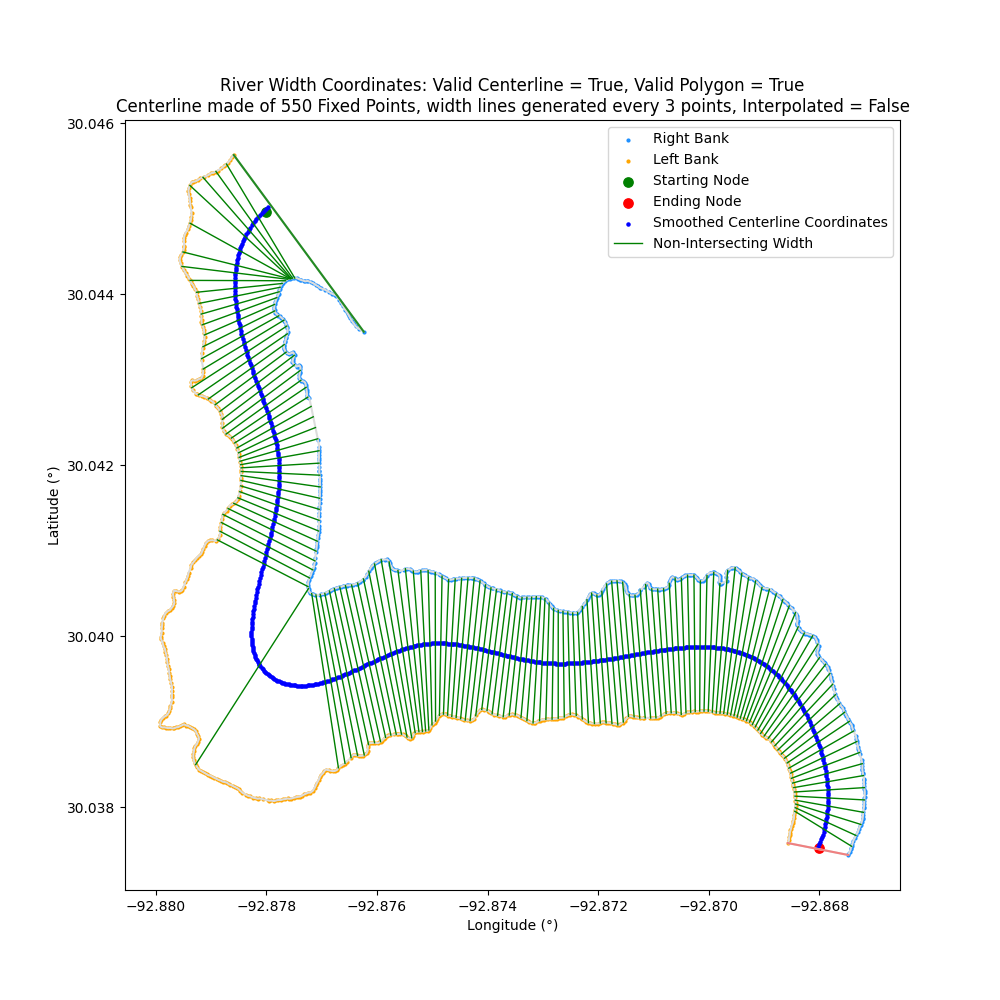 |
remove_intersections
remove_intersections will remove the width lines that intersect other lines (that could be creating unrepresentative long width lines). Intersections are removed first in order from most to least number of intersections and then based on the longer of two intersecting lines. This ensures that the most width lines as possible are kept
Intersecting lines are flagged in red by default (flag_intersections=True)
| remove_intersections=False | remove_intersections=True |
|---|---|
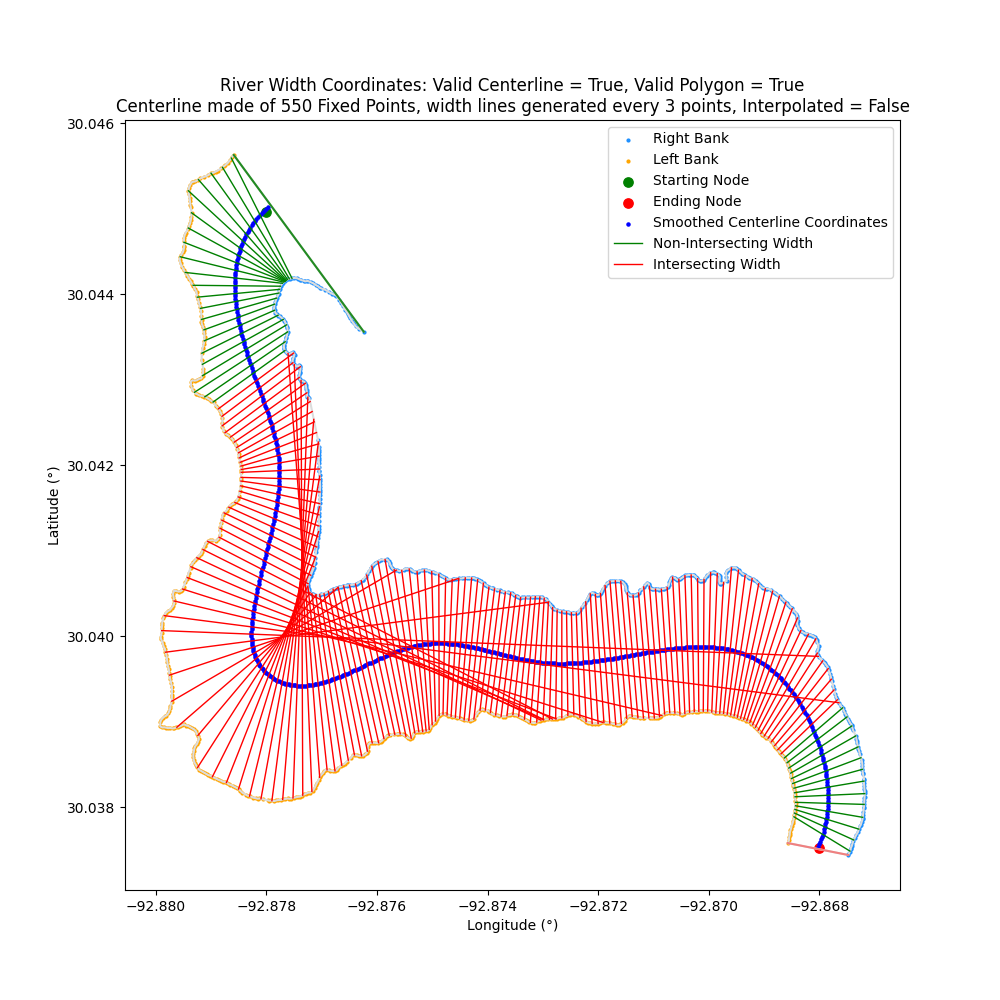 |
 |
dark_mode
dark_mode will change the default Matplotlib background black and swap centerline_color from default black to white
| dark_mode=False | dark_mode=True |
|---|---|
 |
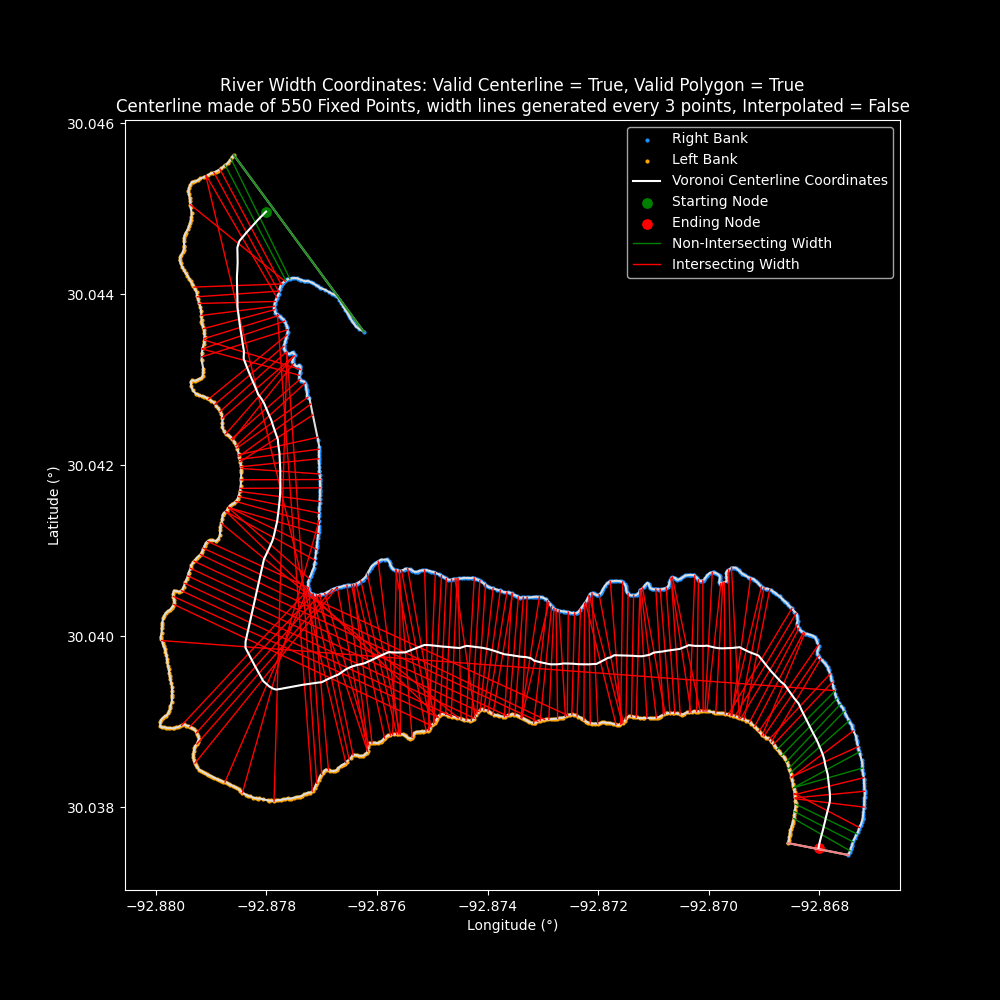 |
equal_axis
equal_axis will set the x and y axis of the plot to be equal. Useful to show the perpendicular width lines as perpendicular since it can appear distorted by default in Matplotlib
| equal_axis=False | equal_axis=True |
|---|---|
 |
 |
coordinate_unit
Two options for measuring and displaying coordinates. The two options are "Decimal Degrees" and "Relative Distance". "Decimal Degrees" is the default option that uses the original data coordinate system with latitude/longitude. "Relative Distance" changes the coordinates of each point to be the distance (in meters) from the first point on the left bank
| coordinate_unit="Decimal Degrees" | coordinate_unit="Relative Distance" |
|---|---|
 |
 |
Return the width of the river at each (evenly spaced or smoothed) with coordinates where width line intersects either the centerline, (Centerline Longitude, Centerline Latitude) : width, or riverbanks, ((Right Bank Longitude, Right Bank Latitude), (Left Bank Longitude, Left Bank Latitude)) : width in kilometers
riverWidthFromCenterline(transect_span_distance=3,
			transect_slope="Average",
			apply_smoothing=True,
			remove_intersections=False,
			coordinate_unit="Decimal Degrees",
			coordinate_reference="Centerline",
			save_to_csv=None)
- [OPTIONAL] transect_span_distance (int): Number n points around a center point to determine the slope (increase to decrease the impact of sudden changes), defaults to 3, must be greater than 1 (since the slope is found from the difference in position between two points)
- [OPTIONAL] transect_slope (str): Determine how the width lines are generated, either by averaging all slopes "Average" or directly from the first to last point in the span distance as "Direct", defaults to "Average"
- [OPTIONAL] apply_smoothing (boolean): Apply a B-spline smoothing to centerline
- [OPTIONAL] remove_intersections (boolean): Iterative remove intersecting lines, to maintain the most width lines, but return only non-intersecting width lines, defaults to True
- [OPTIONAL] coordinate_unit (string): Coordinates of the river are return as "Decimal Degrees" (latitude/longtidue) or converted to a distance from the first point on the left bank as "Relative Distance", defaults to "Decimal Degrees"
- [OPTIONAL] coordinate_reference (string): Reference where the width line intersects the river, either along the centerline ("Centerline") as
(Centerline Longitude, Centerline Latitude) : width, or riverbanks ("Banks") as((Right Bank Longitude, Right Bank Latitude), (Left Bank Longitude, Left Bank Latitude)) : width - [OPTIONAL] save_to_csv (string): CSV filename to output width dictionary, defaults to None (no file is saved), requires a .csv extension (Column Headers automatically generated based on
coordinate_unitandcoordinate_reference)
Important note, when using apply_smoothing=True, the centerline generated is the result of evenly spaced coordinates generated from the original Voronoi coordinates, so the smoothed coordinates may not match exactly to the original centerline coordinates. When apply_smoothing=False, width lines are generated from the evenly spaced centerline coordinates
import centerline_width
river_object = centerline_width.riverCenterline(csv_data="data/river_coords.csv")
river_width_dict = river_object.riverWidthFromCenterline(transect_span_distance=3,
							apply_smoothing=True,
							coordinate_reference="Centerline",
							remove_intersections=True)
Width dictionary = {(-92.86792084788995, 30.037769672351182): 0.10969163557087018, (-92.86795038641004, 30.03769867854198): 0.10794219579997719}
Note: it is best practice to plot the centerline and width with same arguments in plotCenterlineWidth() to ensure that the results when save_to_csv=True are as expected
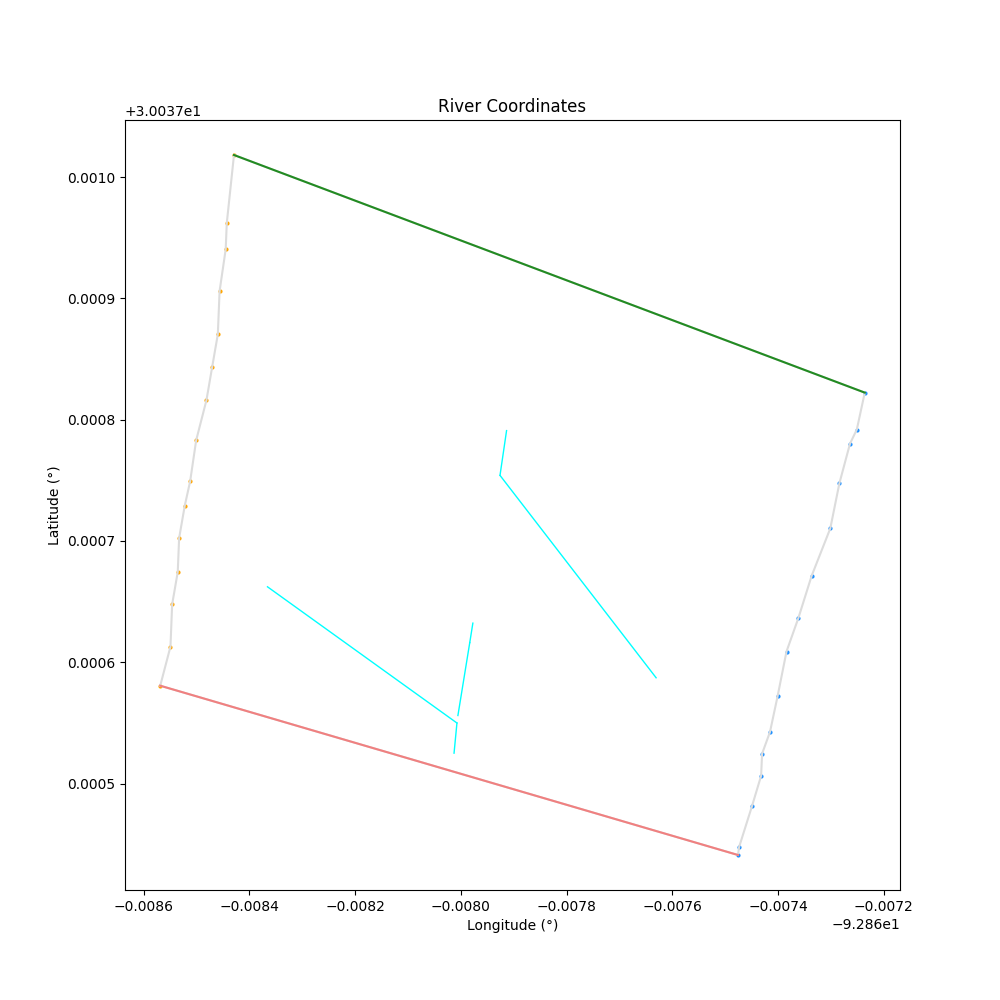
The centerline is defined by the greatest distance from the right and left bank, created from a Voronoi Diagram. The remaining paths within the river are filtered through Dijkstra's algorithm to find the shortest path that is the centerline
Generate a polygon to encapsulate the river between the right and left banks to define in and outside of river
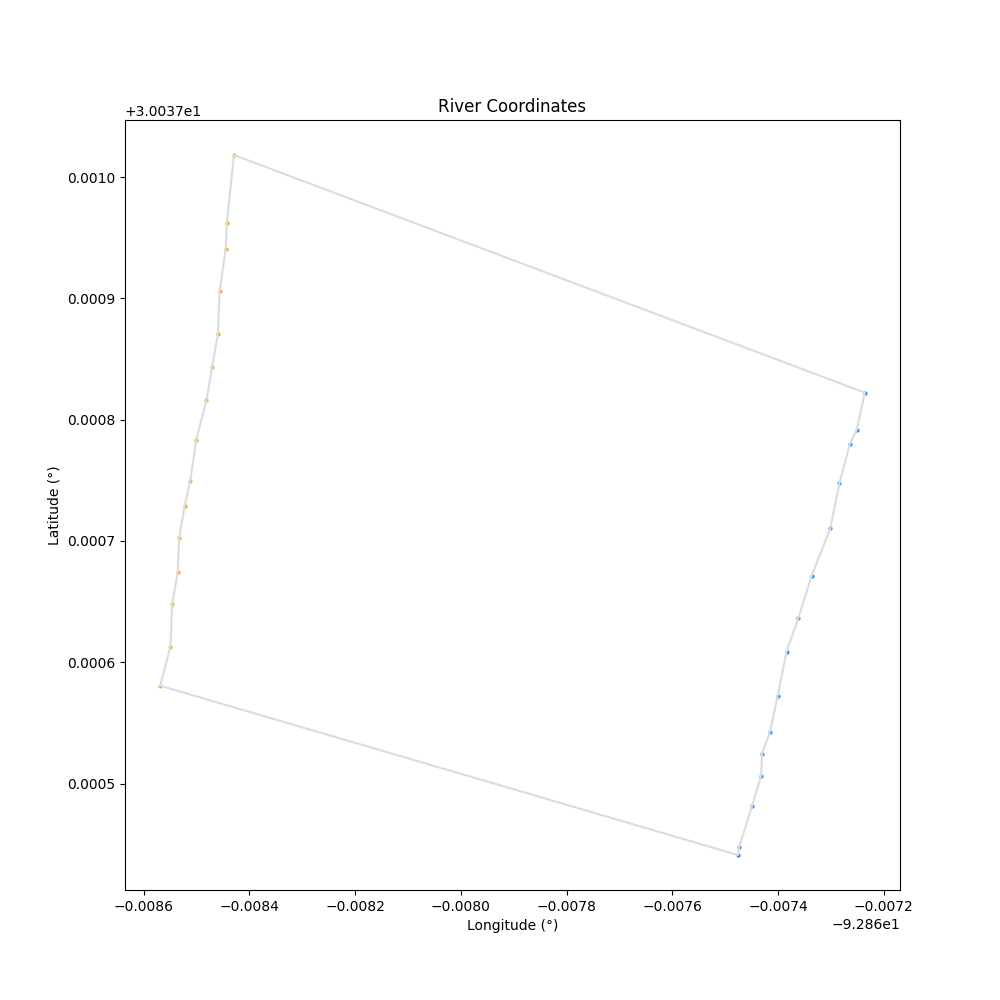
Filter out any point pairs that only have one connection to filter out the short dead end paths
With the vertices removed, it is possible to form multiple unconnected graphs within the polygon. The largest subgraph is assumed to contain the centerline and the other subgraphs are filtered out
The top of the river is defined as the last plotted points in the data, while the bottom of the river is the first plotted points
The starting/ending node is defined by the vertex closest to the top/bottom of the polygon along the longest path
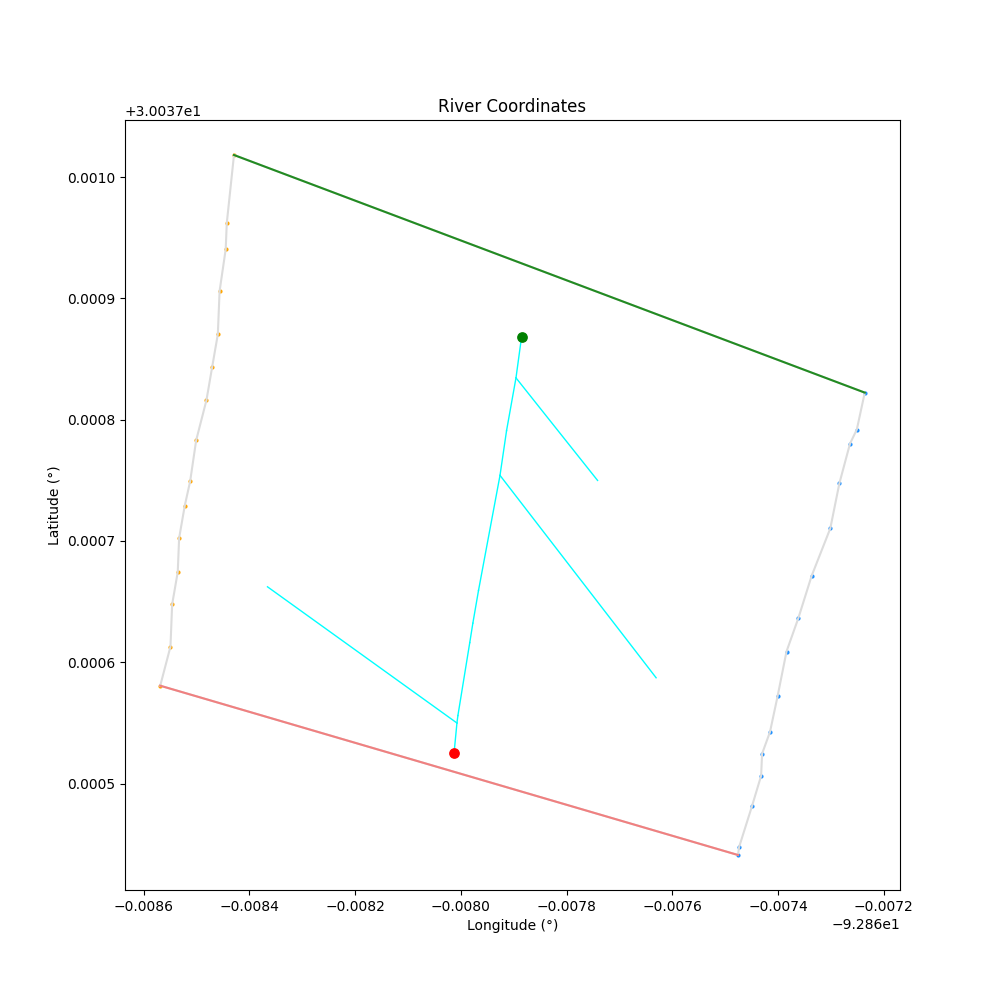
Find the shortest path from the starting node to the ending node (Dijkstra's Algorithm)
| Points on Riverbank | NetworkX Graph of Points on Riverbank |
|---|---|
 |
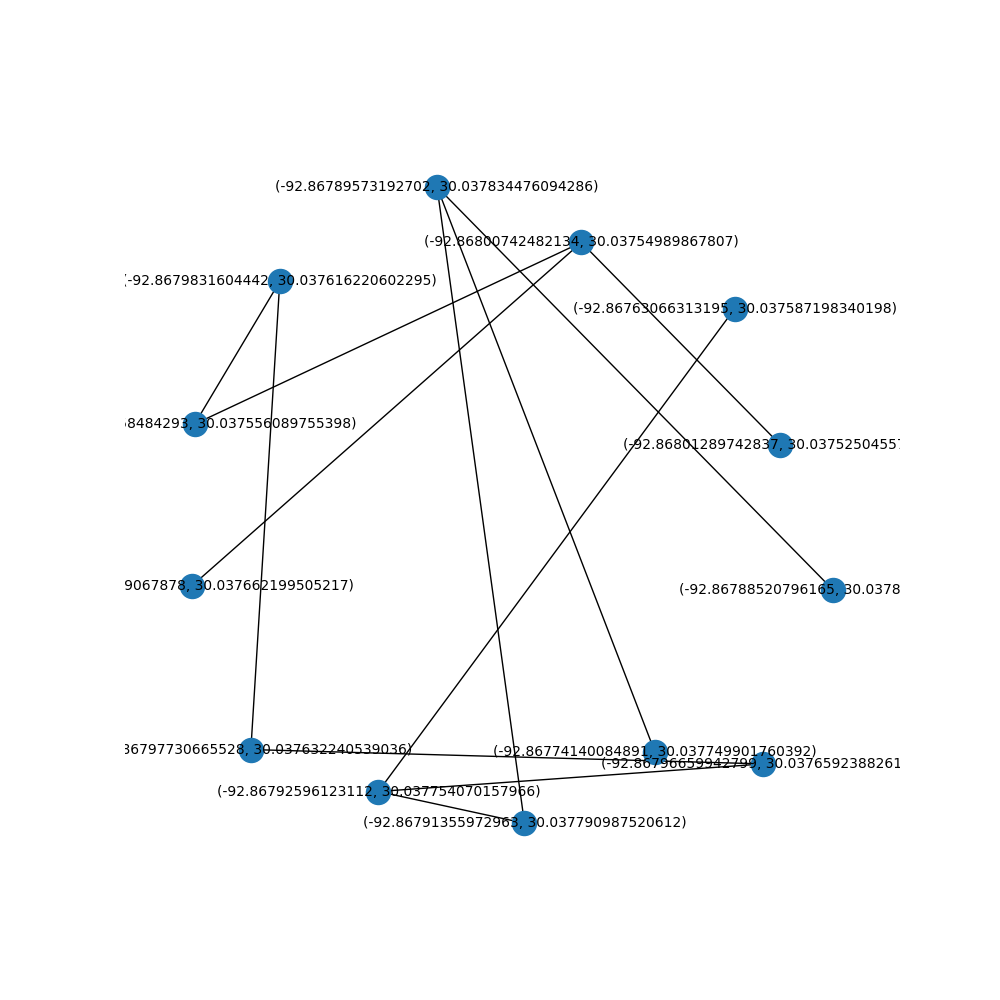 |
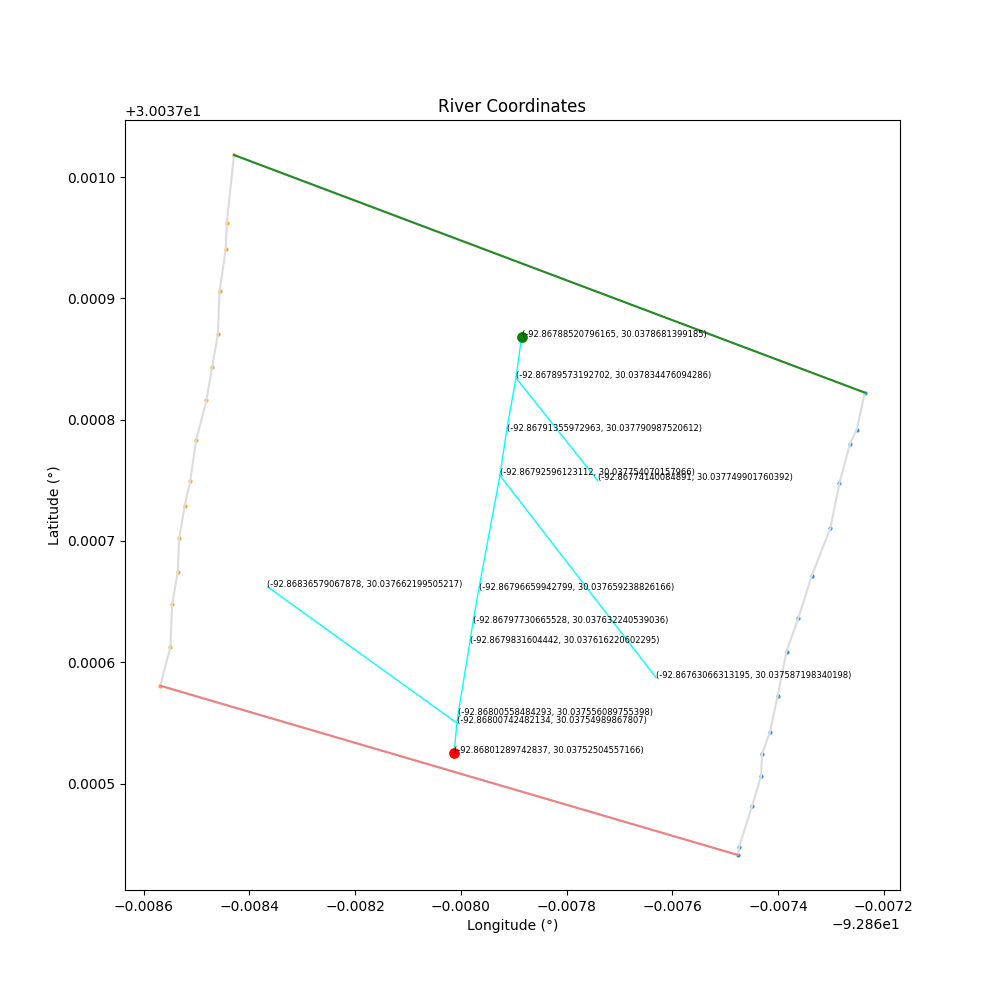
This is an attempt at a more robust algorithm working from raw data to ensure that all dead ends are removed, and no gaps exist in the centerline
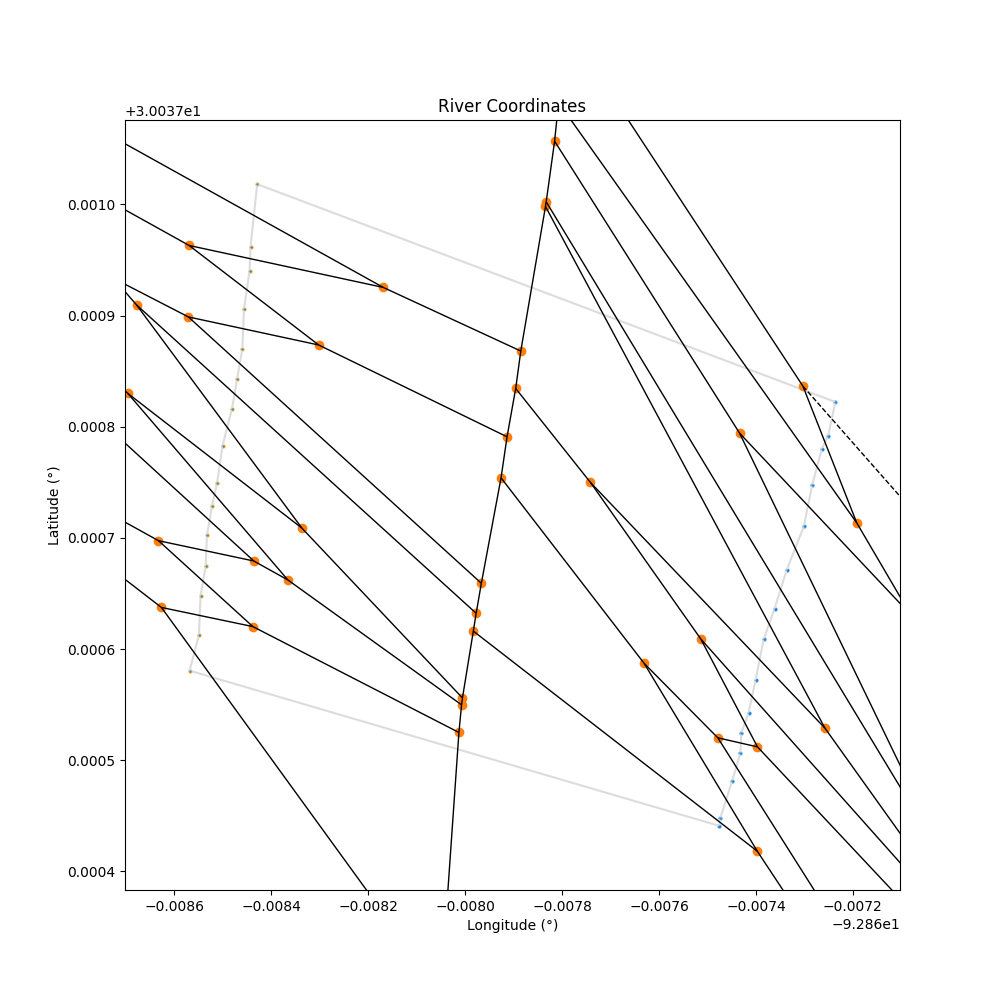
Points that only have one connection are removed, but limiting the number of connections for a point to just two will create gaps. The Voronoi vertices connect to other vertex values, but some connect to more and some only connect to one other point. Removing additional values will create gaps, so this is avoided in this code by not applying additional filters.
All vertices:
Vertices that have at least two connections (that would create gaps):
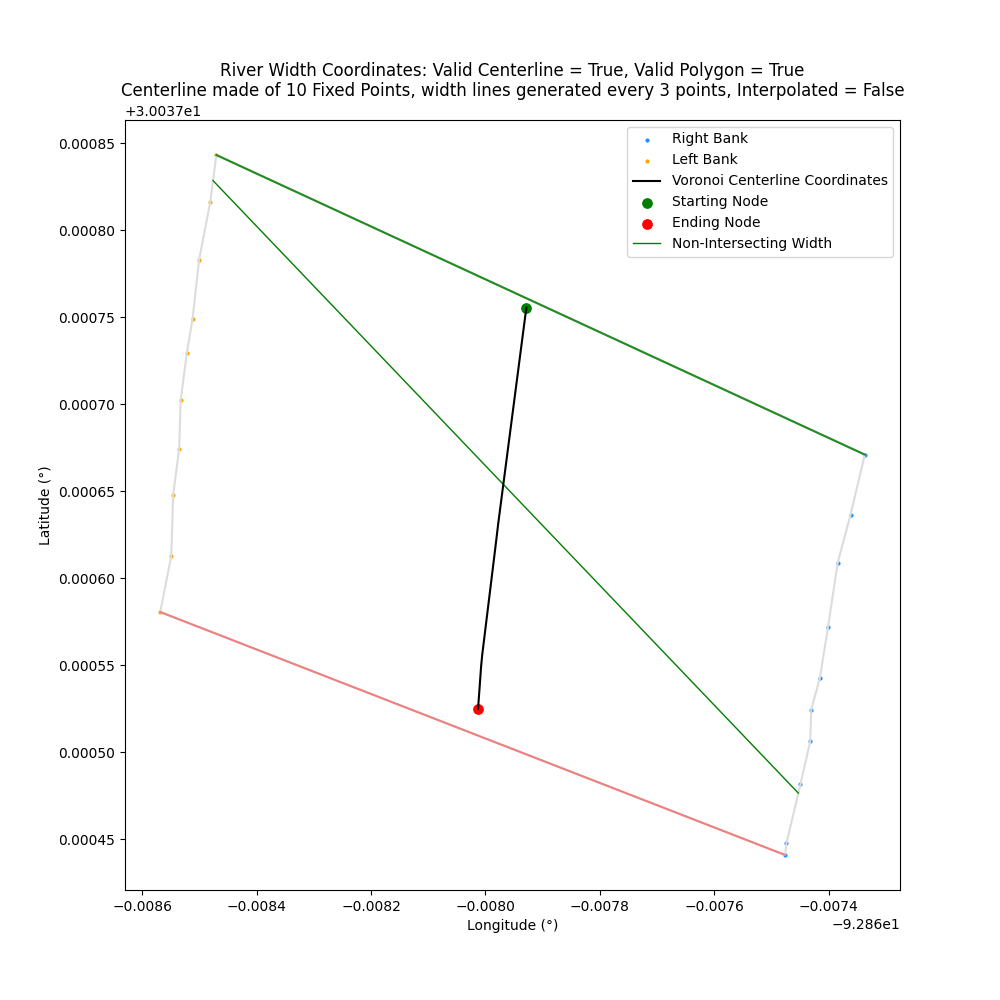
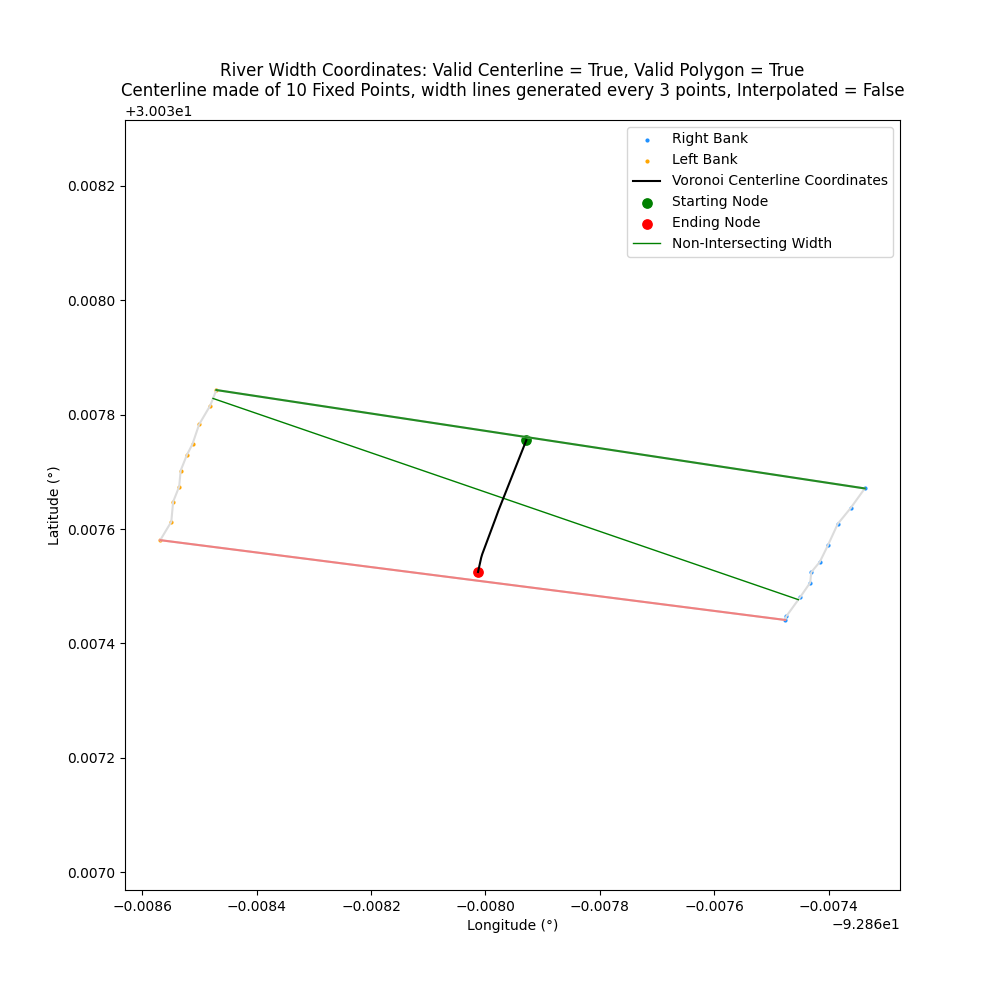
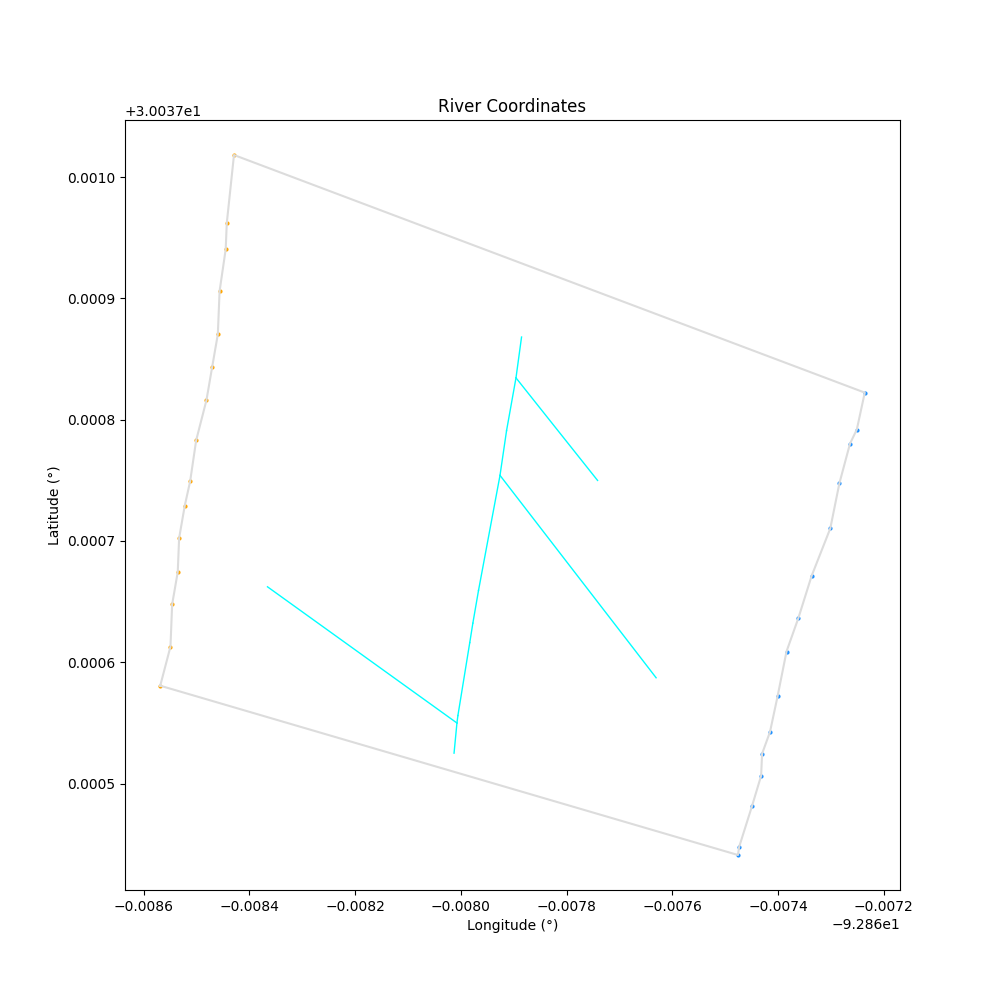
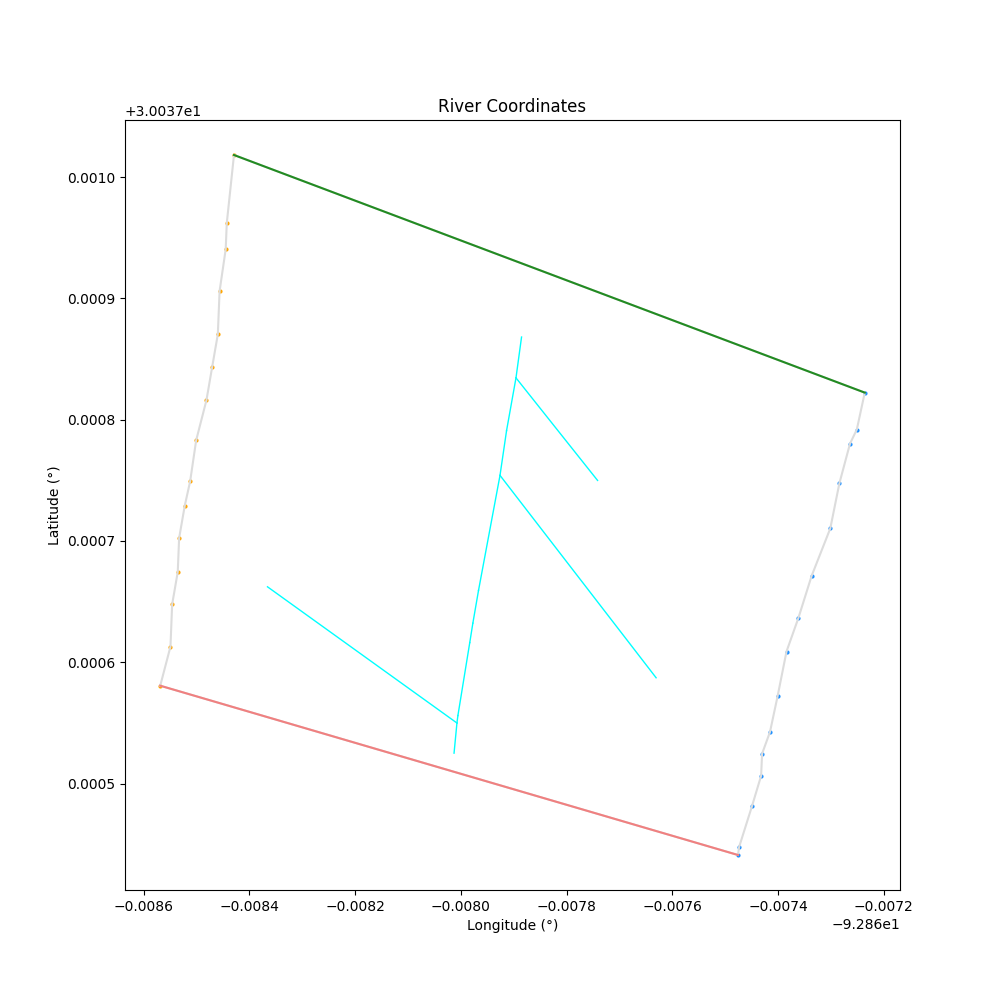
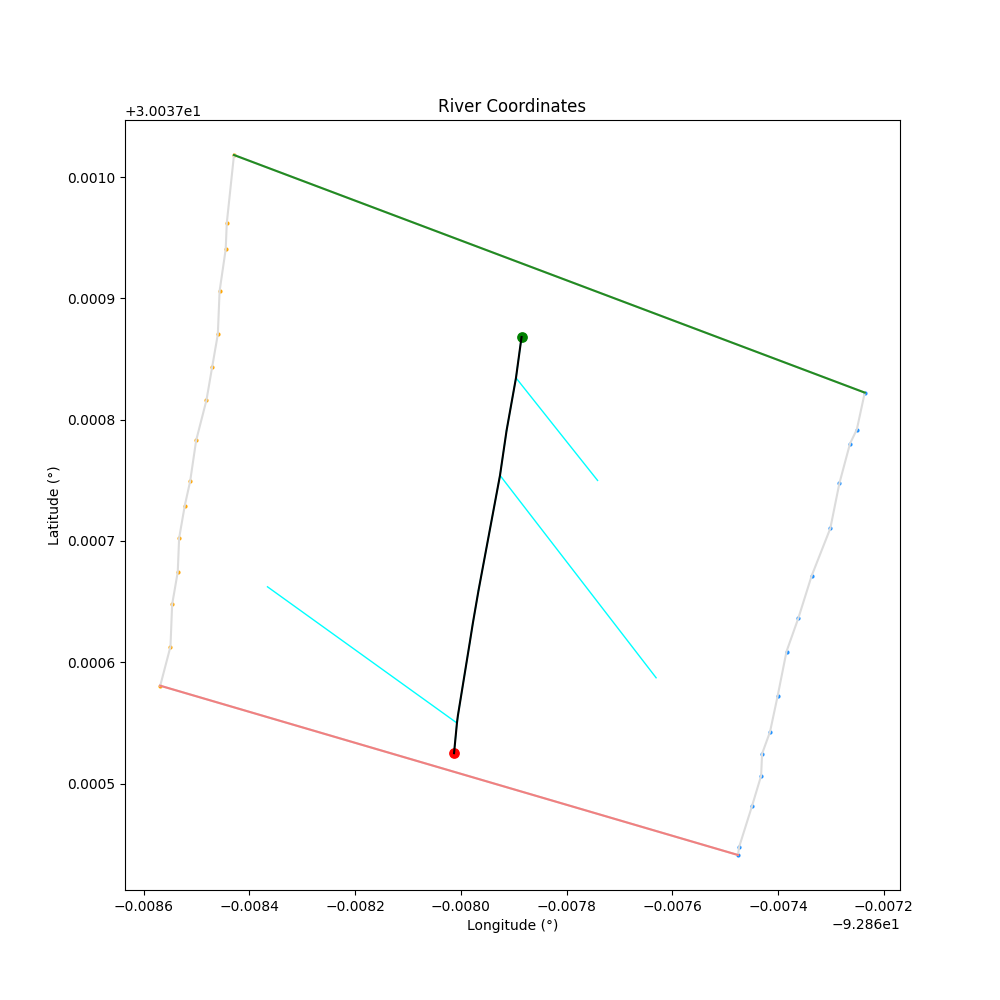
If the data starts or ends with a large width, it is possible for the starting/ending nodes to end up in the wrong position
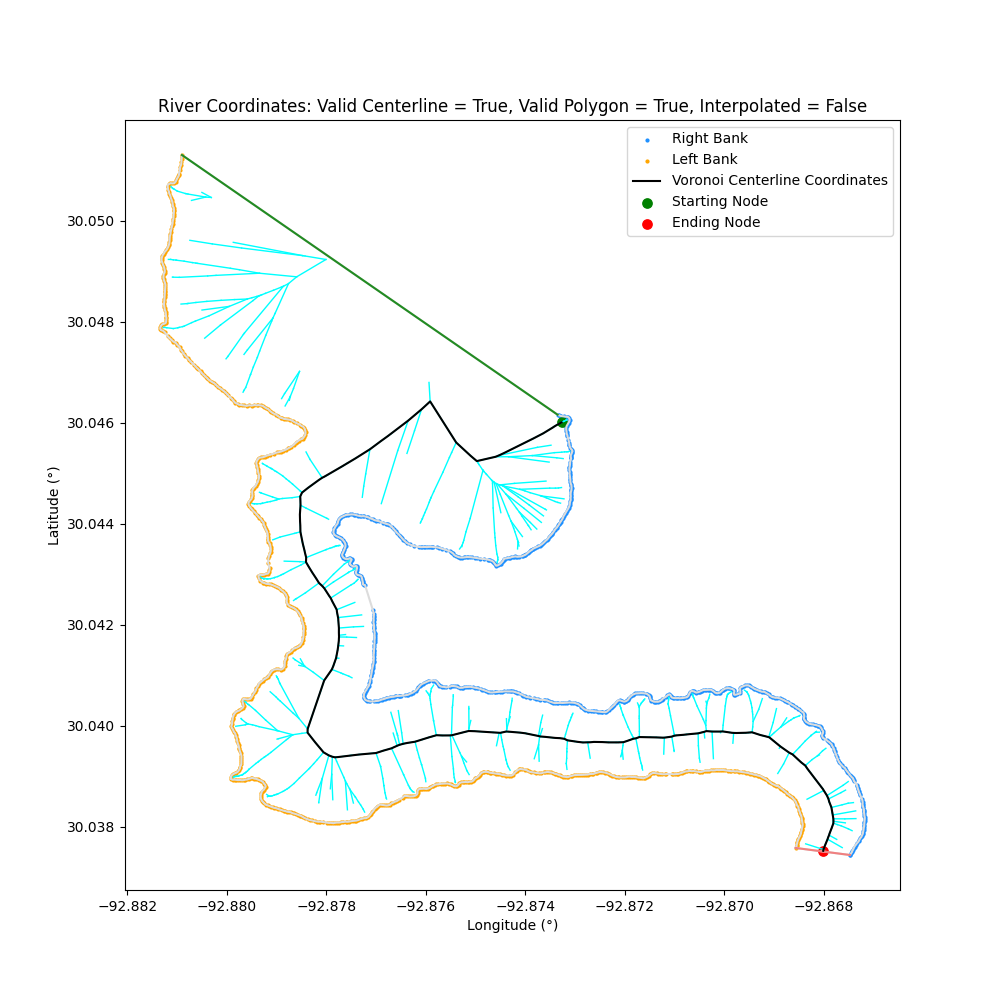 Currently, the starting node is determined by the closest node on the path to the top of the bank (in green) and the ending node is determined by the closest node on the path to the bottom of the bank (in red) that sits along the longest path
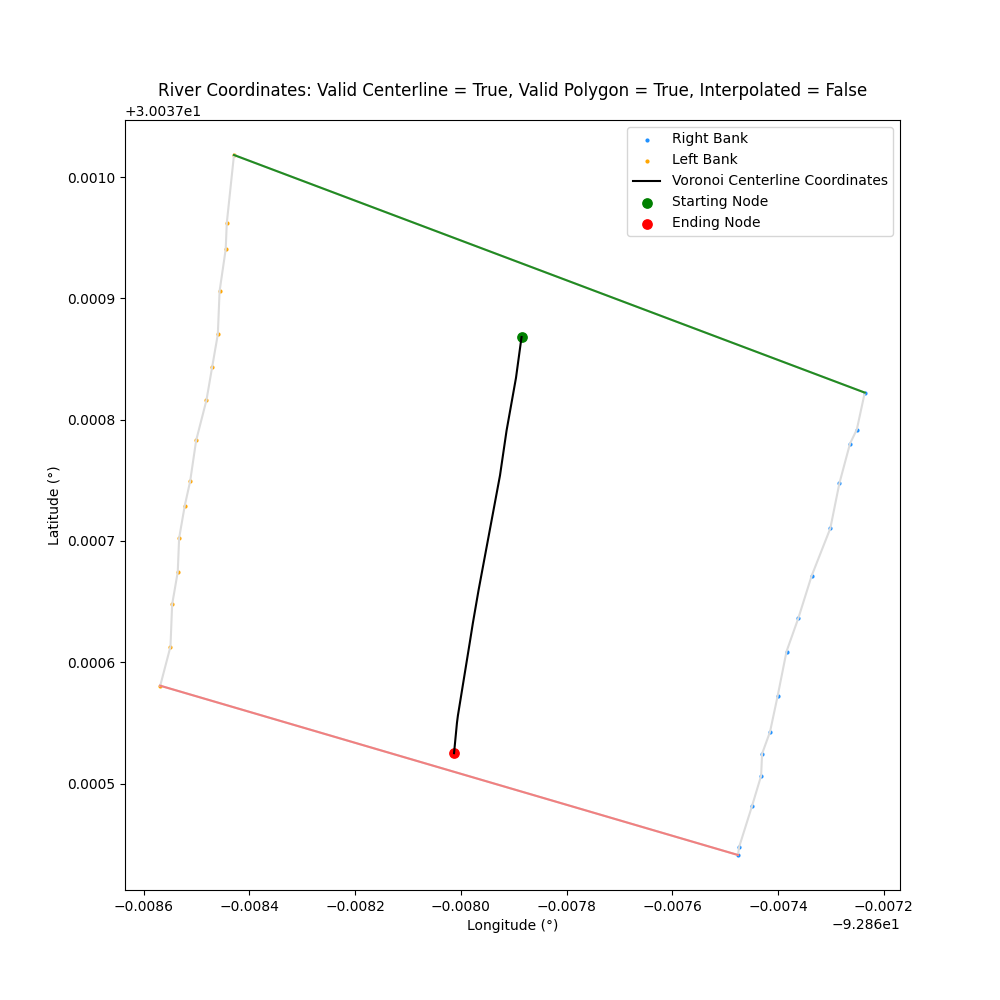
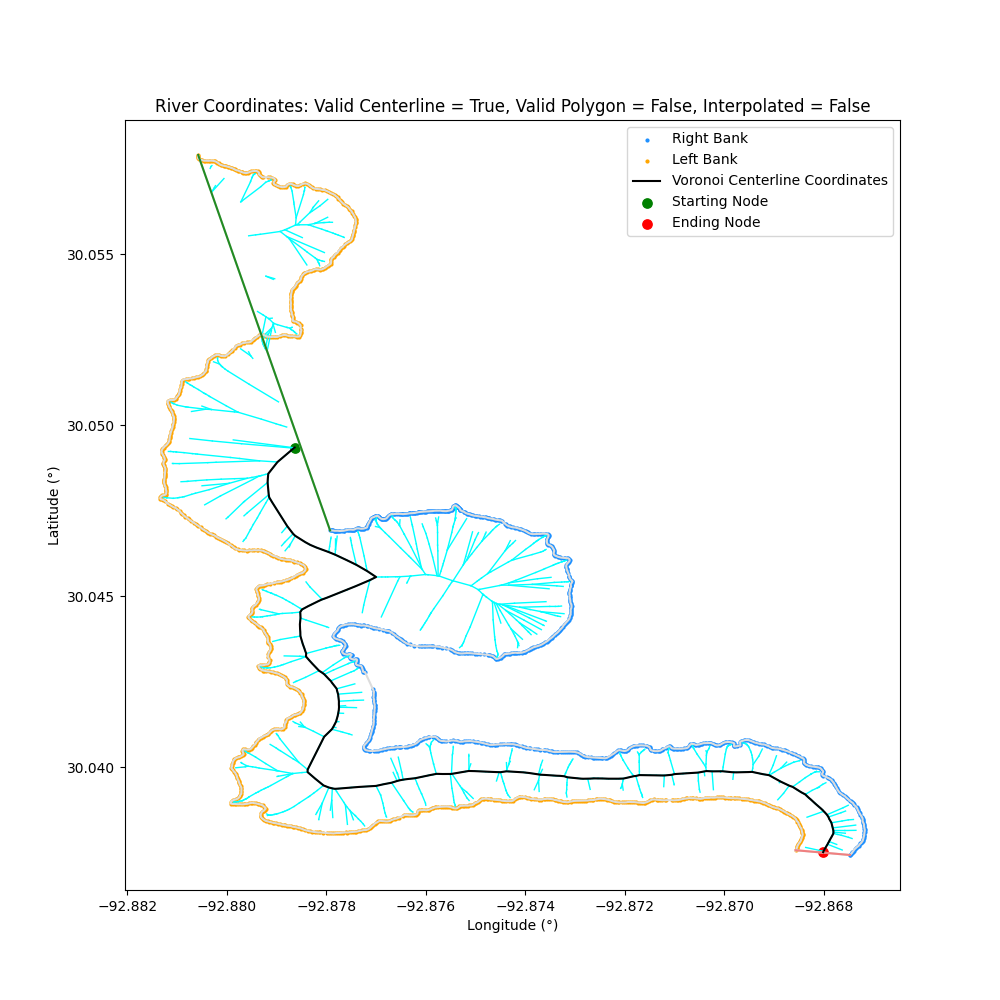
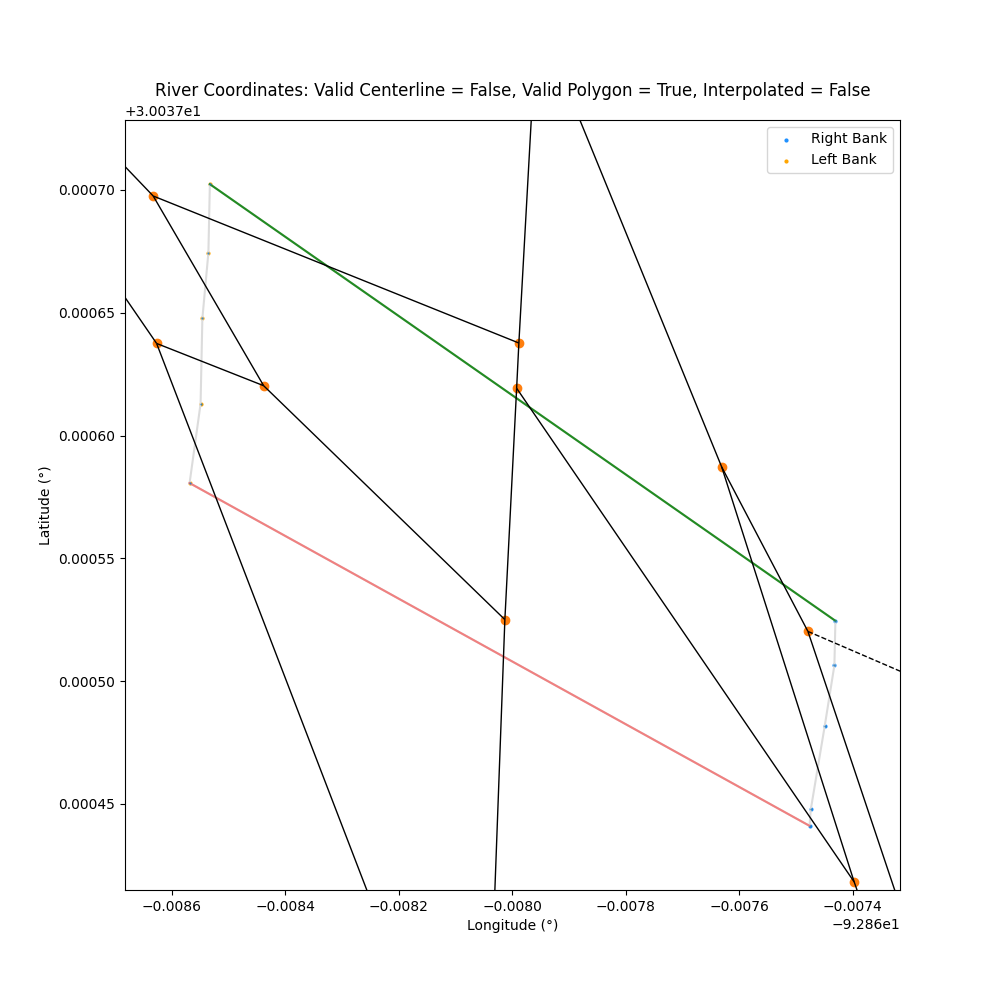
A polygon is formed to encapsulate the river with the given data (to determine the inside and outside of the river). The top and bottom are connected by a straight line from the start/end of the available data. As a result, it is possible for this straight line to overlap and create an invalid polygon.
A polygon is invalid if it overlaps within itself:
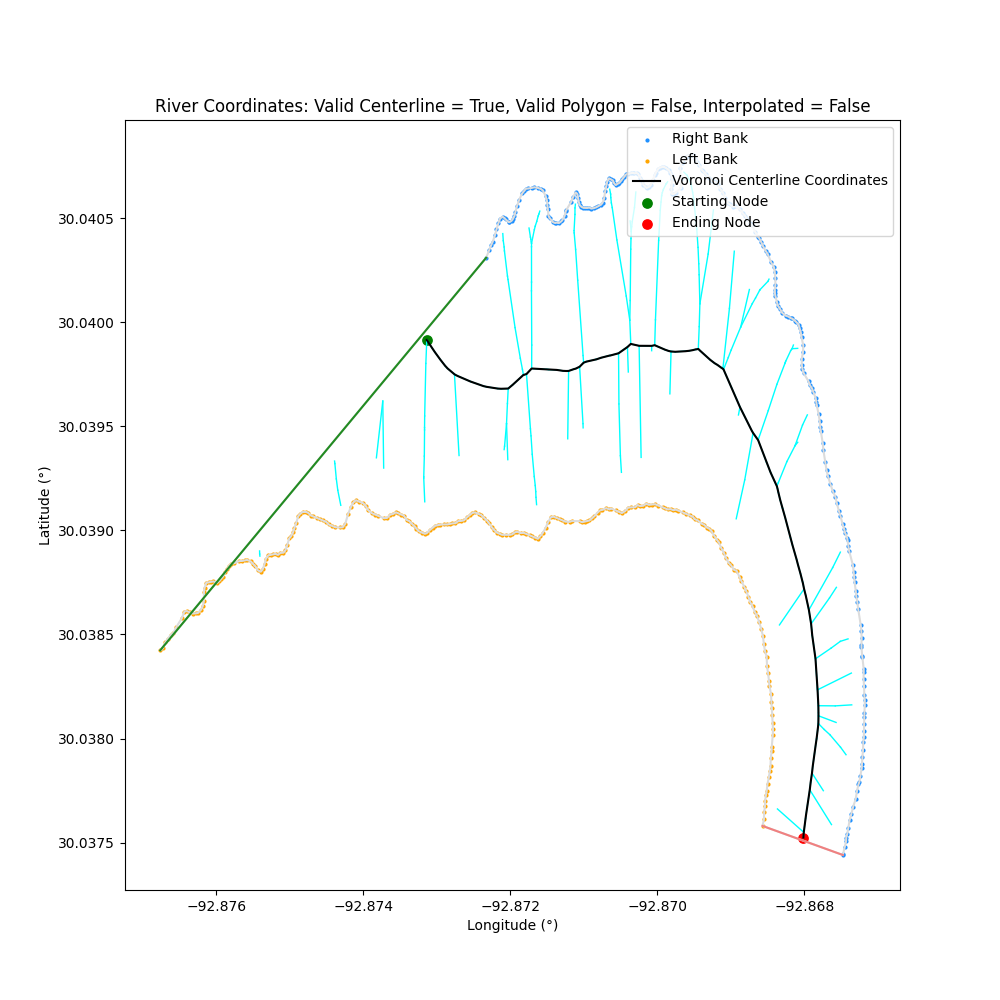 In this example, the polygon is invalid, but with such a small overlap it is still able to find a valid path
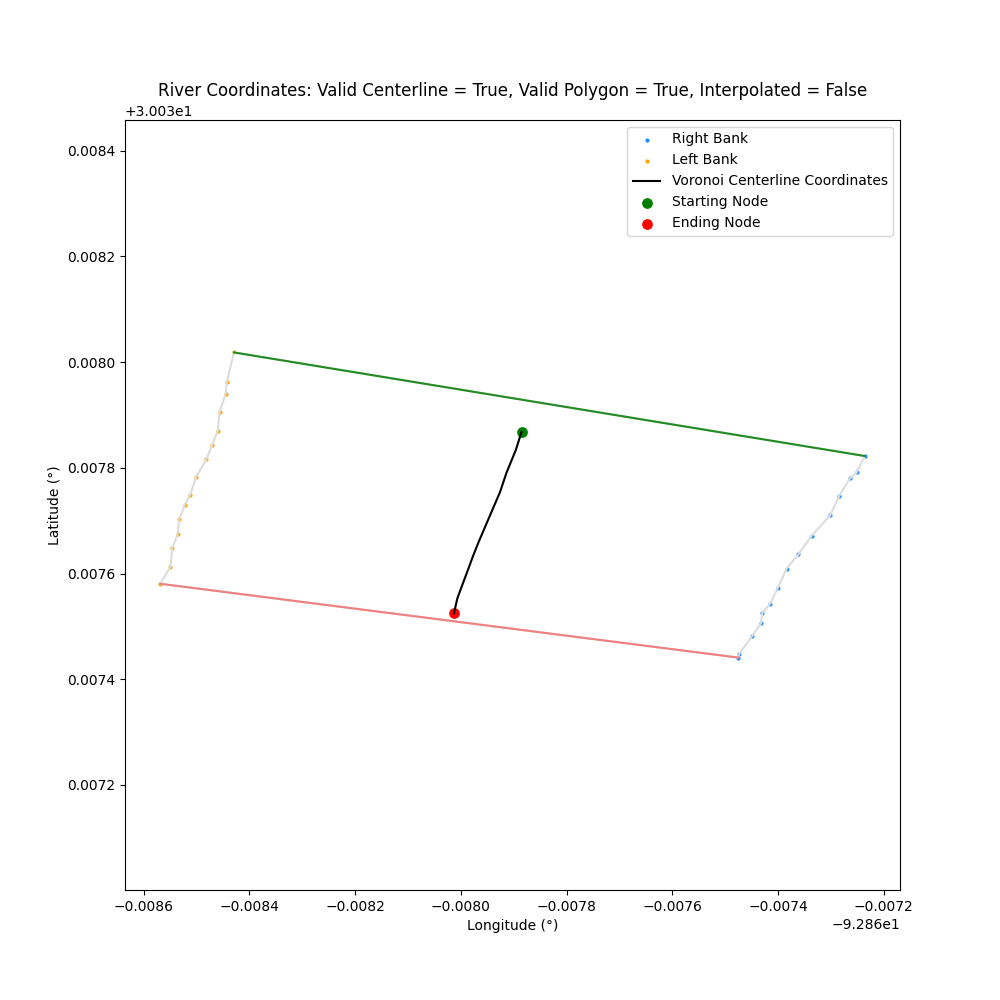
With limited data, the polygon will overlap more dramatically and will struggle to find a valid centerline:
If the data is too small, a centerline and its coordinates cannot be found (since only a single Voronoi vertex exists within the polygon and after dead ends are filtered)
CRITICAL ERROR, Polygon too short for the Voronoi diagram generated (no starting node found), unable to plot centerline. Set display_voronoi=True to view vertices. Can typically be fixed by adding more data to expand range
 Can be fixed by expanding the data until the polygon is large enough to contain at least two different vertex points
Error: WARNING: Invalid Polygon Due to Flipped Banks, fix recommendation: rerun convertColumnsToCSV() and set flip_direction=True (or reset to default 'False' if currently set to flip_direction=True)
If the data for the left and right riverbanks are generated in reverse order, they will be read in the incorrect order and the graph will find the invalid top and bottom of the bank
If the latitude/longitude of the banks are generated in reverse order, flip the final values so left/right bank are in order
This can be fixed by using the flip_direction optional argument centerline_width.convertColumnsToCSV(text_file="data_example.txt", flip_direction=True)
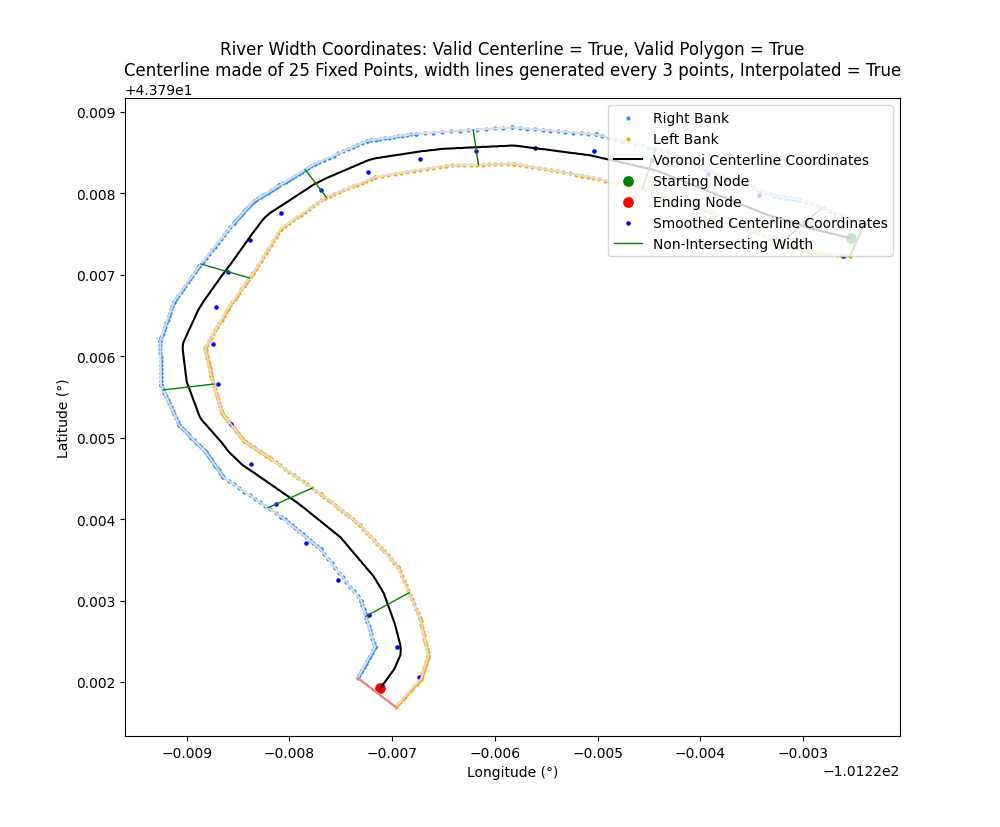
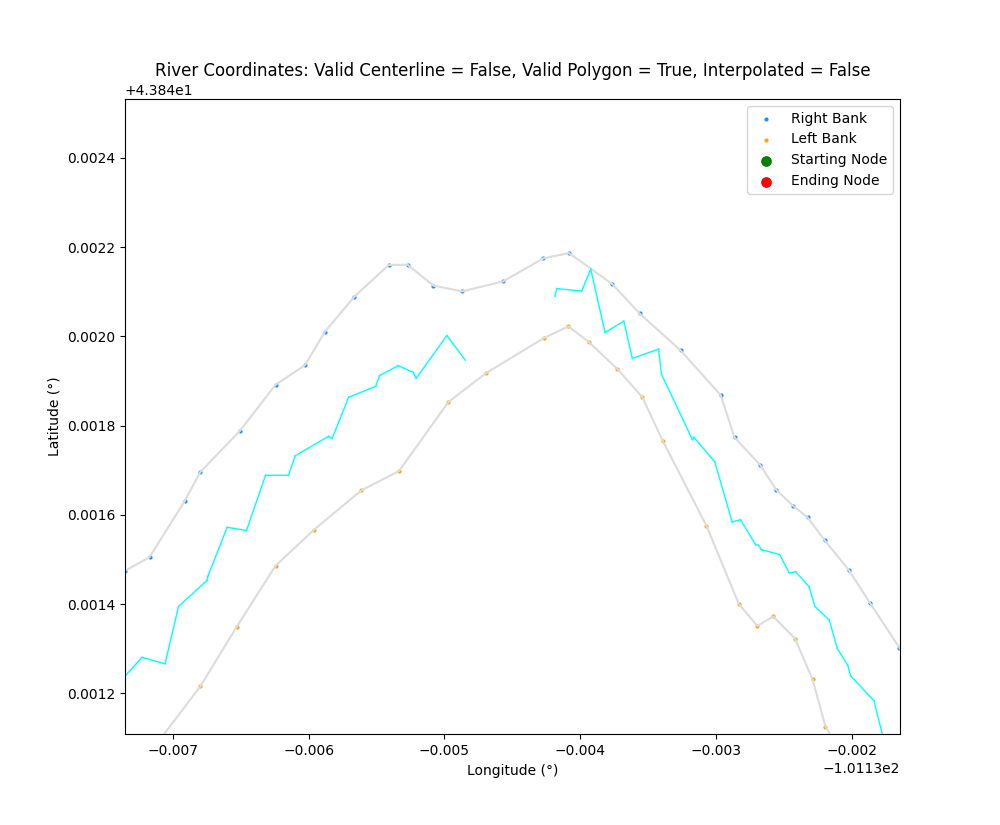
The smoothed centerline (river_object.centerlineSmoothed) can end up lying outside the river if the centerline data points are sparse in a narrow river. If more than two points in the smoothed centerline lie outside the river, a warning will be thrown
Example Error: WARNING: Partially invalid smoothed centerline due to sparse centerline data (6 points lie outside the polygon), fix recommendation: rerun riverCenterline to create river object with interpolate_n_centerpoints set to 62+
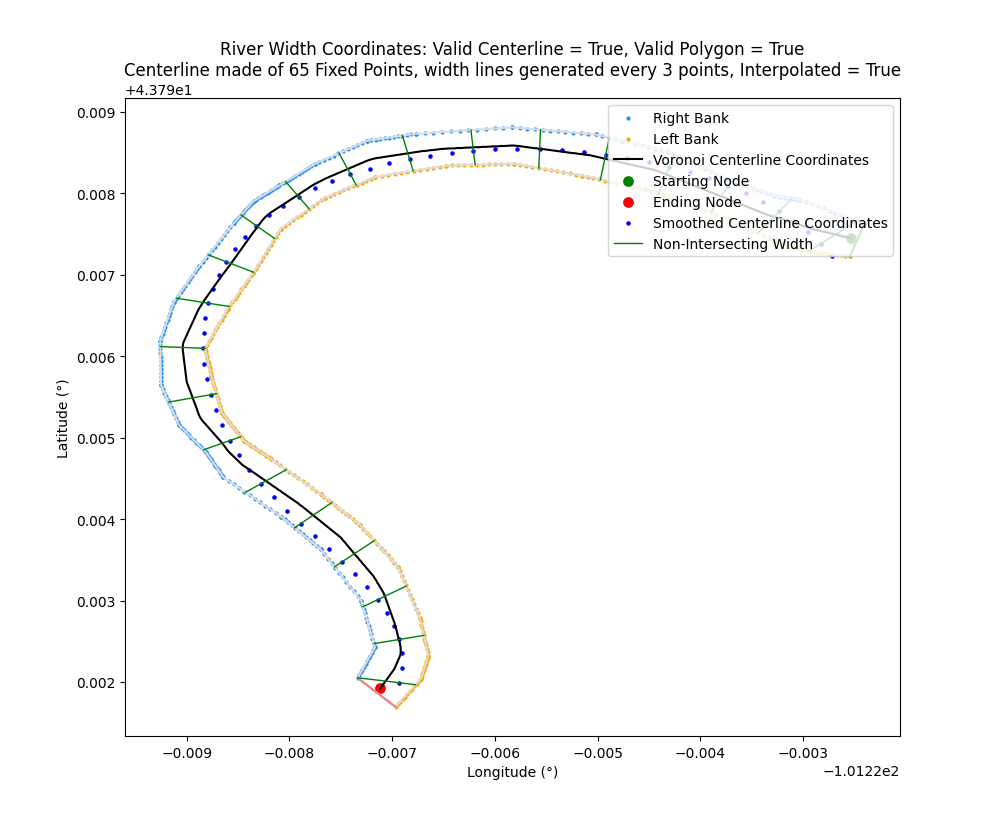
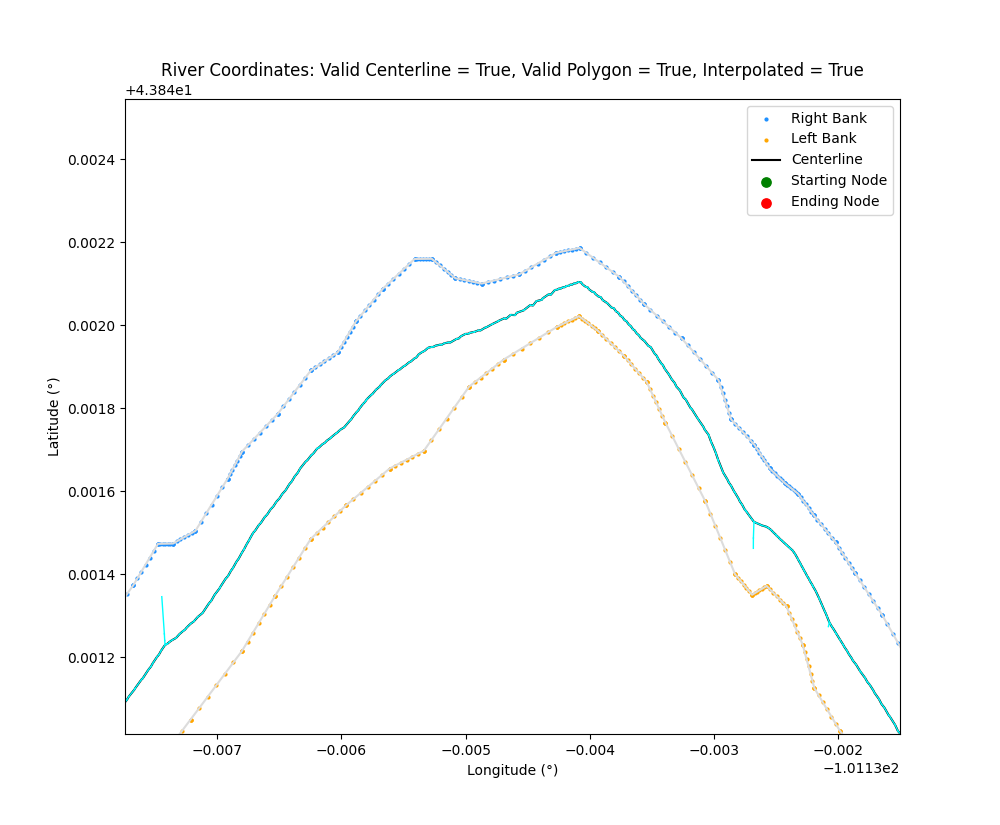
By default, interpolate_n_centerpoints is set to None and no additional points will be added between the existing points along the centerline. By adding additional points between the existing centerline, the smoothed centerline can be fixed to stay within the polygon. This fix is set by creating a river object, centerline_width.riverCenterline, with interpolate_n_centerpoints=65 (with the recommended 62+) to fix for centerline coordinates that lie outside the polygon
interpolate_n_centerpoints = None does not interpolate data points, so the size will be set to the number of fixed points when creating the evenly spaced coordinates (equal to the size of the data frame)
| interpolate_n_centerpoints = None | interpolate_n_centerpoints = 65 |
|---|---|
 |
 |
For very narrow rivers, this problem can become extreme and pronounced
By increasing the interpolation between the centerline points, the smoothed centerlines will be forced within the polygon and reduce the number of points outside of the polygon. By default, this warning will be thrown if more than 2 points are outside of polygon, so as long as more than 2 points lie outside the polygon, the warning will recommend doubling the amount of centerline points
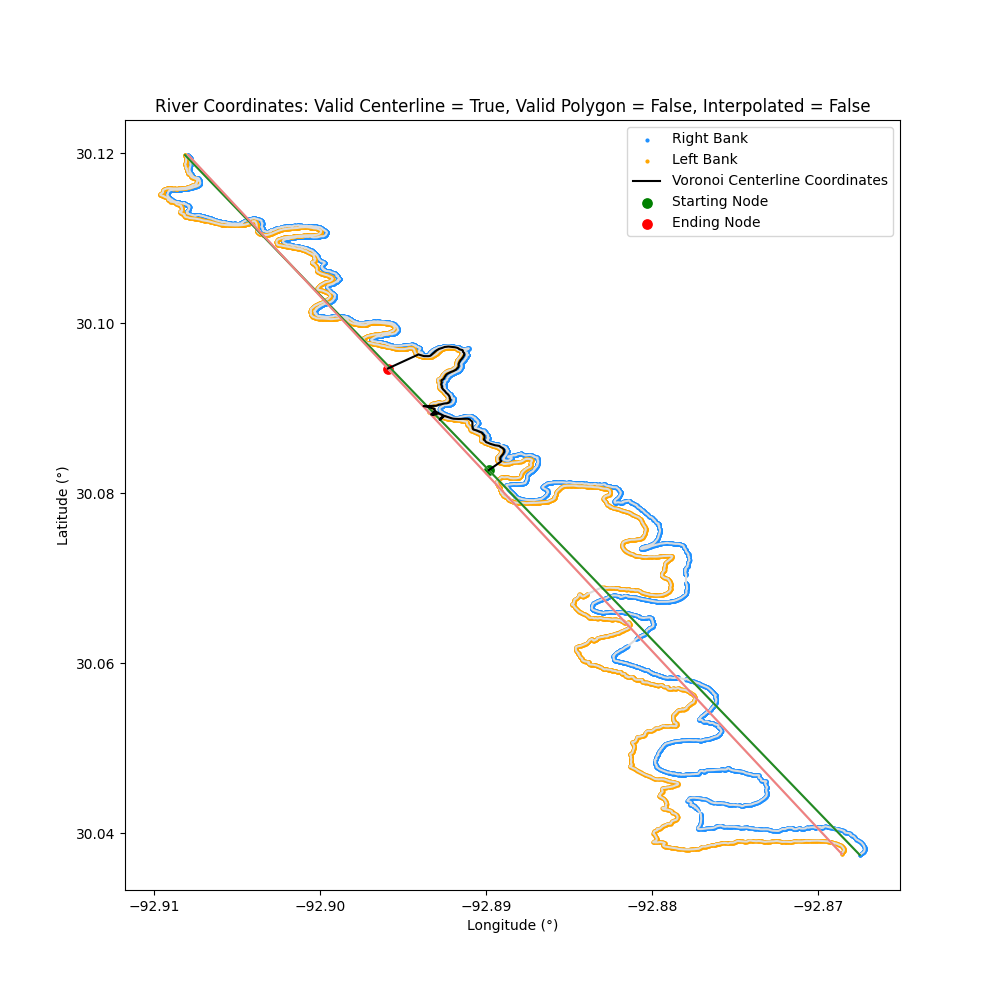
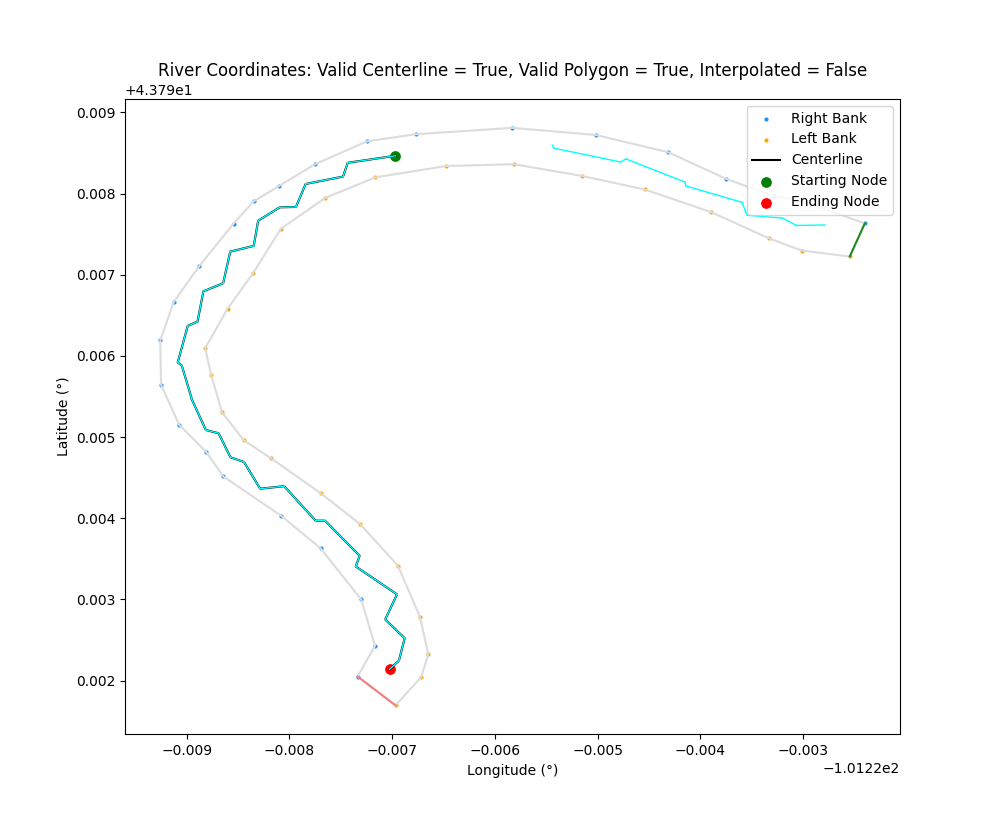
Gaps formed can cause part of the centerline to be skipped due to sparse data. As a result, the start and end of the centerline can skip parts at the beginning or end of a river
 Set river object created by
 centerline_width.riverCenterline to interpolate_data=True to fix for jagged edges or gaps formed by the interaction of sparse data and narrow banks
river_object = centerline_width.riverCenterline(csv_data="data/river_coords.csv", interpolate_data=True)| interpolate_data = False | interpolate_data = True |
|---|---|
 |
 |
 |
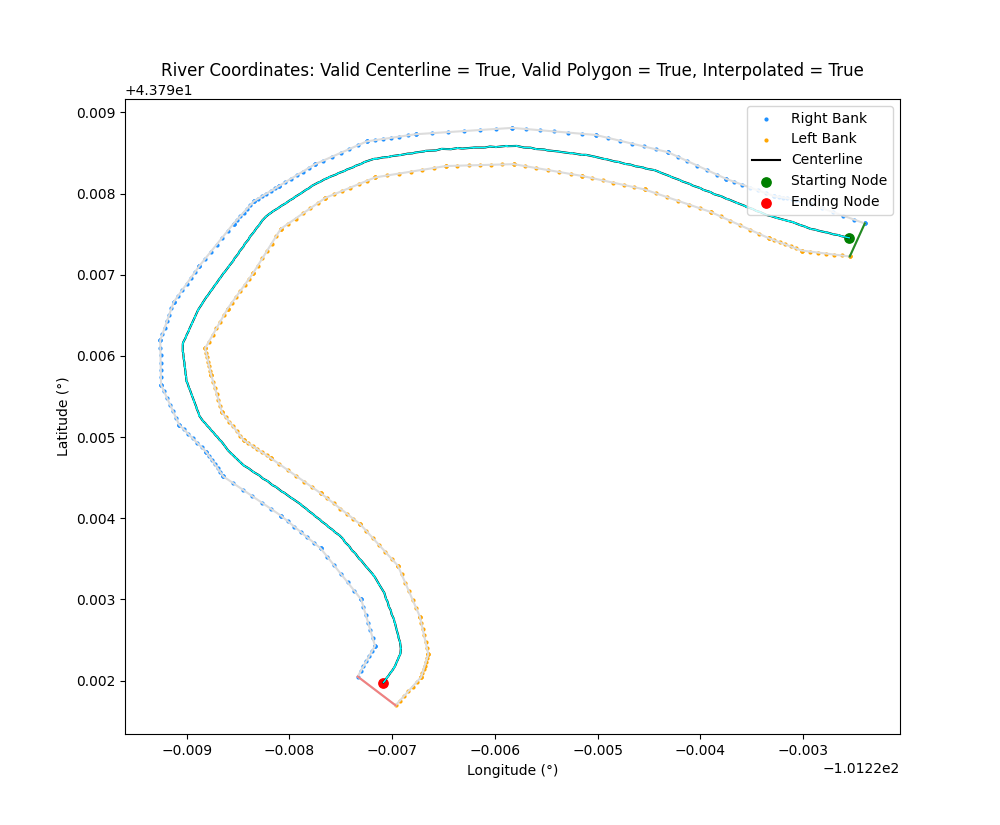 |
The number of additional points added by interpolating can be adjusted with interpolate_n, but defaults to add 5 additional points between values
To run or test against centerline-width github repo/fork, a development environment can be created via conda/miniconda
First, install Miniconda
Then, using the existing environment.yml, a new conda environment can be create to run/test scripts against
conda env create --file environment.yml
Once the environment has been built, activate the environment:
conda activate centerline_width
Set up pre-commit hooks to ensure standard code formatting and spelling:
pre-commit install
Pre-commit hooks can be manually run before commits:
pre-commit run --all-files
To run existing and new tests from the root directory:
python -m pytest
These features are not included in pip install because they are still experimental and being tested/debugged. For more information and getting them up and running, contact cyschneck@gmail.com or ugschneck@gmail.com or post a question as a Github Issue
-
Calculate sinuosity of river, in total and in equal parts
-
Calculate the dominant meander wavelength amd its variance
-
Calculate the asymmetry of the meanders
-
Calculate the dominant submeander and supermeander scales
-
Extract elevation/slope from river profiles (.kml files)
-
Overlay plots with images via geopandas
Originally a Python implementation of R-Code CMGO (Golly et al. 2017) but has since been extensively expanded:
Golly, A. and Turowski, J. M.: Deriving principal channel metrics from bank and long-profile geometry with the R package cmgo, Earth Surf. Dynam., 5, 557-570, https://doi.org/10.5194/esurf-5-557-2017, 2017.


Please acknowledge the use of this software in any publications:
"River centerline/width extraction software was provided by C. Y. Schneck and U. G. Schneck, and is available at URL: https://github.com/cyschneck/centerline-width."
We are interested in expanding this software based on river needs, so please send a copy of such publications to: cyschneck@gmail.com and ugschneck@gmail.com
This material is based upon work supported by the National Science Foundation Graduate Fellowship under Grant No. 2141064. Any opinions, findings, and conclusions or recommendations expressed in this material are those of the authors and do not necessarily reflect the views of the National Science Foundation.
Submit a bug fix, question, or feature request as a Github Issue or to ugschneck@gmail.com/cyschneck@gmail.com