Home
In this document, you will learn how to use template project to visualize your own data files exported from Cytoscape.
(This template project is now a part of Cytoscape core distribution (from 3.2.0) and will be used for Export as Interactive Web Visualization option.)
From version 3.1.0, Cytoscape can export network/table data and Visual Styles into Cytoscape.js JSON files. In this section, I will discuss how to visualize the exported JSON files with this template web application project.
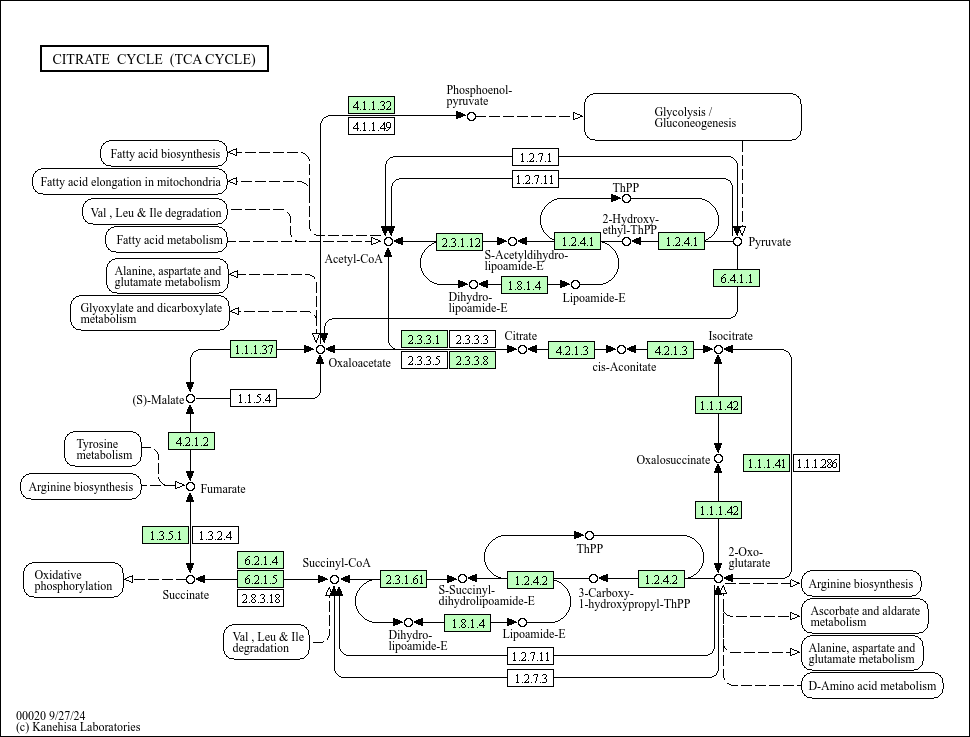
As a simple example to reproduce a network visualization created with Cytoscape, let's try to export KEGG pathway diagram from Cytoscape to Cytoscape.js.
- Cytoscape v3.1.0 and later
- Latest version of KEGGScape, a Cytoscape app to import KEGG pathway files
- Download the source pathway data from KEGG database. In this sample workflow, we use TCA Cycle pathway diagram for human (hsa00020).
- Select File → Import → Network and import the KGML file.
- Cytoscape automatically reproduce the pathway diagram based on the graphics information in the KGML file. This is done by creating custom Visual Style for KEGG pathways.

Now you have a Cytoscape version of network view. You can export it to PDF or other static image files, but here, we export it as JSON for web-based interactive web visualization.
- Select File → Export → Network and View... and from the export file type selector, select Cytoscape.js JSON (.cyjs). This generates a Cytoscape.js-style JSON file including network and table data.
- Select File → Export → Style... and choose Style for cytoscape.js for file format. This generates Visual Styles converted into Cytoscape.js compatible JSON style objects.
- Clone this repository:
git clone https://github.com/idekerlab/cyjs-export-parent.git - Initialize the Full version application in the submodules:
cd cyjs-export-full git submodule init git submodule update - Install dependencies:
bower install npm install - Build sample project for preview:
grunt serve

To visualize your own data with the full template application, you need to edit a setting file.
-
Copy your network and style JSON files into data directory.
-
Edit filelist.json file. You must use network title as the key for the file.
{ "style": "tca_cycle_human_style.json", "Citrate cycle (TCA cycle) [hsa00020]": "tca_cycle_human.cyjs" } ```
- Run grunt again:
grunt serve
And it open the browser and you can see visualization like this:

The template application has minimum set of features to browse your network data:
- Zoom (mouse wheel)
- Pan (Click & hold one second, then drag)
- Select and move
- Apply layout
- Switch Style (KEGG Style is applied in the following screenshot)
- Fit to screen
- Show/hide table browser

And you can customize this code as the basis of your own network visualization applications.
In this workflow, you have learned basic procedure how to visualize your dataset manually with this template code. From Cytoscape 3.2.0, you will have another way to visualize it:
This automates entire visualization process discussed here. As of October 1, 2014, the release date of Cytoscape 3.2.0 is late October.