Main purpose of this project is to show in numbers how the architectural choice and deployment affect performance and scalability in a distributed system.
REST and gRPC, with synchronous and reactive implementations (async, non-blocking), in search for high throughput and low latency.
I decided to build this project to further learn on these topics, and have a solid foundation to compare when future optimizations are used.
I wanted to see metrics like throughput, latency, and CPU usage, in various loads, with different architecture and deployment setups.
Latency, for example, affects contract SLAs and user experience (UX), and its analysis may help to define the maximum throughput allowed for an individual application. Certain parameters like throughput can be estimated using Little's law, but I preferred an empirical test. As described below, by changing the shopping carts per second (arrival rate), or by adding/removing nodes in the cluster (capacity, scaling in/out), one can observe how the system with a certain architecture behaves, with live metrics. The metrics include the whole process from a user (request) point-of-view, e.g. latency starts counting when a fictional shopping cart is created and finishes when the respective order is completed.

The deployment of the microservices is better described in the C4 container diagram below:

Enter directory /architecture-scalability/k8/cluster (I'll assume you're running scripts from there)
Start by running either:
./architecture-scalability/k8/cluster$ ./0-start-minikube.sh(requires minikube installed) or./architecture-scalability/k8/cluster$ ./0-start-aws.sh <your_cluster_name>(requires kops installed).
Pass your cluster name to the AWS script. This option also requires a hosted zone configured in Route53 in AWS, which will default to your cluster name. Kops will use AWS credentials from environment variables. Follow instructions given by kops after running the script.
Important: don't forget to delete your resources on AWS after use! (kops delete cluster <your_cluster_name> --yes)
Make sure the command docker login is working, so you can push images to your own repository.
Your repository name should be configured in the env file in ../../deployment/.env.
In this file you can also set the variable APP_PROTOCOL to REST or GRPC.
After that run the script to build and push ELK (ElasticSearch/Logstash/Kibana) images to your repository:
./architecture-scalability/k8/cluster$ ../../elk/elk-build-and-push.sh
You will need the container images in your repo. We use Jib for that. The pre-requisite to build is to have an environment variable DOCKERHUB_USER set to your docker hub repository. You can source the .env file you previously configured for that, though the easiest way is to run the script on the deployment directory (you need maven installed):
./architecture-scalability/k8/cluster$ ../../deployment/build_project_push_images.sh
You can now deploy RabbitMQ, ElasticSearch/Logstash/Kibana and the services by running:
./architecture-scalability/k8/cluster$ ./1-deploy-storage-elk-services.sh
Important: the script above replaces $DOCKERHUB_USER inside the Kubernetes deployment files!
Run 2-deploy-ingress-controller-minikube.sh (Minikube) or 2-deploy-ingress-controller-nginx.sh (for AWS) and finally 3-deploy-ingress.sh to finish up the deployment.
It might take from a few to multiple minutes until all services become available, especially when deploying to AWS.
Check section below "Monitoring performance" to see how you can play with it.
Some handy commands to check how deployment is going:
kubectl get deploymentskubectl get podskubectl logs <pod_name>kubectl describe pod <NAME>kubectl get ingresskubectl get service -n ingress-nginx
Install Metricbeat
Enable metricbeat's output to logstash. You can take a look at the configuration I used looking into /metricbeat/metricbeat.yml
Enable the http module and log and configure it like in /metricbeat/http.yml
Build the projects
./architecture_scalability$ mvn clean install
Then start the docker files inside directories checkout-job/docker, payment-service/docker, order-service/docker and elk, and run each service, although the easiest way is using the convenience script below:
./architecture_scalability$ ./deployment/local_deploy.sh
After around 1 minute the services should be ready - just be aware that fist run will take much longer, as Docker has to pull all images for RabbitMq, MongoDb, ELK, etc. Check section below "Monitoring performance" to see how you can play with it.
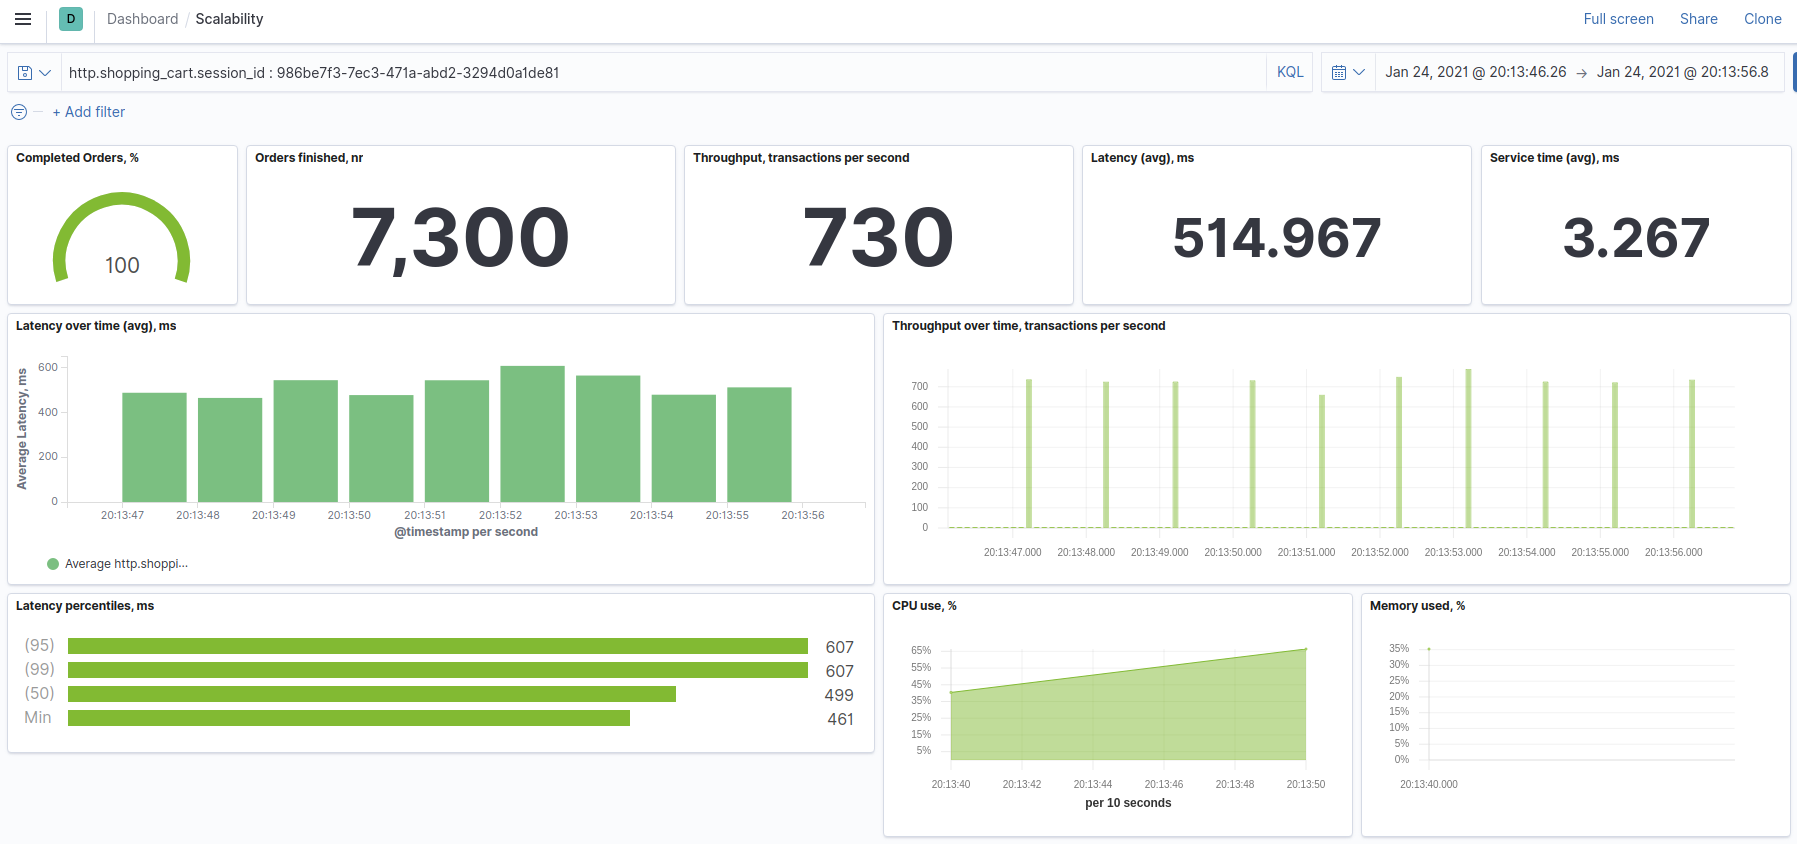
The process starts with the creation of shopping carts to be processed. These shopping carts will be processed by the checkout-job, which in turn uses the order service and payment service to transform the shopping cart in an actual completed order. This process can be followed through metrics visualized inside Kibana.
- Enter Kibana by pointing your browser to the ip as defined below (default user
elastic, passwordchangeme, add port5601for Local deployment!) - Find a dashboard named Scalability. This dashboard uses a parameter
session_idthat will be explained shortly. - Generate some shopping carts by POSTing to
http://<ip>/shopping-cart/samples/200(add port 9000 for Local deployment!)
The <ip> depends on your deployment type:
Local: 127.0.0.1:5601
Minikube: the ip returned by the command: minikube ip
AWS: the ip returned by the command: kubectl get ingress
The POST request returns a session_id, which you can copy and paste into Kibana's dashboard "Scalability".
Remember to adjust the date/time ranges inside the Dashboard.

The system is governed by the Management service. It contains the following endpoints:
/shopping-cart/samples/<number>: generate a<number>of sample shopping carts and insert them into the queue to be processed./shopping-cart/samples/<number>/for/<duration>/seconds: generate a<number>of sample shopping carts for<duration>seconds and keep inserting them into the queue to be processed. For example:
http://localhost:9000/shopping-cart/samples/1000/for/30/seconds(local) or
curl -X POST http://$(minikube ip)/shopping-cart/samples/10(minikube) or
curl -X POST http://$(kubectl get ingress -o=jsonpath='{.items[0].status.loadBalancer.ingress[0].hostname}')/shopping-cart/samples/10(AWS)
Inside Route53, select your Hosted Zone and copy its name servers (NS) to your custom domain (you can register one for free on http://www.dot.tk/). After that, create a new Record and fill in the section "Value/Route traffic to" as instructed below (at least when using the Create Record Wizard):
- Alias to Network Load Balancer
- < your AWS region >
- < Associate with the ELB created previously >
You now should be able to reach your deployment using your custom domain, and the ingress controller will continue redirecting to services as usual:
Example using the test domain my-domain.tk with the new record called "apps"
- Kibana: http://apps.my-domain.tk/
- Management API: http://apps.my-domain.tk/shopping-cart/samples/10