-
Notifications
You must be signed in to change notification settings - Fork 4
ProcessResourceDiagrams
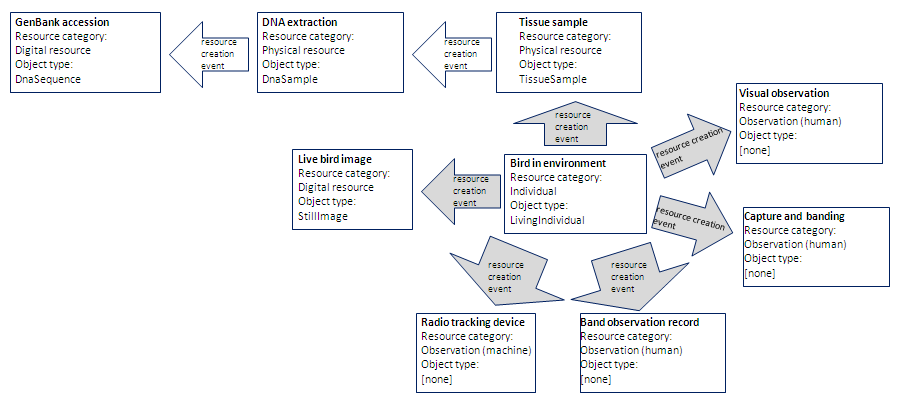
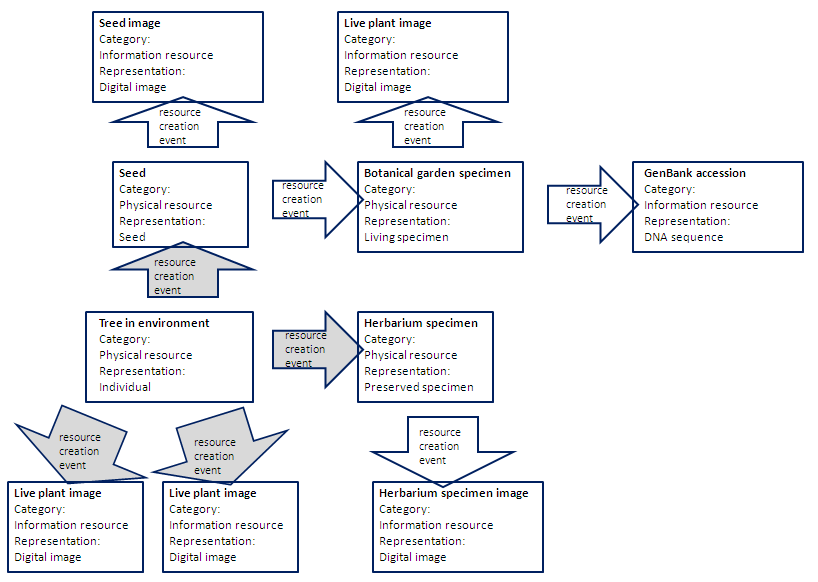
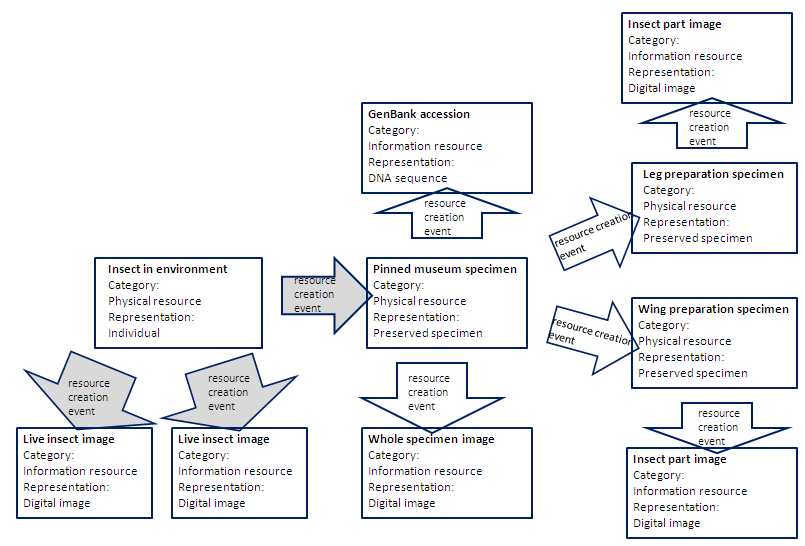
Diagrams from Biodiversity Informatics, 7, 2010, pp. 17-44 (https://journals.ku.edu/index.php/jbi/article/view/3664 ) to facilitate thinking of the sort discussed on the http://code.google.com/p/darwin-sw/wiki/WhatIsASpecimen page.
In the paper, the arrows were described as "resource creation events". I think that one could also say that they represent "processes" (sensu BFO/BCO/OBI) because I think a process transforms a resource from one kind to another. Thus, when one carries out a process, one could be considered to have created a new resource (although one might say that it is the same continuant).
The reason why some arrows are gray are because they are processes that can be considered to produce evidence of an occurrence (as it is used in DSW; an organism at a place and time).


