Regression: poor memory management in threads and sync schedulers #7583
Comments
|
Also cc @mrocklin @jrbourbeau . IMHO this should be treated as very high priority as it is something that is very likely to hit in the face a newbie user when he plays around with dask.array or dask.dataframe for the very first time. |
|
Hi, I'm also experiencing increased memory usage since ad0e5d1 I'm surprised to see the lack of discussion about this so far. Is there some other thread where this is being tracked? Best regards, |
|
Sorry to hear about the increased memory usage @parashardhapola. If you're able to look into where this might be coming from, that would be welcome. Gentle ping for @jakirkham in case you have any thoughts about this issue |
|
@jakirkham in case you have some time to look into this. |
|
I'm also having this issue. Something that would use about 3.70 gb ram now just uses so much memory it crashes. |
|
I'm also running into this issue here caracal-pipeline/crystalball#45. Whereas previously memory usage was stable for duration of execution, ad0e5d1 results in a quick OOM. I wonder if the removal of the reverse keyword when traversing sorted dependencies might be causing the issue? ad0e5d1#diff-fec9e4eca8d9878b2808d90c5875a3f5f347f88073e51f06a006841eeb3c0cfdR266 /cc @JSKenyon @o-smirnov |
|
This also affect our satellite processing in pytroll/satpy#1791 |
|
Thanks all for bumping this issue. @quasiben can you poke @jakirkham about this when he gets back? This seems to be a priority issue that arose from his work on swapping in concurrent.futures. Also cc @eriknw in case he is interested (although this may not be ordering related) |
|
I wanted to see if @sjperkins was on to something with the $ cat test_dask_memory_regression.py
from dask.diagnostics import ResourceProfiler, Profiler, CacheProfiler, visualize
import dask.array as da
from datetime import datetime
if __name__ == "__main__":
with Profiler() as prof, ResourceProfiler(dt=0.5) as rprof, CacheProfiler() as cprof:
d = da.random.random((5000, 250000), chunks=(1, -1)).sum()
d.compute(optimize_graph=False)
visualize(
[rprof, prof, cprof],
file_path=f'/tmp/profile_{datetime.utcnow():%Y%m%d_%H%M%S}.html',
show=False
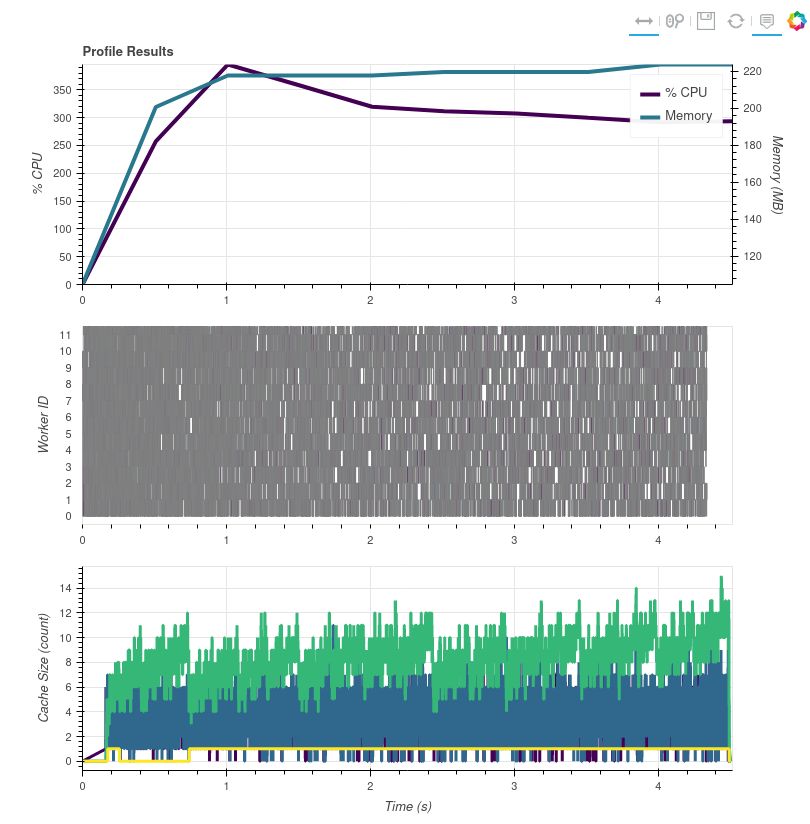
)Note I used a smaller number of rows to make the computation go faster for easier testing. Ran it locally and here's a screenshot of the results (github doesn't let me attach HTML files, I can put them somewhere if desired). Version 2021.3.1 - profile_20210813_132924.html
Peak: ~220MB Version 2021.6.2 - profile_20210813_131334.html
Peak: ~10GB I then hacked my 2021.6.2 install to undo the Edit: I know I used 2021.6.2 instead of 2021.4.0. I just tested with 2021.4.0 and same result as 2021.6.2 (same appearance in the profile). |


|
If you revert the concurrent.futures commit (is this possible?) do things
improve?
…On Fri, Aug 13, 2021 at 8:35 AM David Hoese ***@***.***> wrote:
I wanted to see if @sjperkins <https://github.com/sjperkins> was on to
something with the reverse changes so I made this script:
$ cat test_dask_memory_regression.pyfrom dask.diagnostics import ResourceProfiler, Profiler, CacheProfiler, visualizeimport dask.array as dafrom datetime import datetime
if __name__ == "__main__":
with Profiler() as prof, ResourceProfiler(dt=0.5) as rprof, CacheProfiler() as cprof:
d = da.random.random((5000, 250000), chunks=(1, -1)).sum()
d.compute(optimize_graph=False)
visualize(
[rprof, prof, cprof],
file_path=f'/tmp/profile_{datetime.utcnow():%Y%m%d_%H%M%S}.html',
show=False
)
Note I used a smaller number of rows to make the computation go faster for
easier testing. Ran it locally and here's a screenshot of the results
(github doesn't let me attach HTML files, I can put them somewhere if
desired).
Version 2021.3.1 - profile_20210813_132924.html
[image: image]
<https://user-images.githubusercontent.com/1828519/129364723-7b42c49f-6d8c-4ed9-bc96-3fba60997d8c.png>
Peak: ~220MB
Version 2021.6.2 - profile_20210813_131334.html
[image: image]
<https://user-images.githubusercontent.com/1828519/129364880-f69882f9-79e9-4472-b257-ec98c6ff412c.png>
Peak: ~10GB
I then hacked my 2021.6.2 install to undo the reverse changes (without
knowing why the changes were made or what purpose they serve) and did
*NOT* see any differences in the profile.
—
You are receiving this because you were mentioned.
Reply to this email directly, view it on GitHub
<#7583 (comment)>, or
unsubscribe
<https://github.com/notifications/unsubscribe-auth/AACKZTGPVRGUGPUFYWJBYITT4UNS3ANCNFSM43KBT6KA>
.
Triage notifications on the go with GitHub Mobile for iOS
<https://apps.apple.com/app/apple-store/id1477376905?ct=notification-email&mt=8&pt=524675>
or Android
<https://play.google.com/store/apps/details?id=com.github.android&utm_campaign=notification-email>
.
|
|
|
|
Stopping by to share that ordering hasn't changed and, indeed, probably isn't the issue. Using #7992, this plot shows the number of dependencies in memory based on
This looks similar to the "Cache Size (count)" profile plot from #7583 (comment). It may be interesting to create this profile plot for the original example too. |

I was hoping to be able to walk through the commits (eventually git bisect) of the PR and find the exact issue. Unfortunately the PR was squashed and @jakirkham deleted the branch (totally expected behavior and is the same thing I would do, just too bad in this case). There may be an option to recover the deleted branch but unlikely, especially to us non-jakirkham people. I can confirm @slevang's finding that before the concurrent futures PR it is fine and after that squashed commit it jumps up to the high memory usage. Here's the profile for the original 15000 row example case @eriknw:
Edit: This worked |

|
I was able to run git bisect on the individual commits from the pull request and unless I'm doing something wrong it all worked fine until the second to last commit which was a merge of Edit: I was doing something wrong. 😉 |
|
Ok so the first problem commit is 9d0aaa2 I updated my script for quick memory checking by replacing the visualize call with I took that problem commit, ran my script and noted the high memory usage, then I manually reverted the changes from that commit, ran my script and noted low memory usage. This is difficult to go any further for me (I'm making it up as I go along but it's friday so I'm avoiding real work). It is at least semi-simple to understand these if statements in this commit, but @jakirkham goes on in this pull request to re-add Edit: Played around with current main in the |
|
Adding a diagnostic to main here: while state["waiting"] or state["ready"] or state["running"]:
print(len(state["waiting"]), len(state["ready"]), len(state["running"]))reveals that all 5000 (or whatever number of) tasks are simultaneously in In that commit, tasks are explicitly not fired unless |
|
Thanks for pointing that out. That helps the understanding a lot more. I think I'm actually starting to understand the code, but don't know enough apparently to fix any memory issue. The running tasks are definitely not good and you can fix it by changing the code right under your print statement to say: - fire_tasks(chunksize)
+ print(len(state["waiting"]), len(state["ready"]), len(state["running"]))
+ if len(state["running"]) < num_workers:
+ fire_tasks(chunksize)But you also need to update the code a little higher so that when tasks are fired only available workers are used: - ntasks = min(nready, chunksize * num_workers)
+ avail_workers = max(num_workers - len(state["running"]), 0)
+ ntasks = min(nready, chunksize * avail_workers)But this doesn't help with the memory. Oh wait... Edit: 🤦 - ntasks = min(nready, chunksize * num_workers)
+ used_workers = -(len(state["running"]) // -chunksize)
+ avail_workers = max(num_workers - used_workers, 0)
+ ntasks = min(nready, chunksize * avail_workers)
+ print(nready, ntasks, num_workers, len(state["running"]), avail_workers, chunksize)Edit 2: That running is per-task realization also means that the other chunk of code has to be updated: - fire_tasks(chunksize)
+ print(len(state["waiting"]), len(state["ready"]), len(state["running"]))
+ if -(len(state["running"]) // -chunksize) < num_workers:
+ fire_tasks(chunksize)Edit 3: Ending debugging tonight. It might be worth it to remove batch tasks and only submit one task at a time. That is technically what's happening by default here, but that would at least tell us it is the concurrent.futures change that is causing the memory usage and not something about the batch/chunksize handling (ex. passing a list of arguments to submit). Edit 4: Here's a solution that works, doesn't actually run anything in batches (chunksize is 1) and still uses 10GB of memory: diff --git a/dask/local.py b/dask/local.py
index 9f035ef2..9c95264d 100644
--- a/dask/local.py
+++ b/dask/local.py
@@ -463,7 +463,11 @@ def get_async(
ntasks = nready
chunksize = -(ntasks // -num_workers)
else:
- ntasks = min(nready, chunksize * num_workers)
+ used_workers = -(len(state["running"]) // -chunksize)
+ avail_workers = max(num_workers - used_workers, 0)
+ #ntasks = min(nready, chunksize * num_workers)
+ ntasks = min(nready, chunksize * avail_workers)
+ print(nready, ntasks, num_workers, len(state["running"]), avail_workers, chunksize)
# Prep all ready tasks for submission
args = []
@@ -494,13 +498,18 @@ def get_async(
each_args = args[i * chunksize : (i + 1) * chunksize]
if not each_args:
break
- fut = submit(batch_execute_tasks, each_args)
+ fut = submit(execute_task, *each_args[0]) # only works when chunksize is 1
+ #fut = submit(batch_execute_tasks, each_args)
fut.add_done_callback(queue.put)
# Main loop, wait on tasks to finish, insert new ones
while state["waiting"] or state["ready"] or state["running"]:
+ print(len(state["waiting"]), len(state["ready"]), len(state["running"]))
fire_tasks(chunksize)
- for key, res_info, failed in queue_get(queue).result():
+ if not len(state["running"]):
+ print("Nothing is running")
+ continue
+ for key, res_info, failed in [queue_get(queue).result()]:
if failed:
exc, tb = loads(res_info)
if rerun_exceptions_locally:Makes me think concurrent futures is the problem. And the profile for this code:
So task graph looks the same as previously, but the cache isn't getting cleared up like it should. Sum tasks aren't getting done until all the |

|
Got it! See my edits above for the path to debugging, here's the current diff: diff --git a/dask/local.py b/dask/local.py
index 9f035ef2..913a4706 100644
--- a/dask/local.py
+++ b/dask/local.py
@@ -463,11 +463,14 @@ def get_async(
ntasks = nready
chunksize = -(ntasks // -num_workers)
else:
-                    ntasks = min(nready, chunksize * num_workers)
+                    used_workers = -(len(state["running"]) // -chunksize)
+                    avail_workers = max(num_workers - used_workers, 0)
+                    ntasks = min(nready, chunksize * avail_workers)
+                    print(nready, ntasks, num_workers, len(state["running"]), avail_workers, chunksize)
# Prep all ready tasks for submission
args = []
- for i, key in zip(range(ntasks), state["ready"]):
+ for key in state["ready"][nready-ntasks:nready]:
# Notify task is running
state["running"].add(key)
for f in pretask_cbs:
@@ -487,7 +490,7 @@ def get_async(
pack_exception,
)
)
- del state["ready"][:ntasks]
+ del state["ready"][nready-ntasks:nready]
# Batch submit
for i in range(-(len(args) // -chunksize)):
@@ -499,7 +502,11 @@ def get_async(
# Main loop, wait on tasks to finish, insert new ones
while state["waiting"] or state["ready"] or state["running"]:
+ print(len(state["waiting"]), len(state["ready"]), len(state["running"]))
fire_tasks(chunksize)
+ if not len(state["running"]):
+ print("Nothing is running")
+ continue
for key, res_info, failed in queue_get(queue).result():
if failed:
exc, tb = loads(res_info)I can make a pull request later today if this seems reasonable and we can discuss pros/cons of this approach (and see what tests fail). Here's the profile as proof:
So in summary:
|
|
PR #8040 |
|
Thank you for stepping up here David
…On Sat, Aug 14, 2021 at 11:01 AM David Hoese ***@***.***> wrote:
PR #8040 <#8040>
—
You are receiving this because you were mentioned.
Reply to this email directly, view it on GitHub
<#7583 (comment)>, or
unsubscribe
<https://github.com/notifications/unsubscribe-auth/AACKZTF2F3U4RSOTI3YB3ELT42HNDANCNFSM43KBT6KA>
.
Triage notifications on the go with GitHub Mobile for iOS
<https://apps.apple.com/app/apple-store/id1477376905?ct=notification-email&mt=8&pt=524675>
or Android
<https://play.google.com/store/apps/details?id=com.github.android&utm_campaign=notification-email>
.
|
|
FYI to anyone following this and not the #8040 PR, my reversing of the order of tasks which had a huge impact on the memory usage actually breaks the order setup by I think if "we" (users effected by changes to dask.order) want better performance beyond this we'll need to submit improvements to |
|
I'll be surprised if dask.order is what is misbehaving here. Finding valid bugs/rooms for improvement in that code are rare. I suspect that it's more likely that the changes of dask.local to use concurrent.futures messed with things a bit. In theory a single-threaded dask.local execution should follow the dask.order ordering exactly. I would encourage us to verify this with a test before going to improve dask.order. |
|
There is this test: Lines 160 to 172 in 4a59a68 Were you thinking something more complex? I see what you're saying though. Current |
|
Something more complex. Let's get a larger computation (maybe something like |
If this is confusing then speak up and I'll try to provide more guidance / an example. |
The main debug of this issue can be seen in #7583. I went through the entire series of steps for this where I started with no knowledge of how this worked to now coming up with ideas for how this could perform better 😉

### The Issues

The issues fixed here were introduced in #6322. They can be tested by monitoring/profiling the memory usage from this example:

```python
from dask.diagnostics import ResourceProfiler, Profiler, CacheProfiler, visualize
import dask.array as da
from datetime import datetime

if __name__ == "__main__":
    with Profiler() as prof, ResourceProfiler(dt=0.5) as rprof, CacheProfiler() as cprof:
        d = da.random.random((5000, 250000), chunks=(1, -1)).sum()
        d.compute(optimize_graph=False)
    #visualize(
    #        [rprof, prof, cprof],
    #        file_path=f'/tmp/profile_{datetime.utcnow():%Y%m%d_%H%M%S}.html',
    #        show=False
    #        )
    print(max(x.mem for x in rprof.results))
```

If you uncomment the visualize call then you can see the full profile output for it (see the related issue for screenshots). Ever since #6322 the memory for this example is huge at ~10GB max. Prior to that PR the max memory was ~220MB.

### Fixes

This PR mostly reverts us to the behavior before the concurrent.futures PR, but keeps the concurrent.futures API.
Reopen after triage from pydata/xarray#5165
Peak RAM usage:
Before #6322 (2021.3.1): 200 MiB
After #6322 (2021.4.0): 28 GiB
This regression impacts the
threadsandsyncschedulers.processesanddistributedare unaffected.CC @jakirkham
The text was updated successfully, but these errors were encountered: