A python iplementation of the Raincloud plot...Work in progress!
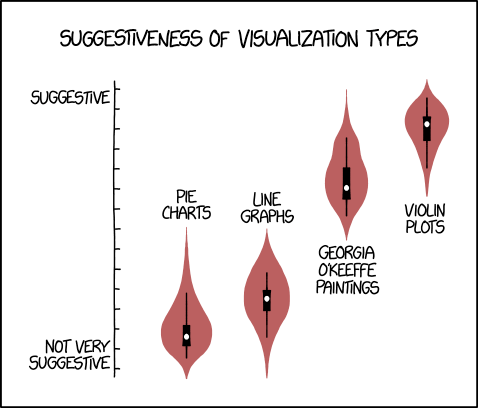
I tried to port to python the Raincloud plot (or PetitPrince plot, depending on the orientation) from R (under ggplot2) to Python. The Raincloud plot is a variant of the violin plot written in R ggplot2 by Micah Hallen. Everithing started with this xkcd comic, making fun of the violin plot.
I found a tweet asking for a .py version, and I agreed. Alas, the py version for ggplot2 does not allow to create new styles in a confortable way. So I decided to use the seaborn library and to rewrite a bit the violin_plot function. This is the rewitten version.
Then I tried to replicate the plots from the original post by Micah Hallen, using Jupyter.
- ask seaborn mantainers to add this new plot type
- add a "move" option in seabon to control the positioning of each plot, as in ggplot2.