Skip to content
New issue

Have a question about this project? Sign up for a free GitHub account to open an issue and contact its maintainers and the community.

By clicking “Sign up for GitHub”, you agree to our terms of service and privacy statement. We’ll occasionally send you account related emails.

Already on GitHub? Sign in to your account

ggmap does not seem to work with ggplot2::geom_sf #160

Open
yeedle opened this issue May 11, 2017 · 22 comments
Open

ggmap does not seem to work with ggplot2::geom_sf #160

yeedle opened this issue May 11, 2017 · 22 comments
Labels

Comments

@yeedle
Copy link

yeedle commented May 11, 2017

This might be an issue with geom_sf or an issue with how ggmap sets up the dataframe for ggmap or something else. I'm not sure, so I'm submitting it here and to ggplot2

library(sf)
library(ggmap)

nc_map <- get_map(c(-81, 35), zoom = 6) 
#> Map from URL : http://maps.googleapis.com/maps/api/staticmap?center=35,-81&zoom=6&size=640x640&scale=2&maptype=terrain&language=en-EN&sensor=false
ggmap(nc_map)

nc <- st_read(system.file("shape/nc.shp", package="sf"))
ggplot(nc) + geom_sf()

ggmap(nc_map) + geom_sf(data = nc)
#> Error in FUN(X[[i]], ...): object 'lon' not found
@lepennec
Copy link

lepennec commented Jun 8, 2017

I've made an attempt to solve the issue with pull request #162.

Note that for the nc shape, I have a slight offset between the shape and the map... so that some issues may remain.

@scottmmjackson
Copy link
Collaborator

I think we've got a decision to make here. @lepennec's solution seems to work, but I'm not sure what side effects it might have making the mapping specific to the geom_blank call.

@hadley proposed an alternative solution in the ggplot2 dupe issue. We may want to look at that as well.

@gregleleu
Copy link

gregleleu commented Mar 7, 2018

Hi,
I'm also trying to use geom_sf with ggmap and can't get the raster and layer to superpose correctly.
I thought it was a CRS issue but they seem coherent and nothing I tried worked.
@lepennec, is that the offset you mentionned?

Code and output below if it can help.

# UK local authorities boudary from UK geoportal (using KML for easy url version, it does the same with a shapefile)
uk_lads <- st_read("https://opendata.arcgis.com/datasets/fab4feab211c4899b602ecfbfbc420a3_3.kml")
st_crs(uk_lads)
# Coordinate Reference System:
#   EPSG: 4326 
#   proj4string: "+proj=longlat +datum=WGS84 +no_defs"
test_map_uk <- ggmap::get_map(location = unname(st_bbox(uk_lads)), source = "stamen")
ggmap::ggmap(test_map_uk) +
  geom_sf(data = uk_lads, inherit.aes = FALSE)

image

"Regular" plotting works well:

plot(st_transform(uk_lads,3857)[1], bgMap = test_map_uk)

image

@adrfantini
Copy link

adrfantini commented Mar 9, 2018

@gregleleu I also had this problem and never found the solution, unfortunately. Other map types work, just google has this problem.

@ateucher
Copy link

After struggling with this for a while, I found a way: The bounding box of the ggmap object is in WGS84 (EPSG:4326), but the actual raster is in EPSG:3857. You have to hack the bounding box of the ggmap object to be in the same CRS as the underlying data.

library(sf)
#> Linking to GEOS 3.6.2, GDAL 2.3.0, proj.4 5.1.0
library(ggmap)
#> Loading required package: ggplot2
#> Google Maps API Terms of Service: http://developers.google.com/maps/terms.
#> Please cite ggmap if you use it: see citation("ggmap") for details.
library(ggplot2)

uk_lads <- st_read("https://opendata.arcgis.com/datasets/fab4feab211c4899b602ecfbfbc420a3_3.kml")

# Convert to 3857
uk_lads_3857 <- st_transform(uk_lads, 3857)

test_map_uk <- ggmap::get_map(location = unname(st_bbox(uk_lads)), source = "stamen")

# overwrite the bbox of the ggmap object with that from the uk map that has
# been transformed to 3857
attr(test_map_uk, "bb")$ll.lat <- st_bbox(uk_lads_3857)["ymin"]
attr(test_map_uk, "bb")$ll.lon <- st_bbox(uk_lads_3857)["xmin"]
attr(test_map_uk, "bb")$ur.lat <- st_bbox(uk_lads_3857)["ymax"]
attr(test_map_uk, "bb")$ur.lon <- st_bbox(uk_lads_3857)["xmax"]

ggmap::ggmap(test_map_uk) +
  coord_sf(crs = st_crs(3857)) + # force it to be 3857
  geom_sf(data = uk_lads_3857, inherit.aes = FALSE)
#> Coordinate system already present. Adding new coordinate system, which will replace the existing one.

Created on 2018-06-13 by the reprex package (v0.2.0).

@ateucher
Copy link

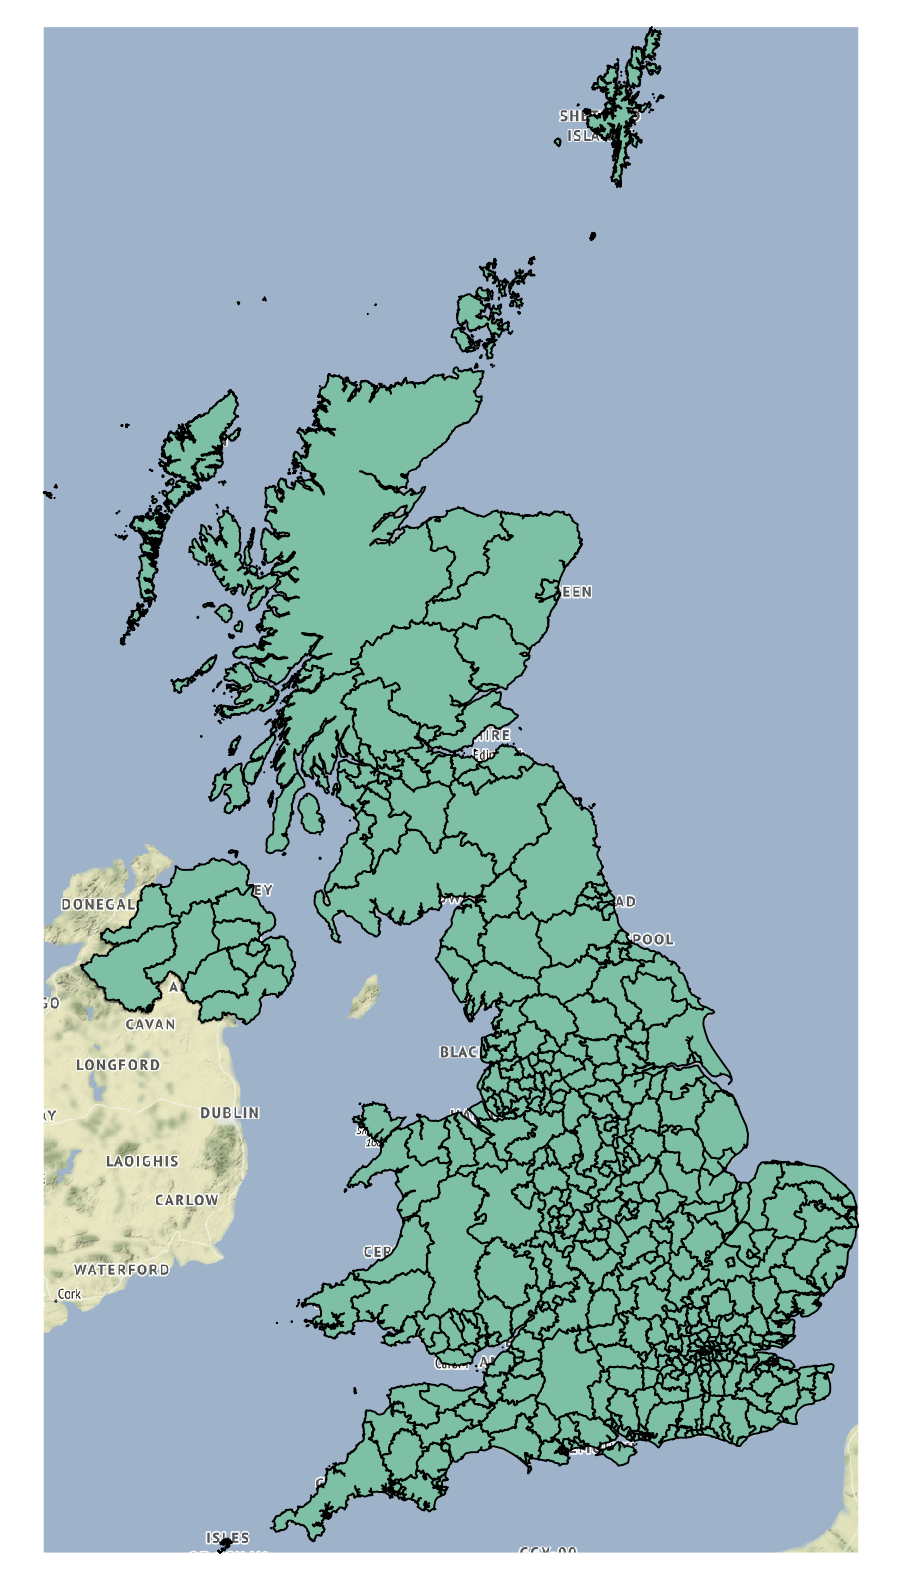
Edit: I posted a more general solution on StackOverflow which gets the bounding box from the ggmap object itself rather than from another source.

library(ggplot2)
library(ggmap)
library(sf)

uk_lads <- st_read("https://opendata.arcgis.com/datasets/fab4feab211c4899b602ecfbfbc420a3_3.kml")

# Convert to 3857
uk_lads_3857 <- st_transform(uk_lads, 3857)

test_map_uk <- ggmap::get_map(location = unname(st_bbox(uk_lads)), source = "stamen")

# Define a function to fix the bbox to be in EPSG:3857
ggmap_bbox <- function(map) {
  if (!inherits(map, "ggmap")) stop("map must be a ggmap object")
  # Extract the bounding box (in lat/lon) from the ggmap to a numeric vector, 
  # and set the names to what sf::st_bbox expects:
  map_bbox <- setNames(unlist(attr(map, "bb")), 
                       c("ymin", "xmin", "ymax", "xmax"))
  
  # Coonvert the bbox to an sf polygon, transform it to 3857, 
  # and convert back to a bbox (convoluted, but it works)
  bbox_3857 <- st_bbox(st_transform(st_as_sfc(st_bbox(map_bbox, crs = 4326)), 3857))
  
  # Overwrite the bbox of the ggmap object with the transformed coordinates 
  attr(map, "bb")$ll.lat <- bbox_3857["ymin"]
  attr(map, "bb")$ll.lon <- bbox_3857["xmin"]
  attr(map, "bb")$ur.lat <- bbox_3857["ymax"]
  attr(map, "bb")$ur.lon <- bbox_3857["xmax"]
  map
}

# Use the function:
test_map_uk <- ggmap_bbox(test_map_uk)

ggmap(test_map_uk) + 
  coord_sf(crs = st_crs(3857)) + # force the ggplot2 map to be in 3857
  geom_sf(data = uk_lads_3857, inherit.aes = FALSE)

@thiesben
Copy link

thiesben commented Nov 4, 2020

I honestly think this should be implemented somewhere as long as there is no other solution available.

@gregleleu
Copy link

gregleleu commented Nov 5, 2020

I submitted a pull request (also including base maps from carto) but it adds an sf dependency which fails at build time because some libraries are not on the CI/CD system

@JosiahParry
Copy link

Any movement here? :o

@admahood
Copy link

I honestly have been trying to figure out this hack for like an hour and I still can't get it to work

@talhazafarjutt
Copy link

coord_sf(crs = st_crs(3857)) + # force the ggplot2 map to be in 3857
  geom_sf(data = uk_lads_3857, inherit.aes = FALSE)

what will be the value of crs if we use map of singapore

@gregleleu
Copy link

@talhazarfarjutt, the underlying image of the map is in 3857, so we need to set the CRS of the overall ggplot to 3857 as it is in the code. Whatever crs your sf is in, geom_sf will reproject it to the ggplot crs (3857). So in theory nothing to change for Singapore. Is it not working?

@SimonDedman
Copy link

I feel like I've tried every possible combo of crses 2958, 3857, & 4326, to no avail. ggmap on a stars raster (crs 2958) works fine, but I can't add an st_contour -generated sf object via geom_sf. Reprex and diagnostic steps in the r-spatial/stars issue linked above. Any advice much appreciated. Cheers.

@gregleleu
Copy link

@SimonDedman st_contour segfaults on my computer (even after reinstalling and rebooting everything) so I can't run the reprex, but if that helps the steps I would try are:

  1. Get the ggmap basemap and fix the bbox using this hack ggmap does not seem to work with ggplot2::geom_sf #160 (comment)
  2. Build the ggplot starting with ggmap(basemap) + geom_stars + geom_sf layers, each layer with the data st_transformed to 3857 and with inherit.aes = FALSE
  3. Add coord_sf(crs = st_crs(3857)), it will throw a "Coordinate system already present" warning, but there is no way around it for the moment

@philipgladwin
Copy link

Is there a fix available for this issue? Or could anybody recommend a work-around, or a link to an example that works - preferably for a UK map? Thank you, Phil

@SimonDedman
Copy link

SimonDedman commented Mar 10, 2022

Hack from above:

ggmap_bbox <- function(map) {
    if (!inherits(map, "ggmap")) stop("map must be a ggmap object")
    # Extract the bounding box (in lat/lon) from the ggmap to a numeric vector, 
    # and set the names to what sf::st_bbox expects:
    map_bbox <- setNames(unlist(attr(map, "bb")), c("ymin", "xmin", "ymax", "xmax"))
    # Convert the bbox to an sf polygon, transform it to 3857, 
    # and convert back to a bbox (convoluted, but it works)
    bbox_3857 <- st_bbox(st_transform(st_as_sfc(st_bbox(map_bbox, crs = 4326)), 3857))
    # Overwrite the bbox of the ggmap object with the transformed coordinates 
    attr(map, "bb")$ll.lat <- bbox_3857["ymin"]
    attr(map, "bb")$ll.lon <- bbox_3857["xmin"]
    attr(map, "bb")$ur.lat <- bbox_3857["ymax"]
    attr(map, "bb")$ur.lon <- bbox_3857["xmax"]
    map
  }
  myMap <- ggmap_bbox(myMap) # Use the function

Then

ggmap(myMap) +

and for each geom_sf: st_transform(3857) the data, and inherit.aes = FALSE. Unfortunately (for me) this fixing system disallows cropping with scale_xy_continuous, e.g..

@kaijagahm
Copy link

Hi all! Is this workaround still considered best practice for using ggmap and sf together? It seems like it still doesn't allow for all tweaks, e.g. disallowing cropping as mentioned by @SimonDedman.

I see this question all over the internet and have been struggling with it for a while. Are there plans to implement this solution into the sf package eventually, or is there some reason that's not a good idea? Is there a different best practice that I'm missing? I absolutely respect that the sf developers have lots on their plate; I'm genuinely trying to understand the best guidance here, given that this seems like a pretty common thing to want to do.

Thank you very much!

@talhazafarjutt
Copy link

Hi all! Is this workaround still considered best practice for using ggmap and sf together? It seems like it still doesn't allow for all tweaks, e.g. disallowing cropping as mentioned by @SimonDedman.

I see this question all over the internet and have been struggling with it for a while. Are there plans to implement this solution into the sf package eventually, or is there some reason that's not a good idea? Is there a different best practice that I'm missing? I absolutely respect that the sf developers have lots on their plate; I'm genuinely trying to understand the best guidance here, given that this seems like a pretty common thing to want to do.

Thank you very much!

i think all above mentioned libraries are mature now, i also faced problems but at the end problem was from my side.

@gregleleu
Copy link

I have switched to {maptiles} to get the basemaps and {tidyterra} to plot them, it is a bit slower but integrates better with the {sf} and tidyverse ways of working.
It is slower because maptiles creates an actual raster (using terra) and tidyterra maps the raster and by default resamples it, reprojects etc.

@SimonDedman
Copy link

I have switched to {maptiles} to get the basemaps and {tidyterra} to plot them, it is a bit slower but integrates better with the {sf} and tidyverse ways of working. It is slower because maptiles creates an actual raster (using terra) and tidyterra maps the raster and by default resamples it, reprojects etc.

This sounds interesting Greg; I don't suppose you'd be prepared to share an example code chunk to demonstrate your workflow for this? Thanks!

@gregleleu
Copy link

Here's an example.
I added the coord_sf to show the raster follows the CRS if you change it.
"maxcell" is the max number of pixels for the raster; if the raster has more than that tidyterra downsamples it. Try it with lower numbers, it gets all blurry.

Hope that helps

bbox <- st_as_sfc("POLYGON((-76.751013 39.405805, -76.446142 39.405805, -76.446142 39.174102, -76.751013 39.174102, -76.751013 39.405805))", crs = 4326)

tmp_map <- maptiles::get_tiles(bbox %>% st_transform(3857), 
                               provider = "CartoDB.Positron", zoom = 12, crop = TRUE)

ctny <- tigris::counties(state = "MD", cb = TRUE) %>% st_transform(4326)
ctny %<>% 
  rmapshaper::ms_lines() %>% 
  st_crop(bbox)

ggplot() +
  tidyterra::geom_spatraster_rgb(data = tmp_map, maxcell = 5e9) +
  geom_sf(data = ctny, fill = NA, colour = "black", linewidth = 0.5, linetype = 2) +
  coord_sf(crs = 5070)

@SimonDedman
Copy link

Thanks @gregleleu , that's very nice.

It looks like there's no scope to use Google's terrain image maps for the data provider in maptiles::get_tiles, as far as I can see, which is a shame. I'm new to that package so maybe I'm missing something however.

Sign up for free to join this conversation on GitHub. Already have an account? Sign in to comment
Labels
Projects
None yet
Development

No branches or pull requests