Analyzer dependencies showing as unresolved full paths #5418
Comments
|
As part of fixing this, add coverage of analyzers to the integration tests. |
|
Some notes to capture findings of investigations.
(EDIT removed incorrect |
|
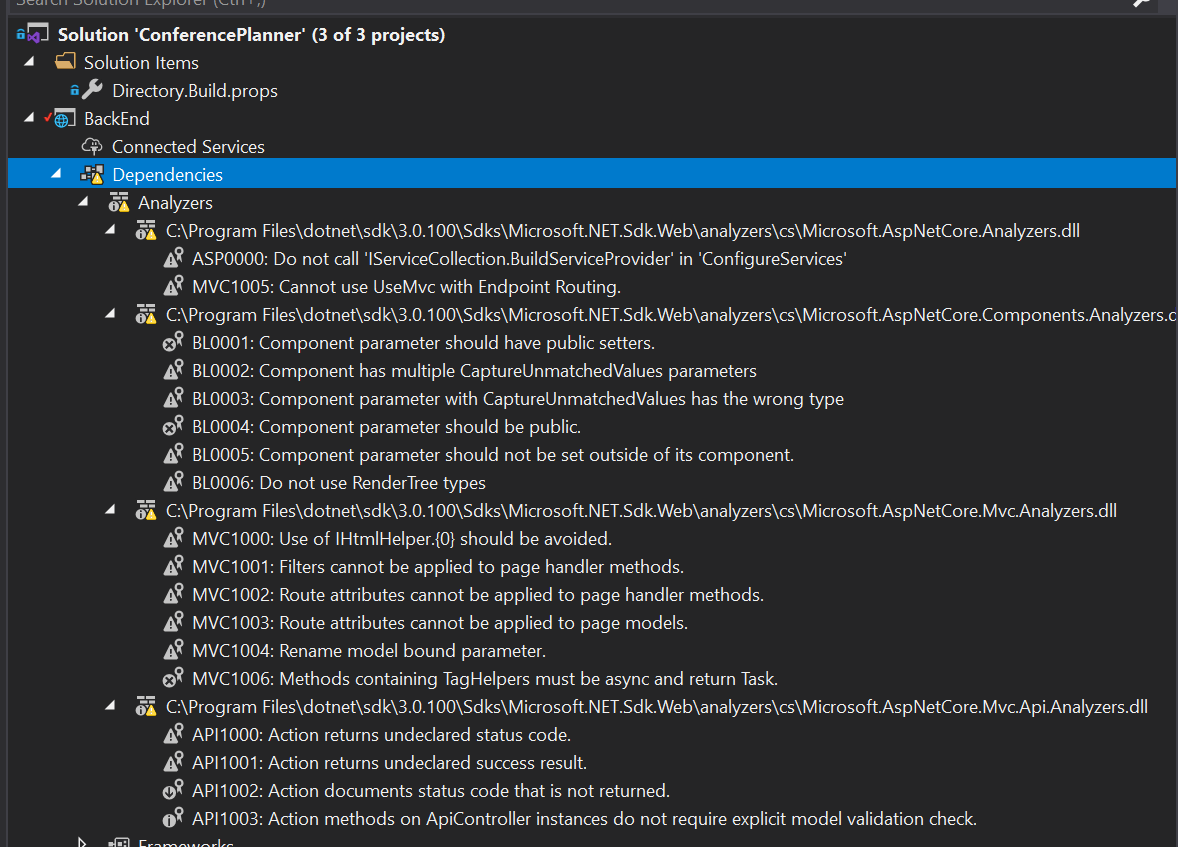
FYI still repros in 16.3.1 when working with ASP.NET Core projects: |
|
This is potentially caused by metadata filtering in the DTB cache for task items. From the (internal) ProjectServices repo:
This filtering applies when writing the cache, which fits with the above repro steps. My current hunch is that data needed by the Analyzers node is being filtered out by the cache, but this needs further investigation. |
|
Paths are shown for unresolved analyzer references: EDIT: This is a red herring. Roslyn creates the full Analyzers node for legacy projects, but for this project system it only populates diagnostic items. We have similar logic however: |
|
This can be reproduced more easily by:
Deleting the EDIT The above worked for me five times in a row, but no longer does. It doesn't seem that deterministic. Running VS in the debugger makes it fail more often. Right now I'm Ctrl+F5'ing and can't repro it at all. |
|
@drewnoakes really appreciate the persistence on this 👍 |
|
@drewnoakes post helped me out! Thank you! |
|
Getting closer. This appears to be a race condition. If the VS instance is 'warm' (has previously had a solution open) then the problem triggers. The presence of the DTB cache factors in to the sequence of events, as it's much faster to read the cache than do a DTB. It also explains why using the debugger hasn't been helpful, as that changes timing too. I'm going to add some tracing to dig deeper. |
|
This has been fixed and will be released in 16.5. |
|
could be but 16.5 is not out yet |
I just updated Visual studio to 16.4.4 and the issue was resolved. |
|
@keserwan glad it's working for you, but the fix is not present in that build. It will be in 16.5, and most likely in a preview. |
|
I fixed this error by deleting the solution's |
|
@arphox Thanks alot. Your suggestion worked for me |
|
That will work until the next reload of the solution, the fix is in 16.5. |
|
That's also works for me. Thanks @arphox |
|
Hi, We've found another manifestation of this issue in our project extension. When the project loads, we see a an "empty" (but not null) project change (presumably an inconsequential DTB?). In the same update there is an evaluation change, which is the resolution of the analyzer files. Since the project change is not null, the evaluation change is not handled, and so we see the dreaded warning triangles. We do not have a simple replication, but we do have a simple one-line fix in |
Basically, don't let empty project updates eclipse potential
evaluation updates.
Steps to reproduce:
xunit.analyzersAnalyzersnodeAnalyzersnode appears with unresolved child, which is a full path rather than the analyzer's nameAnalyzersnode is missing againOpen questions:
Analyzersnode not initially present? This seems to happen if the build before opening the solution happened within VS.The text was updated successfully, but these errors were encountered: