Native memory leak with ETW EventSource #12374
Comments
|
The thought occurred to me that PerfView is just the tool for tracking down the heap allocations. Indeed, here are the relevant allocating stacks:
|
|
@pharring I'm taking a look. |
|
FYI, I was able to eliminate PerfView from the repro by building my own TraceEvent-based listener. I also got a simplified repro in Azure App Service. They all have the same symptoms, pointing to this as the root cause. |
|
Thanks @pharring, I am able to repro it locally with the code above. |
|
Including @brianrob who wrote this. I took a quick look and the key place is the stack Which says that starting with an event write, we try to create a handle for it (for EventPipe), and this seems to allocate ALL THE TIME. However a handle to an event is about its Meta-Data, and thus there should be a lookup and MOST of the time we should NOT be creating new event meta-data. Thus the basic issue is that we are missing our 'lookup' that would find that we already have meta-data for this event. @brianrob - Can you quickly tell us where it SHOULD be happening? There is a secondary issue that we should not need this meta-data at all unless EventPipe is turned on (which it is not), so it would be nice if we avoided even generating the handle if EventPipe is off. @jorive - We should also check the scenario where we are collecting with EventPIpe instead of ETW before we call this bug fixed. |
|
I'm unable to repro in |
|
@jorive - I assume you are going to try back-porting that fix (it is not that big). @pharring - assuming that the fix above fixes things, the main thing we need to figure out is the impact of the bug. Can you detail the impact so that @jorive and make the case to the triage group. In particular, in a 'normal' use of Application Insights, how bad is the leak? I am assuming that it is big enough that it forces customers to turn off App-Insights. It will also affect any other data collection (thus things leak if you also collect with PerfView). We should err on the side of fixing this, Looking at https://github.com/dotnet/core/blob/master/release-notes/download-archive.md, we have already released 3 updates to 2.2. and presumably we will have another within a month. That will likely live at least 6 more months before V3.0 becomes available, so I think it is worth it. |
|
@vancem, you're right that this is about metadata, and prior to dotnet/coreclr#18355, the cache was essentially busted and so we always created a new metadata blob. With dotnet/coreclr#18355 this should no longer happen and only a single blob per event should be created. It is likely possible to avoid creating the metadata if EventPipe isn't enabled, but if I recall correctly, I did the metadata generation regardless because it was hard to get to a place outside of event initialization that had enough of the data required to produce the metadata. |
|
FWIW, our team had to remove all usage of EventPipe used for diagnostics in our product, as the memory leak was extreme and would OOM kill our process every couple of hours. Backporting any fixes to 2.2 would be much appreciated. |
+1
It is actually depends on the load. The leak is about ~200 bytes per event as I understand |
|
@jorive - it sounds like this bug is rather severe. I think we have a strong case to back-port it to V2.2. We should pursue that. |
|
Agreed |
|
I'm preparing port to 2.2 right now. |
|
Any idea if this could be available on Azure at all? I mean deployed to Azure and so could be used in App Service? If yes then how long does it takes usually? :) |
|
Seems like issue is still reproducible on 2.2.5. I'm using EventListener for monitoring events and when using it, memory usage in dotnet.exe climbs very fast Host dotnet --info:
|
|
We are also still seeing this issue on 2.2.5. Exact same dotnet --info output as above. |
|
@SPANIOL Does it cap around ~1GB (This is the default internal circular buffer allocated/used)? |
|
@jorive yeah, i believe it may be the case, left service for 3 days without any traffic and it used around 900 mb of memory, while usually it uses around 150 mb. |
|
That memory is reused to buffer events before writing to file, and it should not grow beyond the specified value. It's not a memory leak. |
|
Is this memory not used when you disable EventPipe? |
How big is the buffer in 2.2? PS: Has this changed in 3.0, taking in to account changes related to the Docker ? |
|
@mjsabby memory isn't used when pipe is disabled, when enabled memory usage climbs like crazy under traffic, while heap usage remains at same level |
|
@SPANIOL Yes, there are few ways to configure the size of the buffer, and depends on how are you enabling EventPipe tracing in your project.
|
|
@jorive sounds promising! i'll try configuration via env variables tomorrow and post results here in case if anyone will have such troubles, i can see that ticket for documentation related to EventPipe's is still open, so it's difficult to figured it out from the start, but the case to use them for basic monitoring will be common |
|
@SPANIOL For 3.0 we added runtime event counters, which is far more low-overhead for purposes like simple APMs or dashboards for "basic monitoring" scenarios. Unfortunately backporting that to 2.2 is far more costly than we can afford, but just wanted to let you know that better alternatives do exist in 3.0 :) |
This memory is deallocated when the tracing session is disabled. |
|
I created dotnet/coreclr#25413 to track this. FWIW, I think 256MB is probably too big of a default and we should look into changing it. |
|
I believe 256MB is the default used by PerfView, but I agree we should consider lowering it. |
|
Our microservices were growing at a rate of 40MB per hour (each) because of this issue. We have turned off the Prometheus.Net collectors that hook up to the event sources as a temporary workaround (djluck/prometheus-net.DotNetRuntime#6). This is definitely not using a circular buffer as I have an instance that's been running for 9 days and is now at an approximate 7GB commit size and still growing! I have confirmed .Net Core 3 - Preview 8 does not experience the same issue. I have also confirmed that .Net Core 2.2.0 - 2.2.6 do experience the issue. I have the same stack trace for the allocations as mentioned in the first reply above. Please back-port the fix to .Net Core 2.2. |
|
cc @josalem
That definitely doesn't sound normal to me either.
This makes me less nervous. That being said, AFAIK @jorive already ported his fix (dotnet/coreclr#23661) to 2.2 and if it's not addressing the issue, we might be looking at a different issue from one that was already ported. Do you happen to have a memory dump and/or a small repro that I can use to repro the behavior? |
|
Sorry, I do not think I can share the full memory dump, but here is some data from the memory dump and I can get you more data upon request. As you can see, at the time of that memory dump, there was 52,217 occurrences of these 102,400 byte objects that take up a total of 5,347,020,800 (5.3 GB) of memory. I spot checked some of the same size objects in a debug instance and they all had the same allocation stack trace listed here (sorry for the mix-up, my stack trace is different than the OP's stack trace). The repro was pretty simple. I made an Asp.Net Core 2.2.4 targeted application that was self hosted as a console app and self contained with I can create a project like that and attach a zip if you'd like. |
|
Attached is a simple app the reproduces my issue. EventPipeMemoryLeak.zip I just let the app sit idle and the memory usage is continuously increasing. And the heap stats show a regular increase in quantity of these 0x19000 size objects. |
|
@tylerohlsen I'm running the repro app and trying to see how it ends up in that state. So far I'm not seeing anything that's not expected - I'm waiting to see if the memory usage grows beyond 1GB which is what EventListener sessions have as the max limit. That being said the 0x19000 size events does correspond to the EventPipe buffer blocks that we allocate internally to store the events. The repro app's been running for about ~1.5 hours now and it's at 380MB - I will come back in a few hours and see how things have changed and take it from there. |
|
@tylerohlsen I moved the issue to dotnet/coreclr#26344 because this issue is different from the original issue. I'll continue posting things in that thread. |
|
Closing this issue since the original issue was fixed in both master/2.2. |
Reported originally at microsoft/ApplicationInsights-dotnet#1102
Repros on .NET Core 2.2, x86 and x64 on Windows.
Build the following application:
Run it on Windows and watch the memory usage of dotnet.exe in Task Manager. It settles down on my machine around 10 MB.
Now enable the ETW event listener for the event source. The easiest way to do that is to run PerfView. Press Alt+C to start a collection and make it look like this:
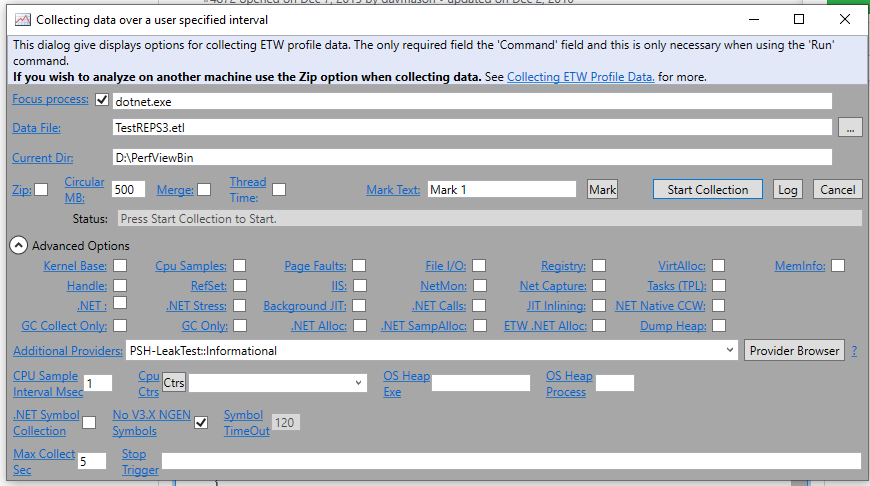
The important thing is to add this in Additional Providers:
PSH-LeakTest::InformationalYou can turn off all the other options.
Now, when you start logging, watch the memory usage in dotnet.exe climb like crazy (over 200 MB in 5 seconds).
When you stop logging, the memory isn't freed. If you create a dump of the dotnet.exe process, the GC heap is fine. Most of the additional memory is in native heap and it seems to consist of the event manifests repeated over and over again.
This does not reproduce on .NET 4.7.2
I don't know about earlier .NET Core runtimes.
Please let me know if you need any more information, but I think this is a pretty minimal repro with clear instructions. One thing I could do is eliminate PerfView by writing a custom app based around TraceEvent or even a WPR profile.
To be clear how this affects Application Insights customers: The Application Insights Profiler runs in Azure App Services. It captures ETW sessions for 2 minutes at a time about once an hour. One of the providers it enables (listens to), is the Application Insights "Rich Payload Event Source" (see the original bug in the Application Insights repo). Customers are now encountering these memory leaks under load when profiling is running leading to application restarts.
The text was updated successfully, but these errors were encountered: