The fork can process large GTFS files, contains a poster-generation code, adds a possibility to restrict the visualization area within a certain radius, and other improvements.
GTFS is an abbreviation for General Transit Feed Specification, a standard which “defines a common format for public transportation schedules and associated geographic information” (source).
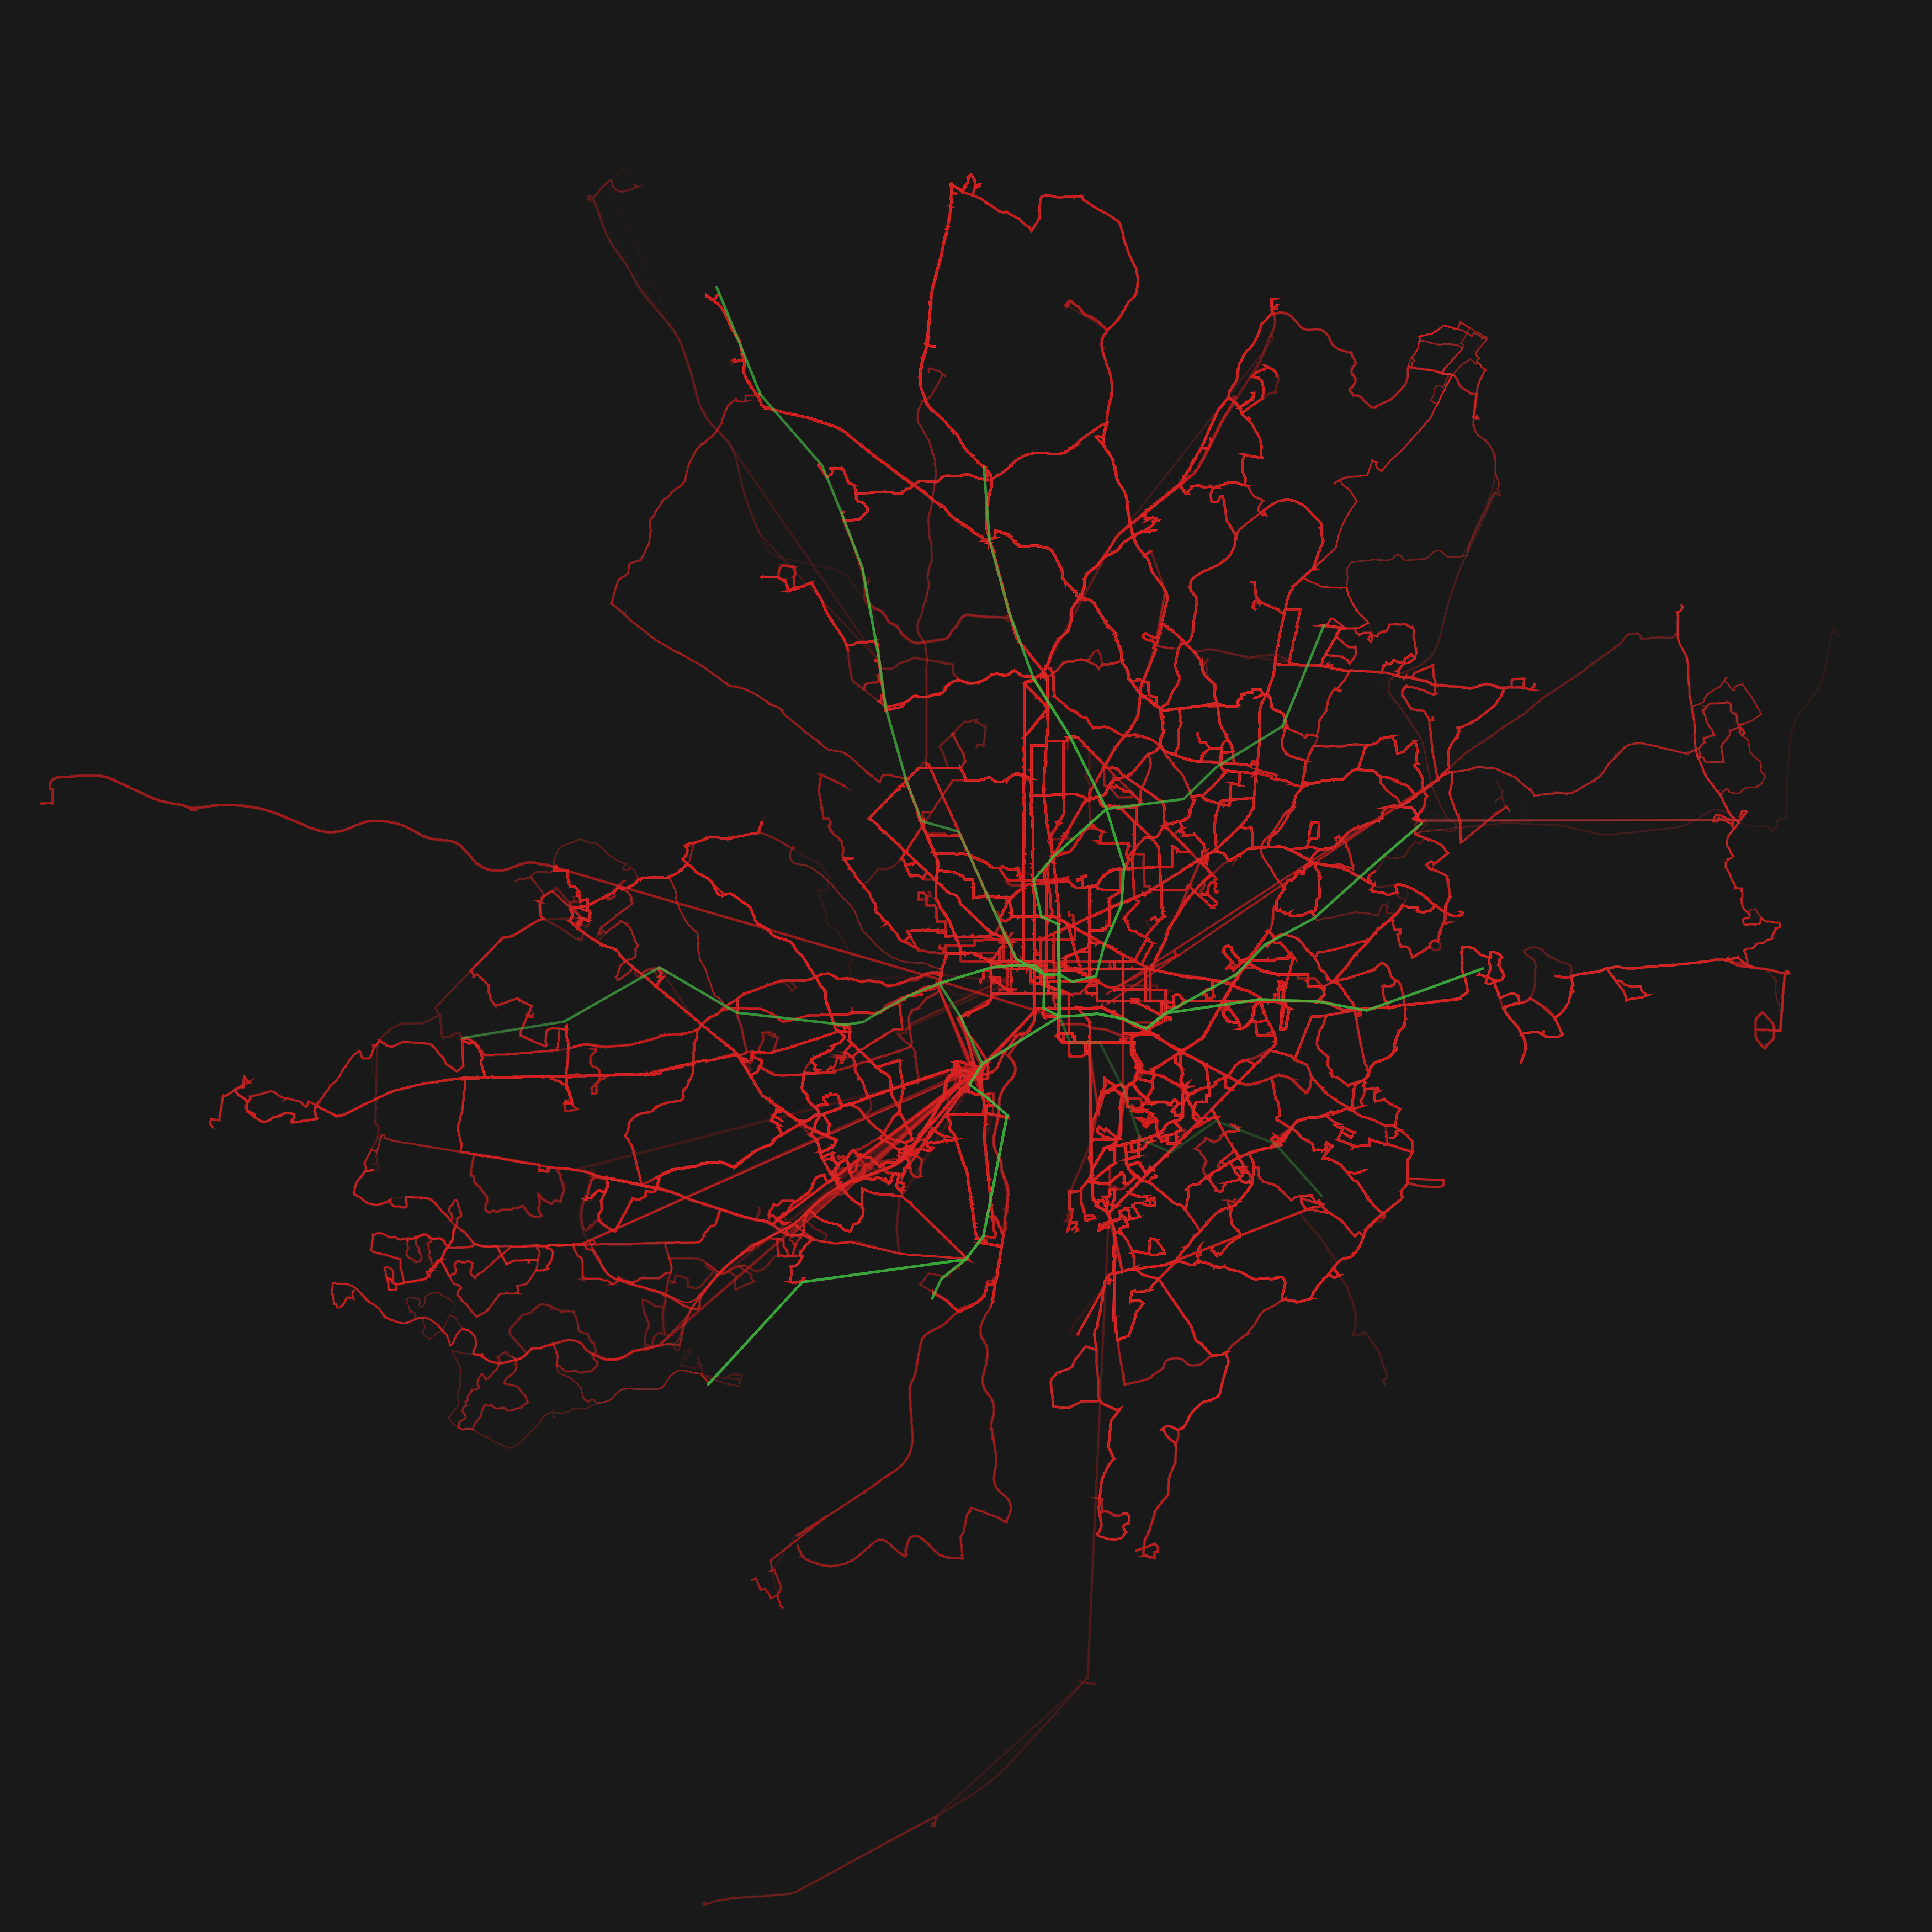
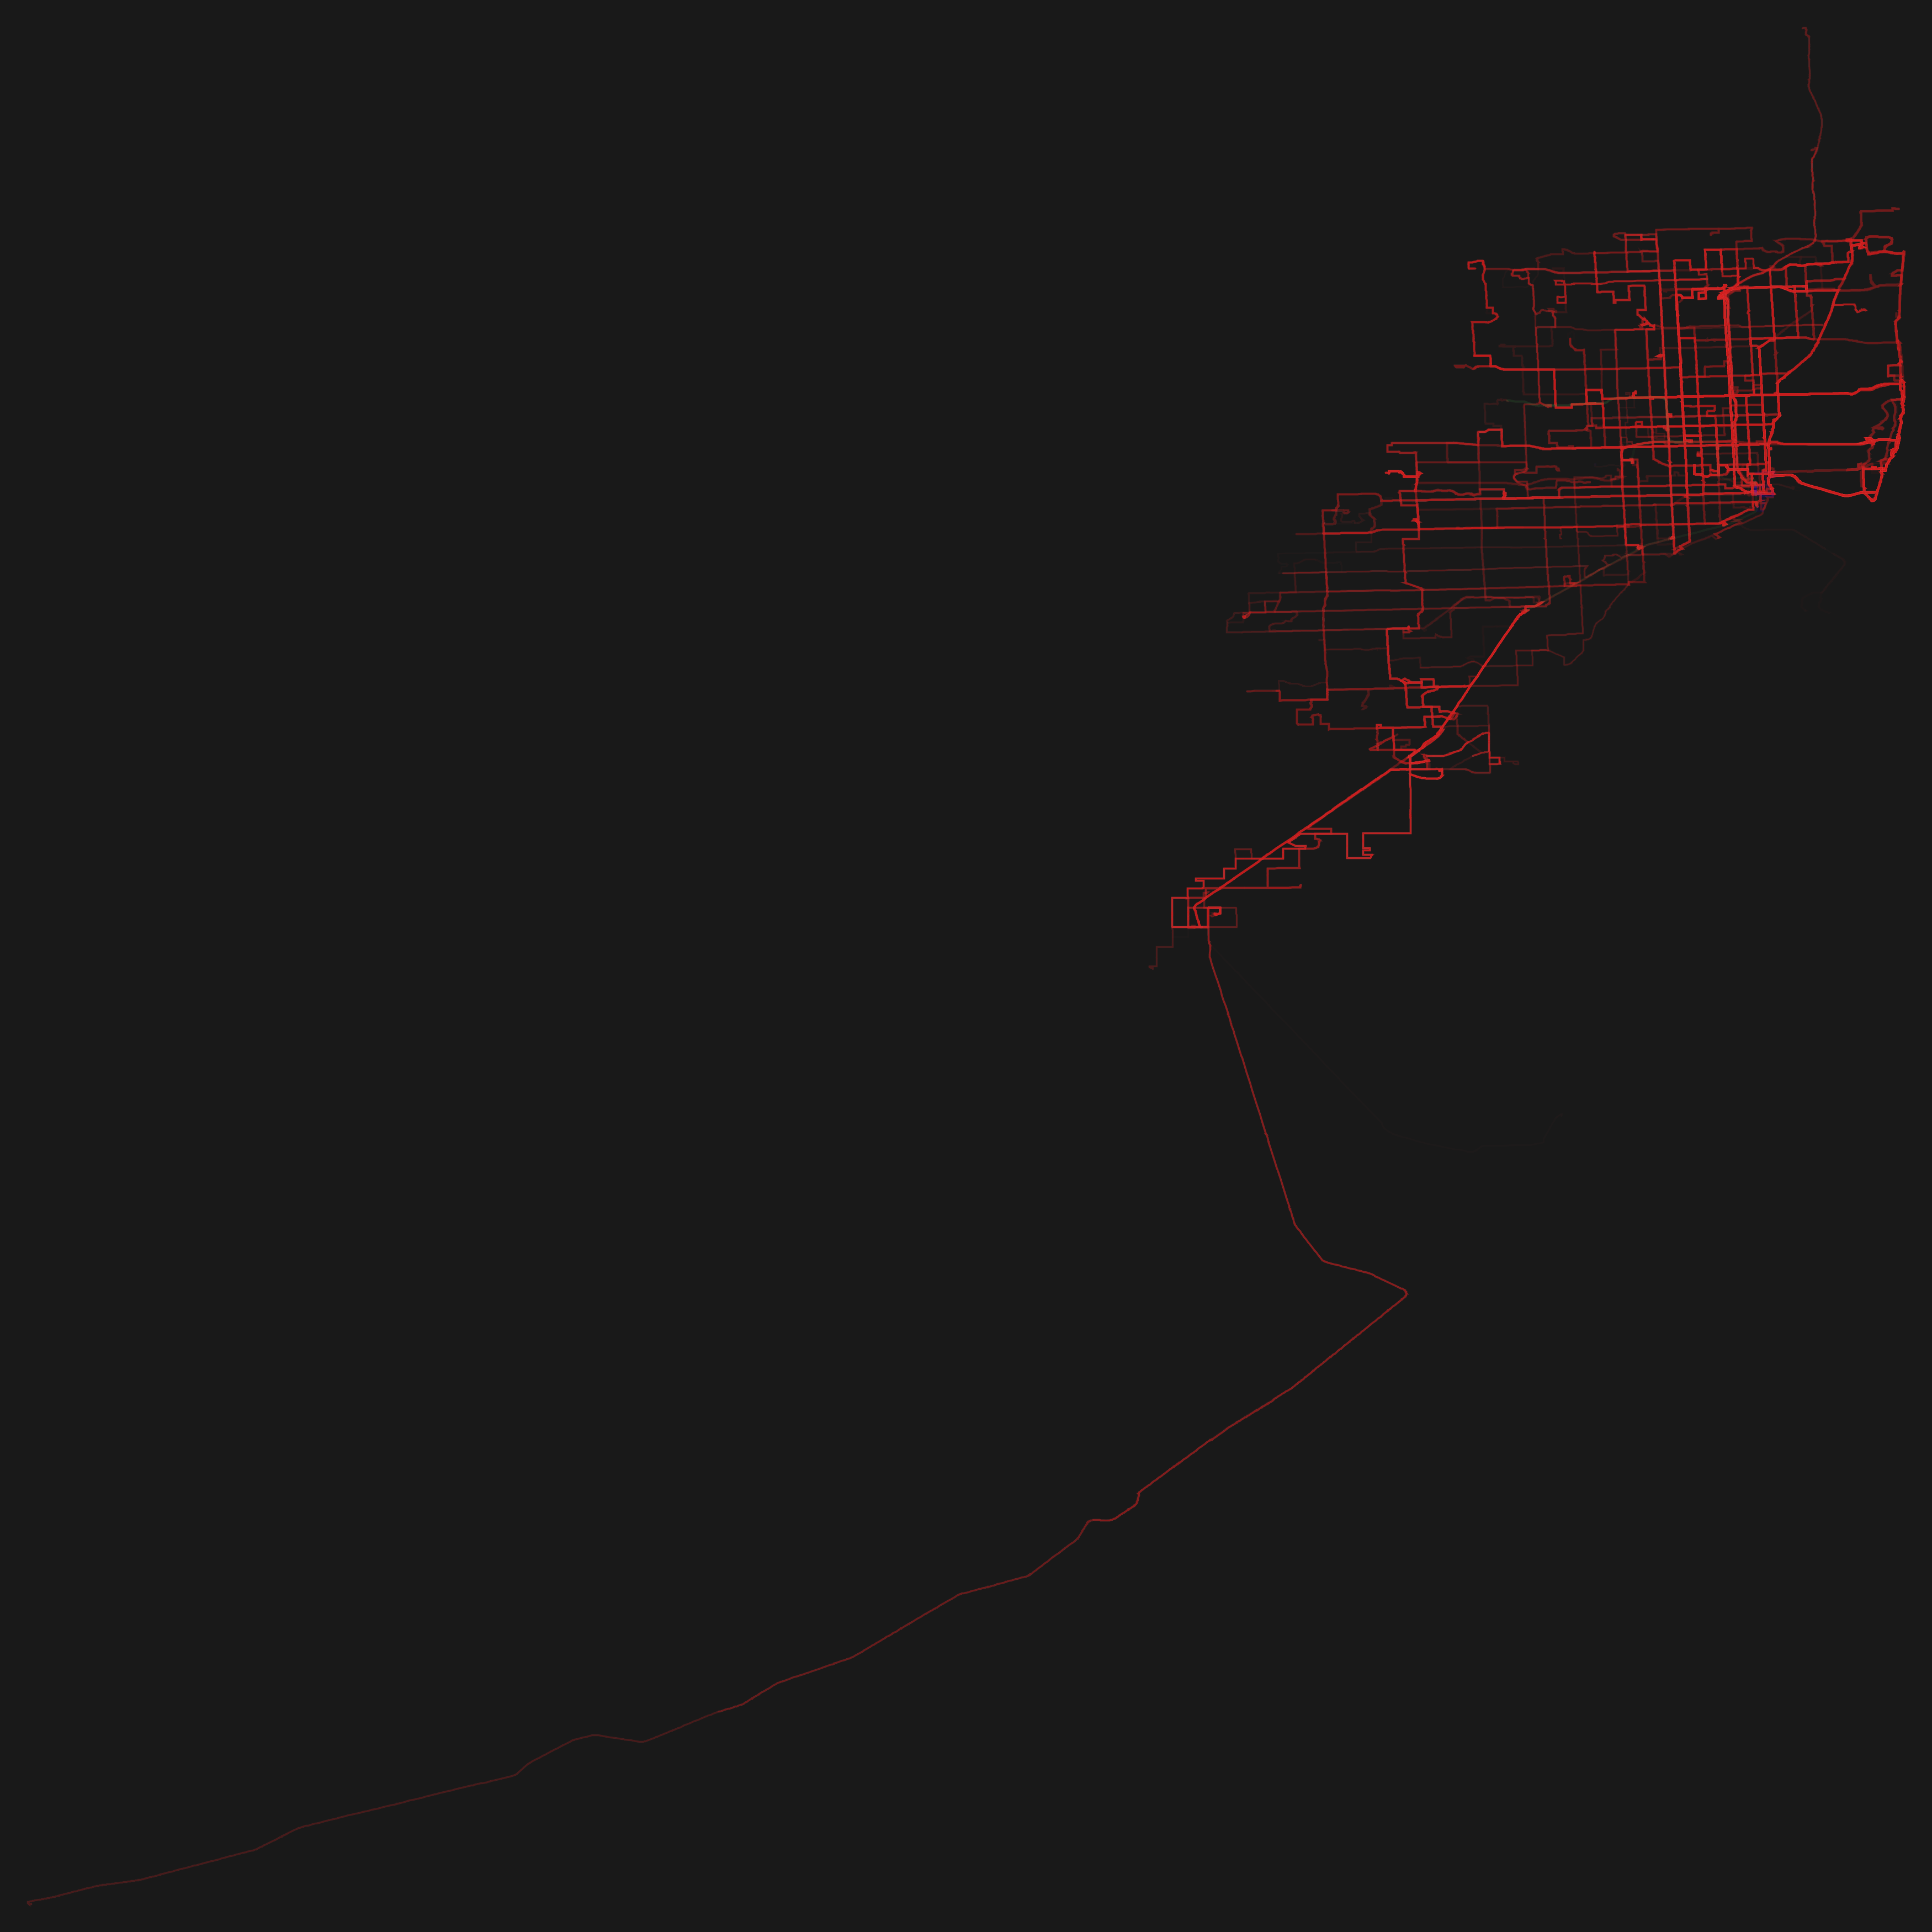
The idea of this project is to generate beautiful and informative visualizations from publicly available GTFS datasets. The program draws the routes which transportation entities take and emphasizes the ones which are frequented more often by painting them thicker and in a stronger opacity.
The thickness and color intensity of the drawn lines is chosen using
log(trips_happening_on_this_shape_id). All trips in the GTFS feed
are counted (not just days or a week).
How to generate a visualization.
The currently colors used are:
tram                    #0000ff	blue
subway, metro           #00ff00	green
rail, inter-city        #ffff00 yellow
bus                     #ff0000 red
ferry                   #00ffff cyan
cable car               #fee0d2 ocker
gondola                 #ff00ff purple
funicular               #ffffff white

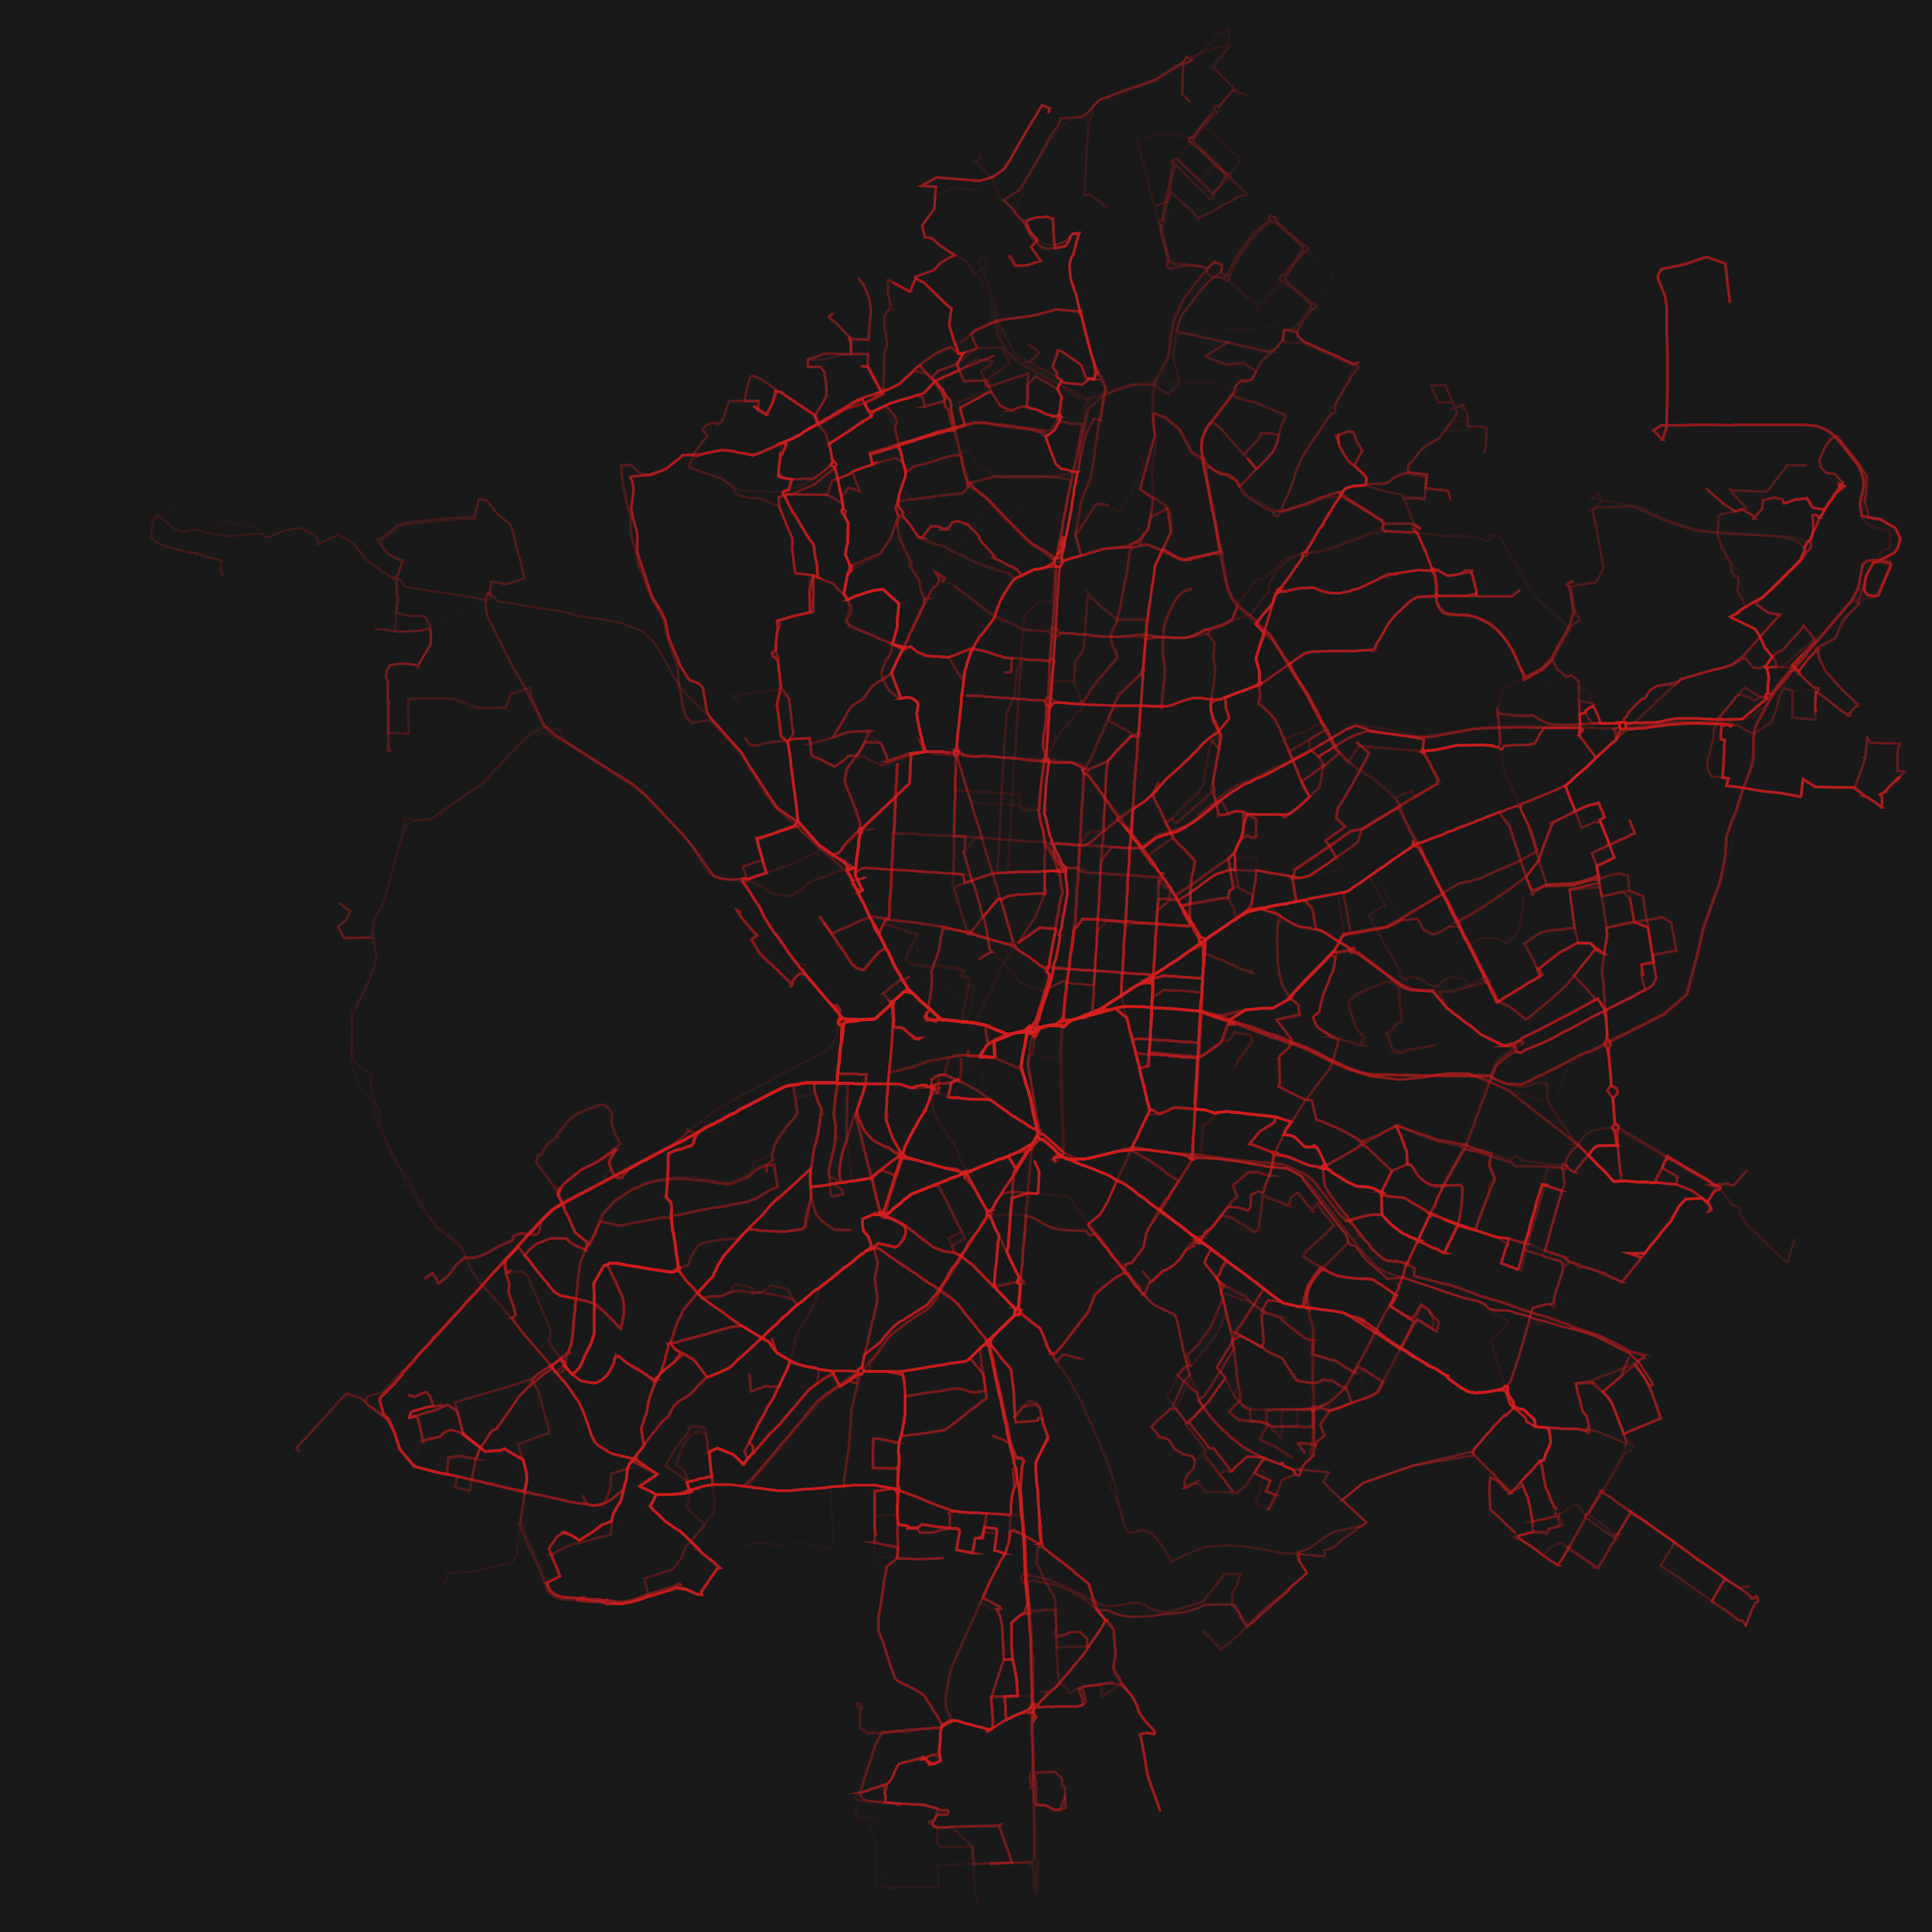
Rendering based on an unofficial GTFS feed. There is an official one available, though it does (not yet?) include shapes.
Download: Large PNG (0.4 MB), PDF (0.12 MB)

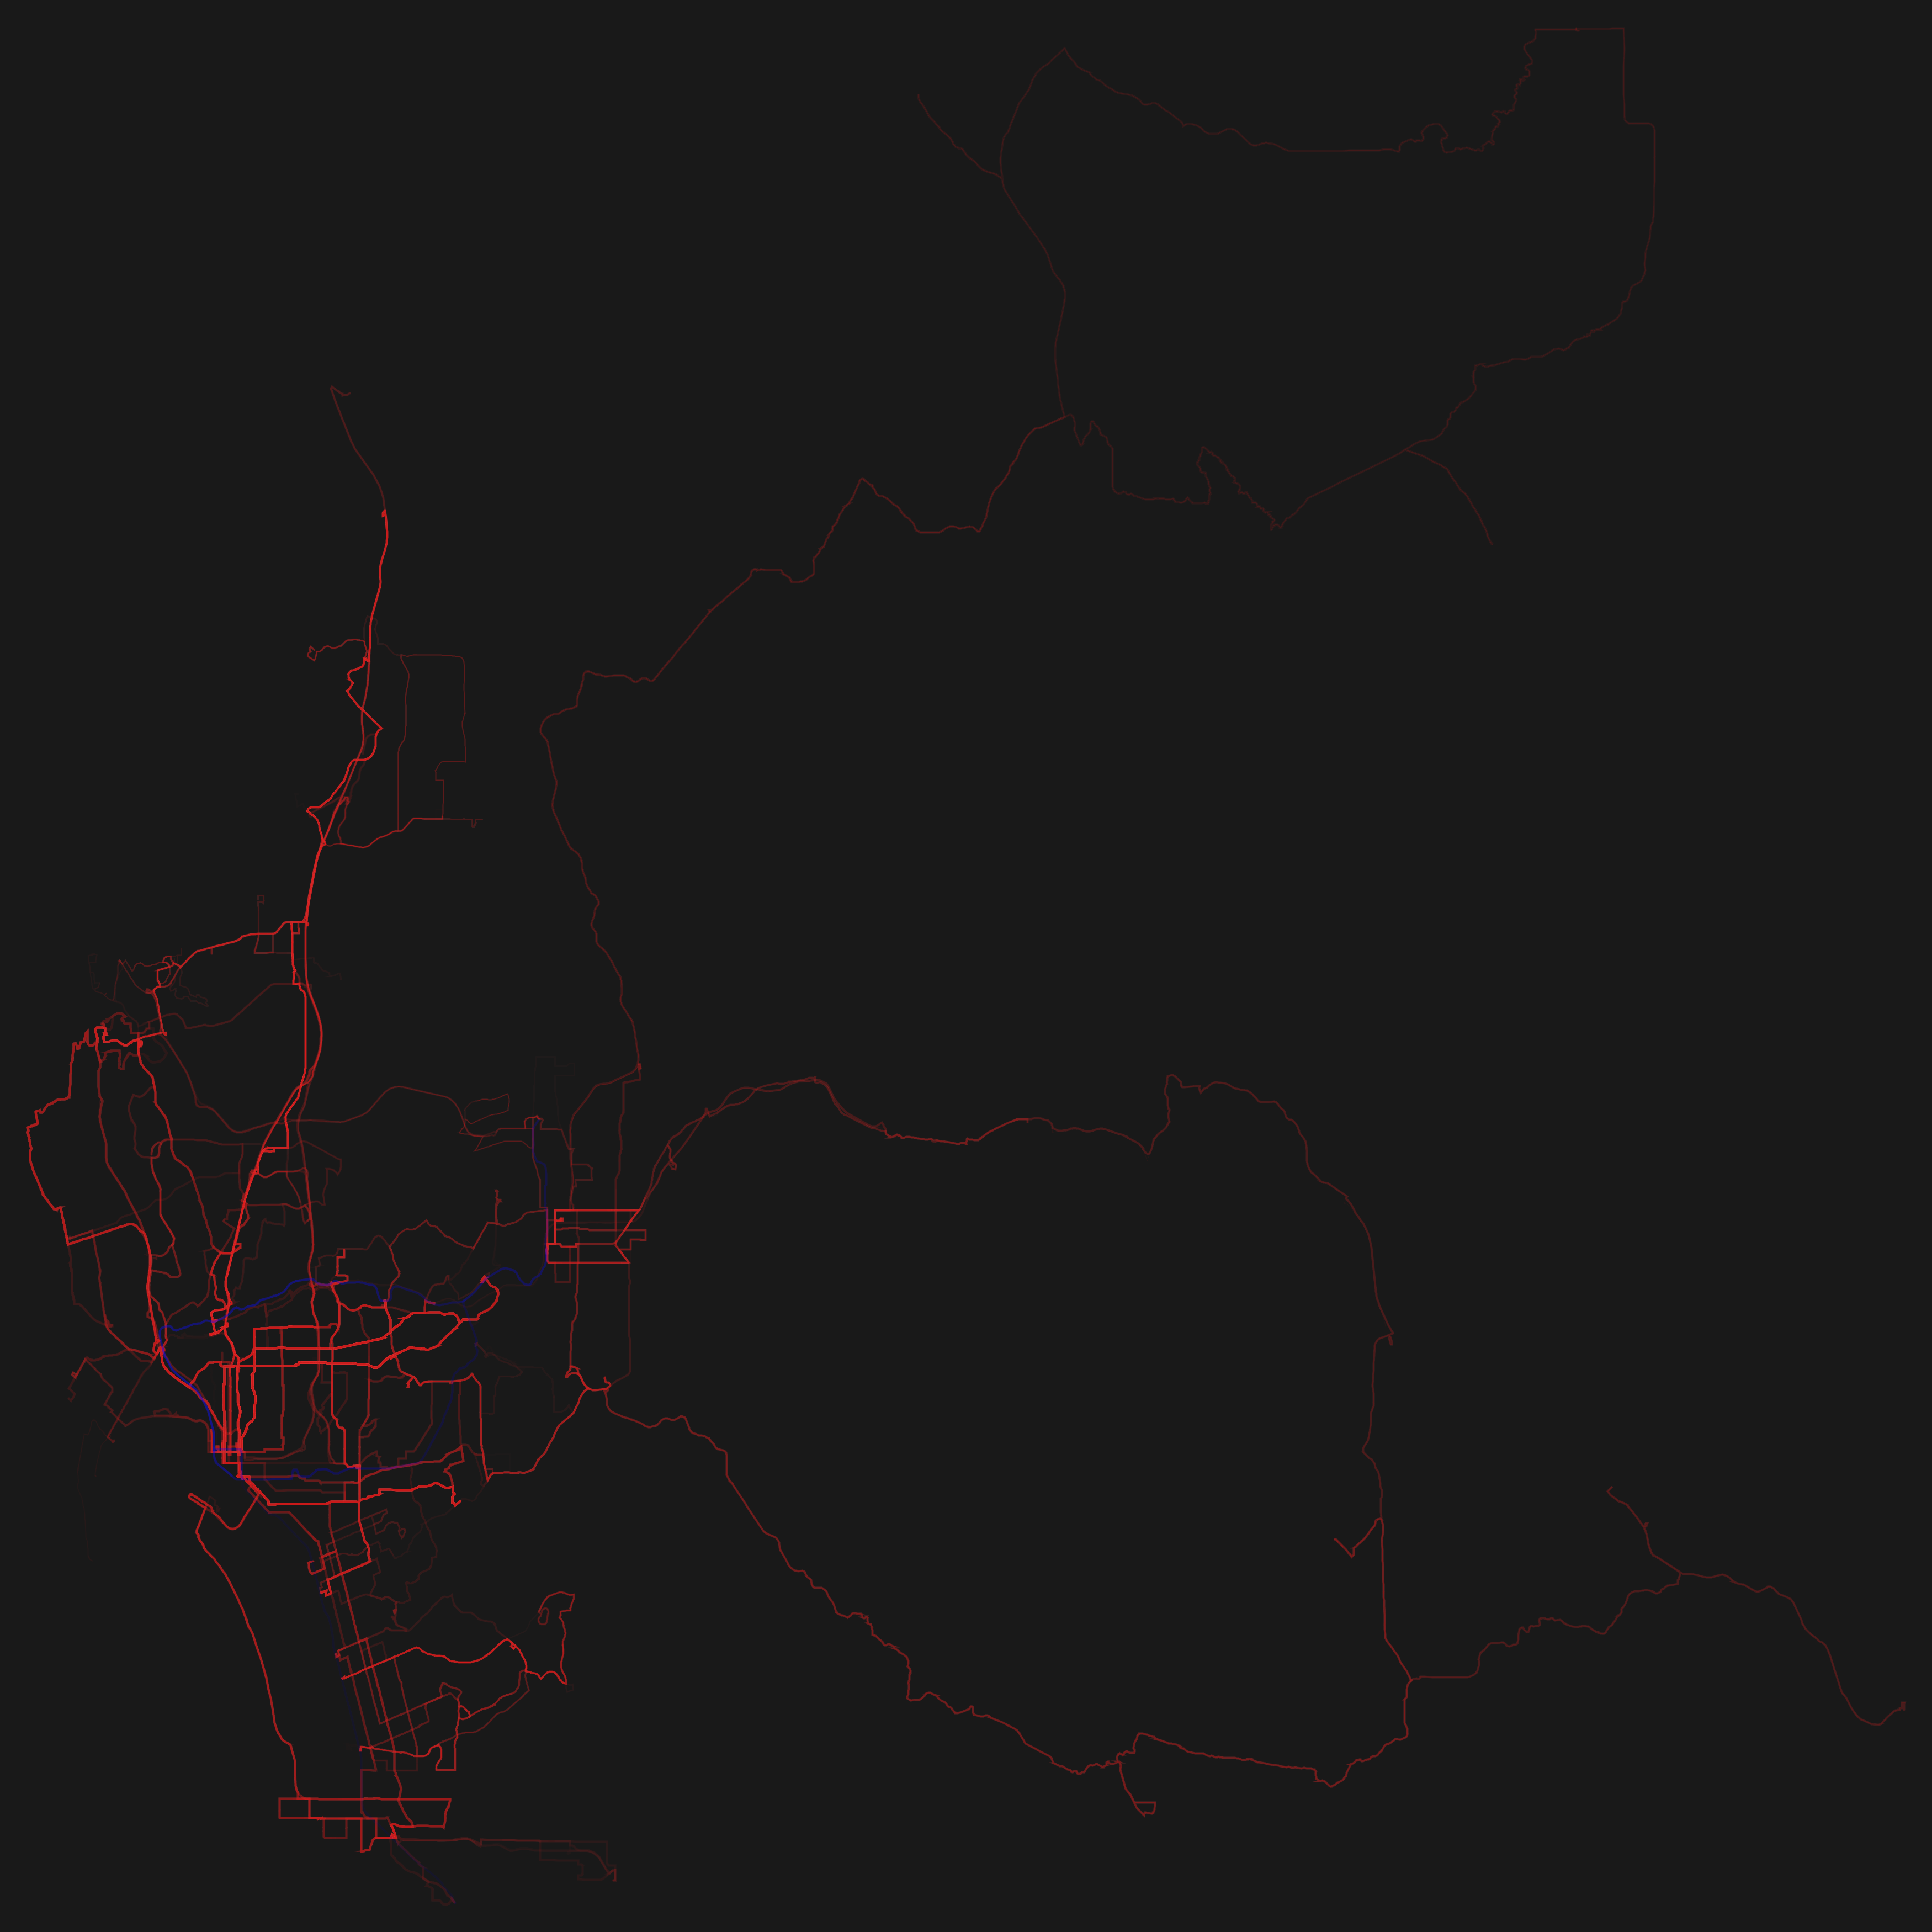
Rendering based on the official feed by the Empresa Municipal de Transportes. (March 12, 2014)
Download: Large PNG (1.4 MB), PDF (0.4 MB)

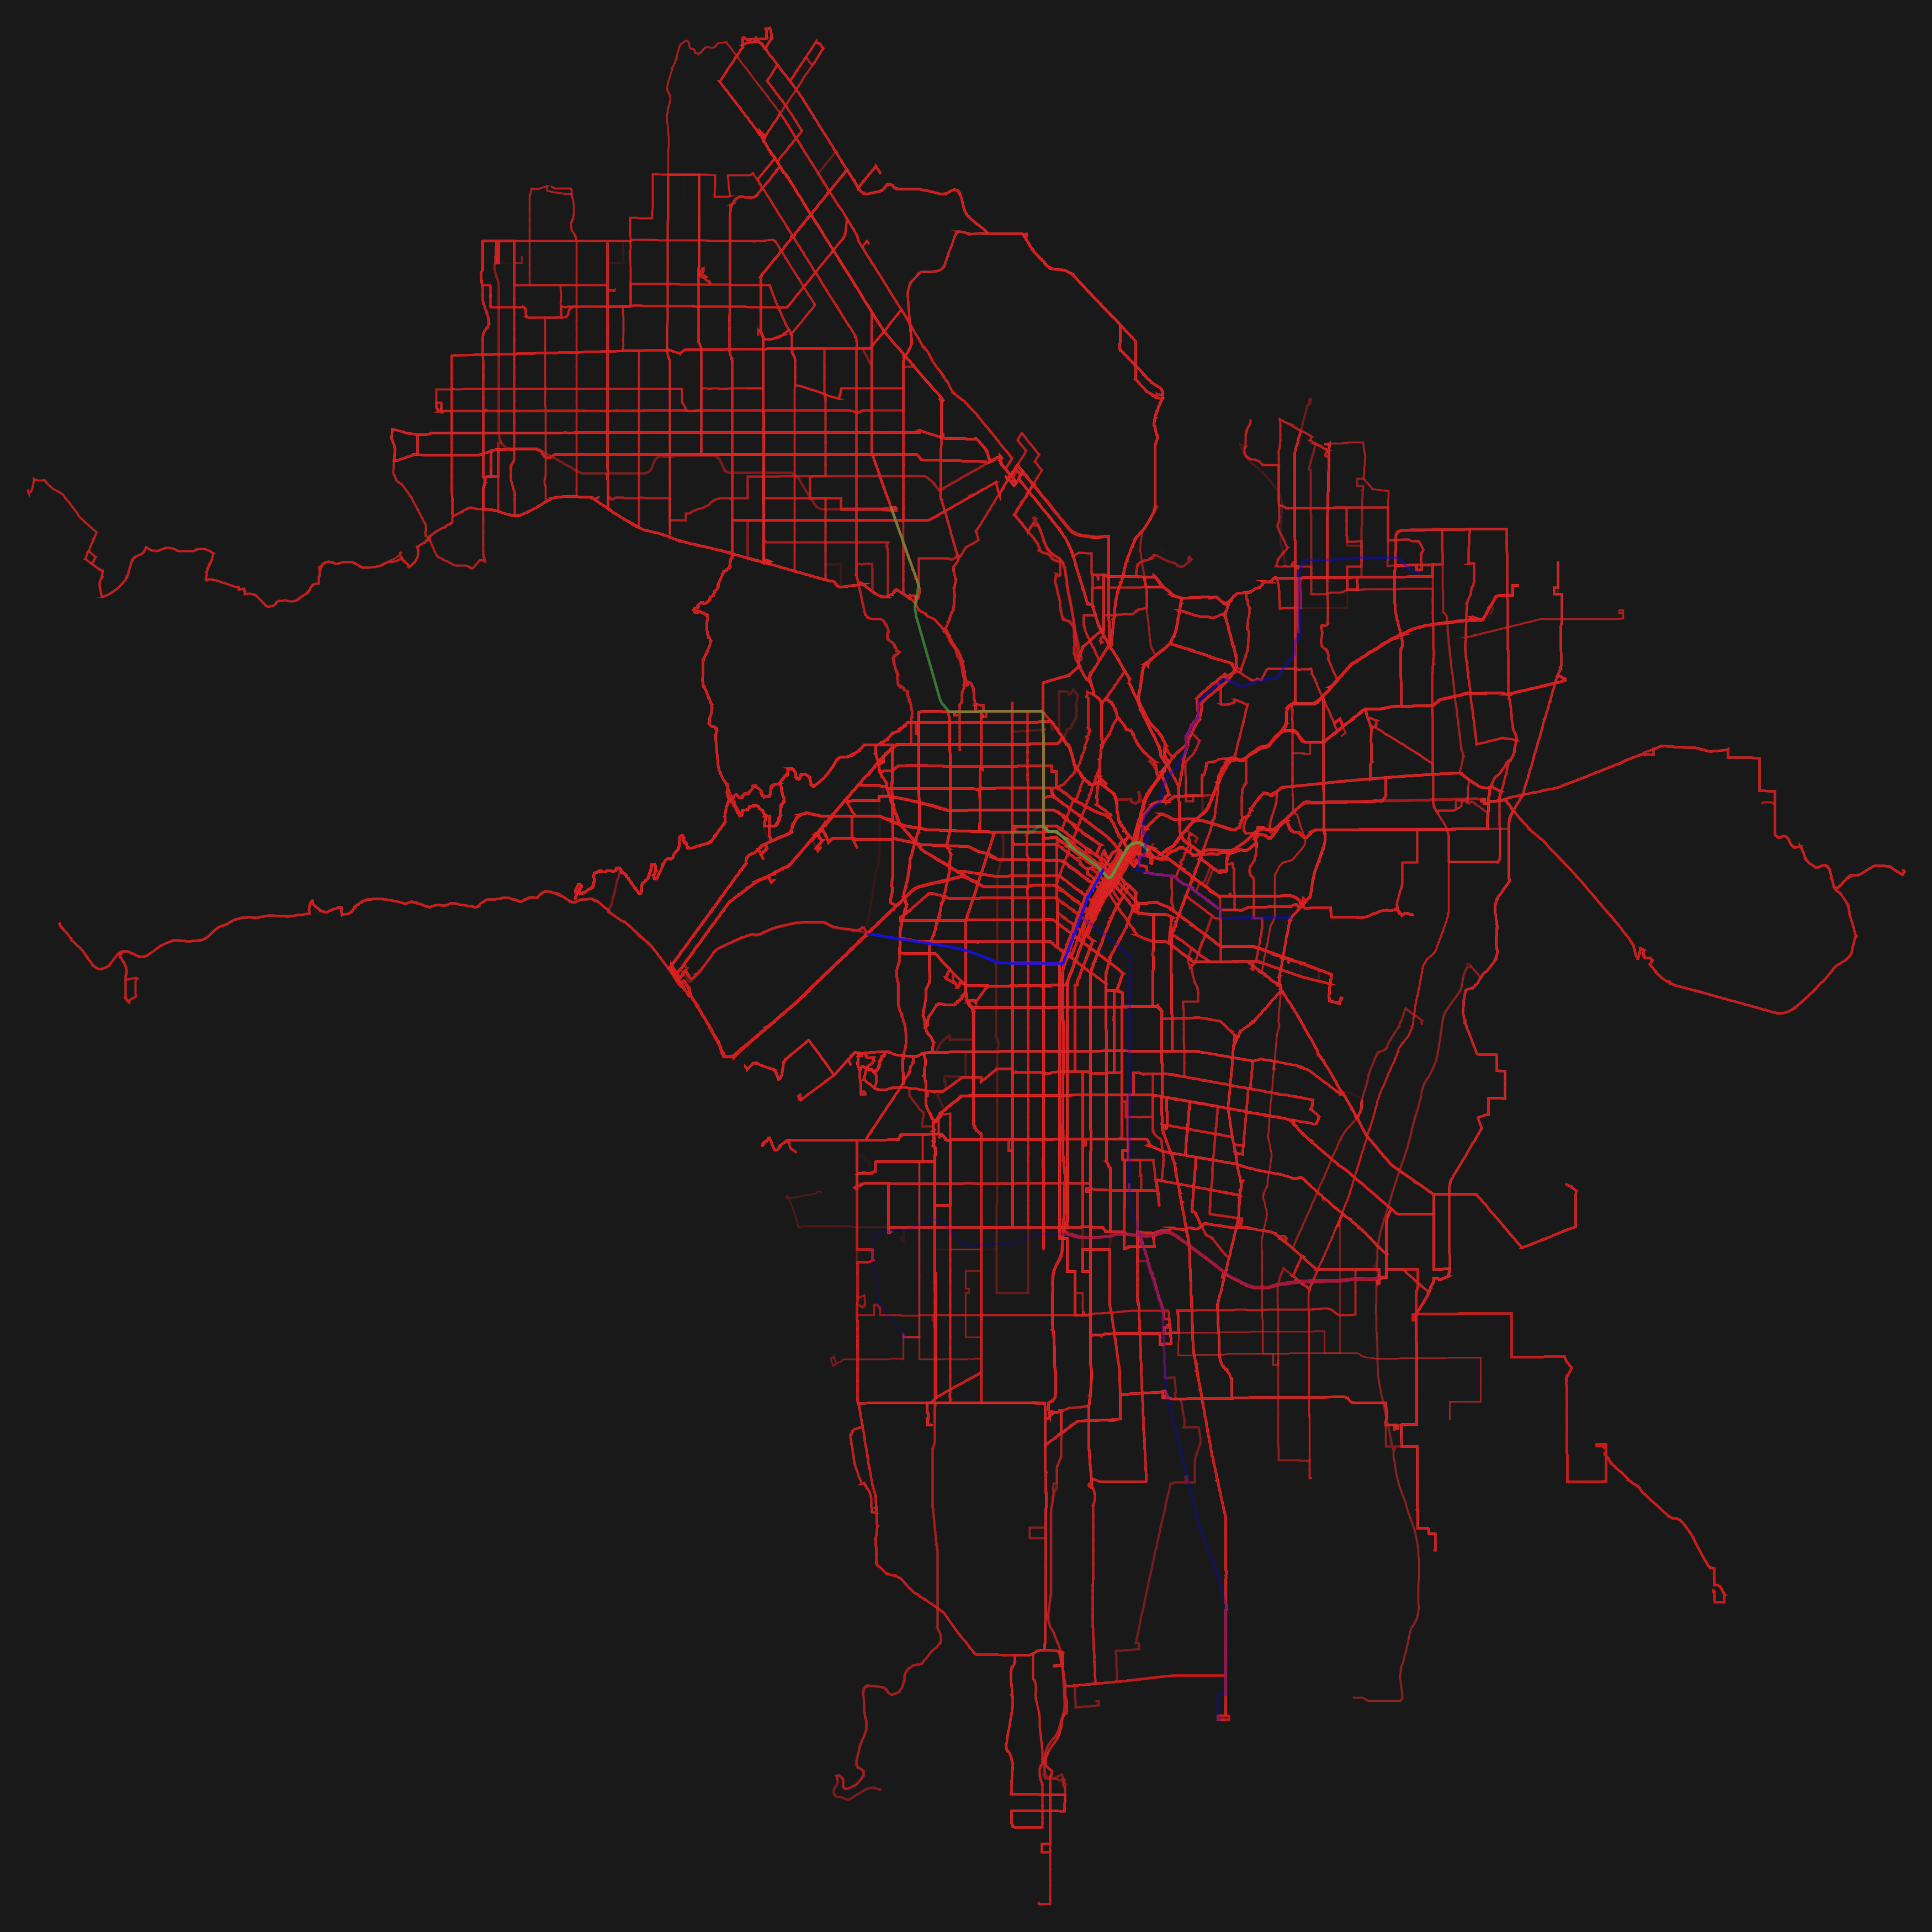
Rendering based on the official feed by the Metropolitan Transit System (MTS). (March 12, 2014)
Download: Large PNG (0.5 MB), PDF (0.6 MB)

Rendering based on the official feed by the Los Angeles County Metropolitan Transportation Authority. (March 14, 2014)
Download: Large PNG (0.9 MB),

Rendering based on the official feed by the San Francisco Municipal Transportation Agency. (March 12, 2014)
Download: Large PNG (1 MB), PDF (1.1 MB)
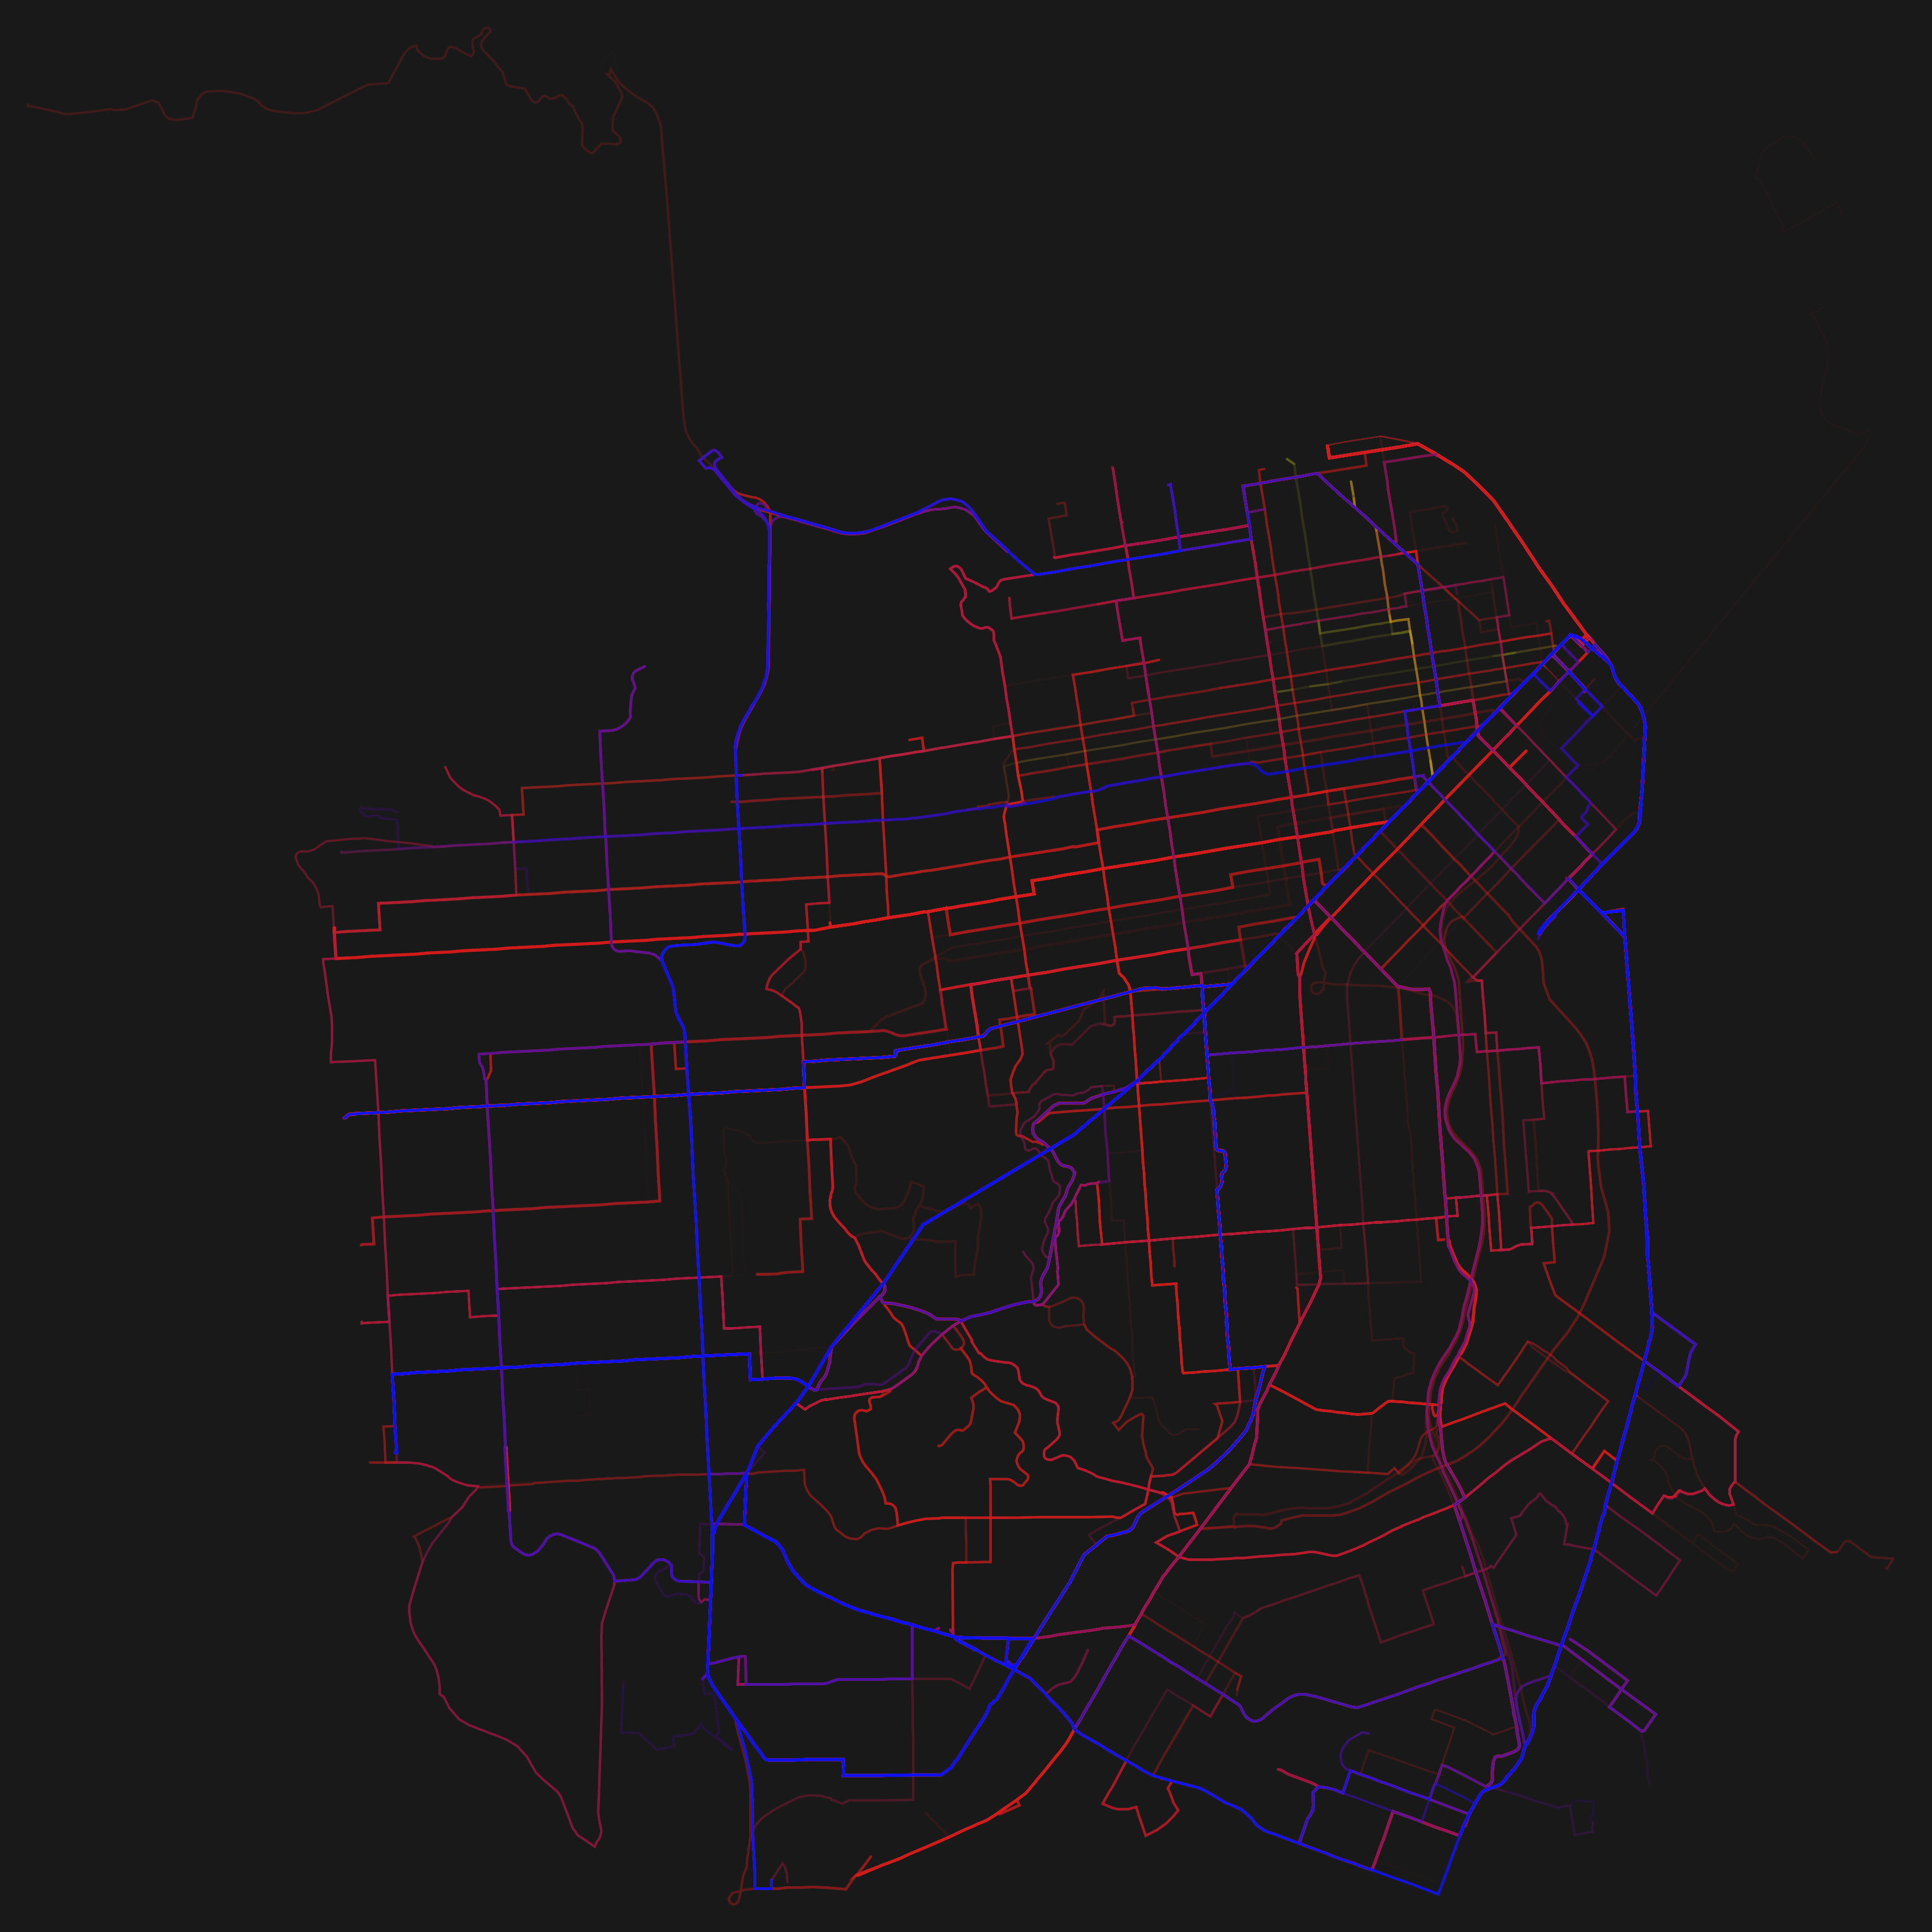

Rendering based on the official feed by DC Circulator. (March 13, 2014)
Download: Large PNG (1.2 MB)

Rendering based on the official feed by the Miami Dade Transit. (March 13, 2014)
Download: Large PNG (0.3 MB), PDF (0.12 MB)
I think the visualizations look quite beautiful and have started to
compile a series of A0 posters. Click on the preview image to open
the PDF. The templates can be found in ./posters/.


Click on the images to get a larger preview.
Download and install node.js and npm.
$ git clone https://github.com/cmichi/gtfs-visualizations.git
$ cd gtfs-visualizations/
$ npm install
For help, run:
$ node render.js --help
For example:
$ time node render.js --verbose --gtfs=vilnus --poster --max-dist=20 --center=54.6824461,25.2748482
Based on the GTFS files in ./gtfs/vilnus/ this will generate:
./output/vilnus/data.lines

./output/vilnus/maxmin.lines
# contains the maximum and minimum count of trips on a shape
# in this GTFS feed
Download Processing 2.0.
Install processing-java from the Tools menu.
Then run:
processing-java --sketch=$PWD/processing --run vilnus poster
Adjust with the size argument.
See the sketch ./processing/processing.pde and search this block:
drawRoute("7", #ffffff); // funicular
drawRoute("6", #ffffff); // gondola
drawRoute("5", #ffffff); // cable car
drawRoute("4", #ffffff); // ferry
drawRoute("3", #ff0000); // bus
drawRoute("2", #ffffff); // rail, inter-city
drawRoute("1", #ffffff); // subway, metro
drawRoute("0", #0000ff); // tram
These are the default colors used. You are free to adapt them.
-
The green and red color combination should be done better (persons with red/green disabilities might have problems). Use other color scheme.
-
GTFS provides a field
route_color. Supporting this would be nice. Colors right now are hardcoded.
The gallery photos are licensed under the Creative Commons Attribution
4.0 International license: http://creativecommons.org/licenses/by/4.0/.
Copyright (c) 2013-2014

	Michael Mueller <http://micha.elmueller.net/>


Copyright (c)

	Roman Prokofyev <http://prokofyev.ch/>

Permission is hereby granted, free of charge, to any person obtaining
a copy of this software and associated documentation files (the
"Software"), to deal in the Software without restriction, including
without limitation the rights to use, copy, modify, merge, publish,
distribute, sublicense, and/or sell copies of the Software, and to
permit persons to whom the Software is furnished to do so, subject to
the following conditions:

The above copyright notice and this permission notice shall be
included in all copies or substantial portions of the Software.

THE SOFTWARE IS PROVIDED "AS IS", WITHOUT WARRANTY OF ANY KIND,
EXPRESS OR IMPLIED, INCLUDING BUT NOT LIMITED TO THE WARRANTIES OF
MERCHANTABILITY, FITNESS FOR A PARTICULAR PURPOSE AND
NONINFRINGEMENT. IN NO EVENT SHALL THE AUTHORS OR COPYRIGHT HOLDERS BE
LIABLE FOR ANY CLAIM, DAMAGES OR OTHER LIABILITY, WHETHER IN AN ACTION
OF CONTRACT, TORT OR OTHERWISE, ARISING FROM, OUT OF OR IN CONNECTION
WITH THE SOFTWARE OR THE USE OR OTHER DEALINGS IN THE SOFTWARE.