
US Firework Sales and Injuries (Part 1) - Cleaning
US Firework Sales and Injuries (Part 2) - Data Analysis
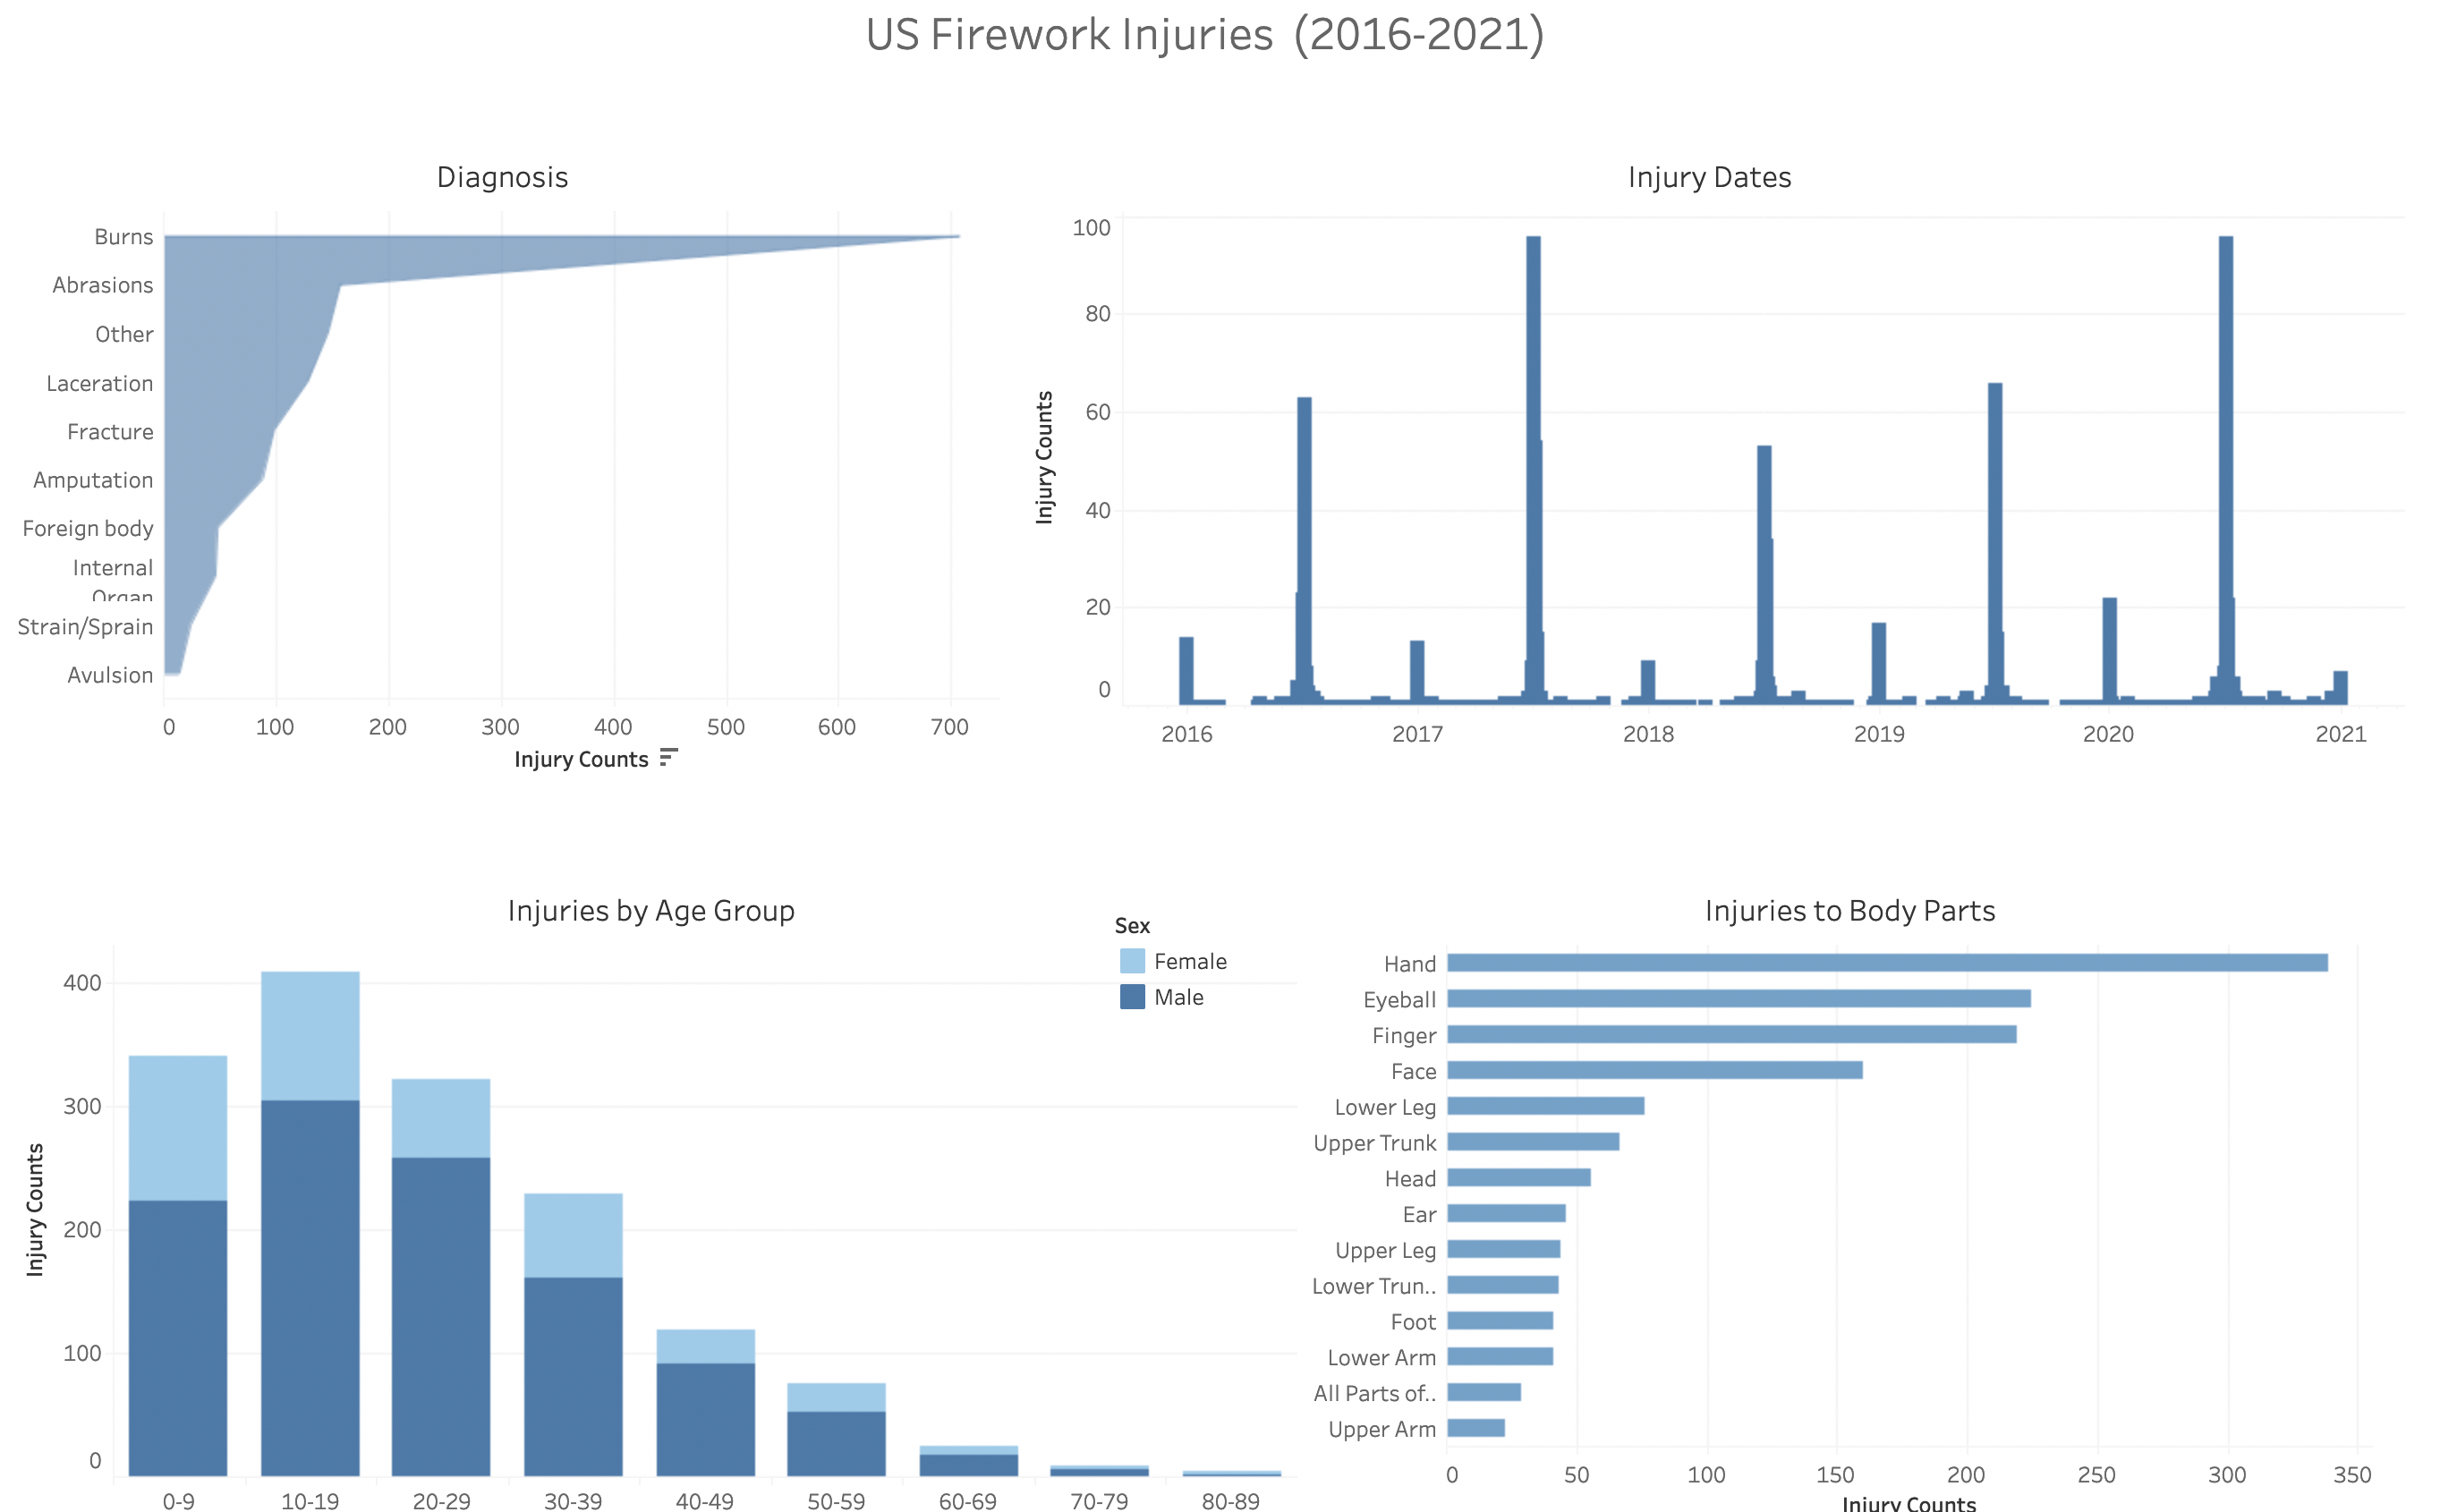
Tableau Dashboard for Fireworks Inuries (2016-2021)
-
Provide an overview of incidents that involve fireworks.
- Injury frequencies by date
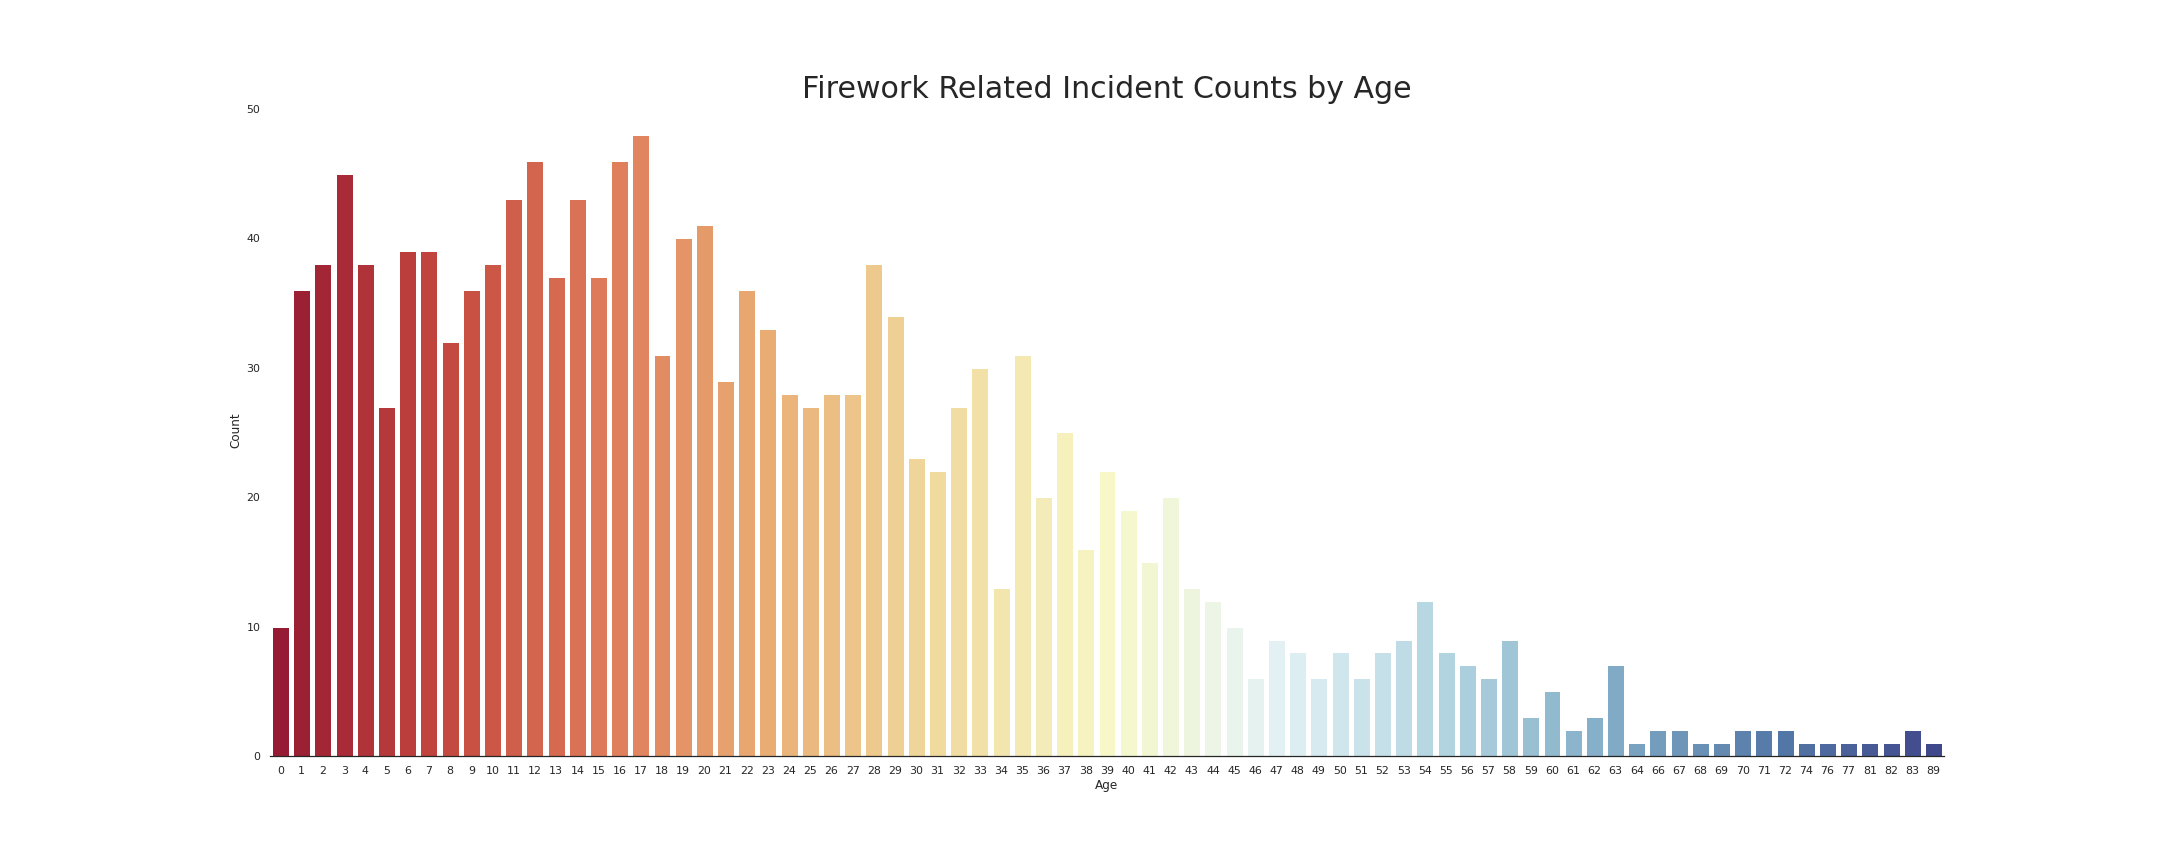
- Age Group(s) most affected
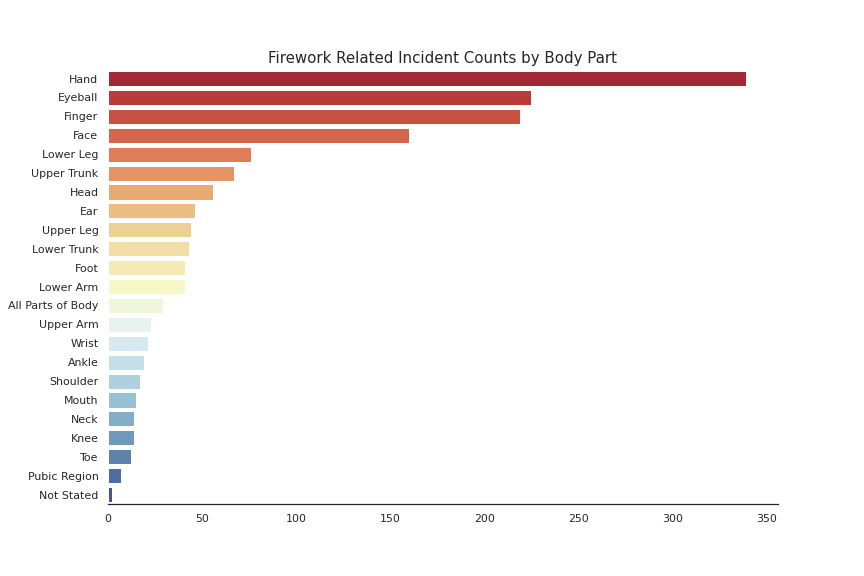
- Frequency of injury type(s)
-
Provide sales figures for fireworks across the US.
- State sales totals by year
- World sales of fireworks (top 10)
Age group of 0-20 showed the highest rate of injury.
Injuries to the hands, face, and eyes were the most common, while injuries to lower extremities were less common.
Missouri held the record for most spent on fireworks (over 250 million dollars over the past 5 years).
%202016-2020%20(map).png)
-
Consisted multiple excel incident reports involving fireworks over the past 5 years taken from the U.S. Consumer Product Safety Commission (CPSC).
NEISS injury data are gathered from the emergency departments (ED) of 96 hospitals selected as a probability sample of all U.S. hospitals with 24-hour EDs and at least 6 inpatient beds. Each participating NEISS hospital is hand-selected by CPSC because it provides an important representation of all other hospitals of its size and unique characteristics in the U.S.
-
Sales and Trade data each state regarding fireworks. Reports data range from 2016 to April 2021.