"A graphical user interface for people who hate graphical user interfaces"
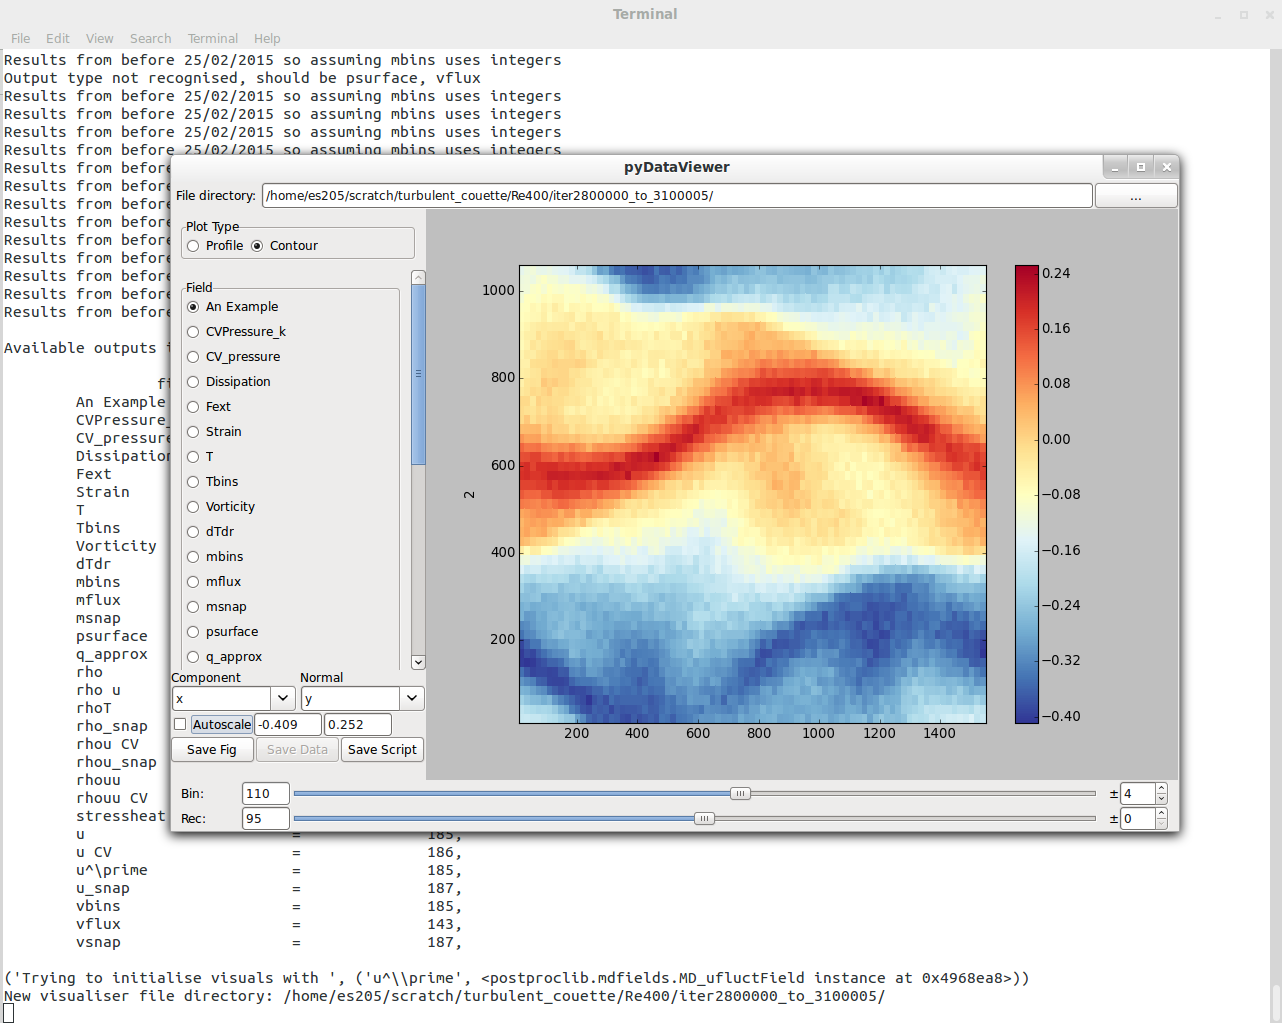
If you know how to read your data by writing Python code, PyDataView simply provides a way to quickly explore the data with a slider/file viewer. Once you see something you like, click Save Script to generate a starting point for further analysis.
A Data Viewer GUI written in python, wxpython and matplotlib.
This is a lightweight interface for quick insight into scientific data. Data can be explored as a matplotlib lineplot or contour using sliders to traverse the range of existing records and bins. For more detailed analysis, a figure can be saved, the data output as a csv file or a minimal python script generated. The emphasis of this project is the provision of a simple reader to get data into python, a minimal GUI to get quick insight into that data and generation of python scripts for more detailed analysis.
On linux, you need Python3, numpy, scipy, wxpython, matplotlib and vispy installed. You can then clone the repository and run pyDataView from the command line,
python3 pyDataView.py -d ./path/to/dir
Choosing the path to point it at directory which contains the data.
A version is available from the Python package manager with a command of the form,
pip install pyDataView
This should create an entry point so you can use the GUI with a command of the form
pyDataView
Any files which can be converted to fields are displayed on the left hand side.
You can also use the entire library of data reading functions in Python scripts, e.g.
import postproclib as ppl

fdir = "/path/to/directory/with/data/"
PPObj = ppl.All_PostProc(fdir)
print(PPObj)
which will print any data found in the directory. The dataformats can be ouput from molecular dynamics simulations such as Flowmol (binary format MPI/Fortran) or LAMMPS (ascii format) as well as CFD codes such as OpenFOAM (uniform grids only) or ChannelFlow (h5 format). The found data will be listed as a Dictonary of plottypes which can be plotted as follows,
#Get plotting object
plotObj = PPObj.plotlist['mbins']

#Get profile
x, y = plotObj.profile(axis=normal,
      startrec=startrec,
      endrec=endrec)

#Plot only normal component
fig, ax = plt.subplots(1,1)
ax.plot(x,y[:,component])
plt.show()
If the code/datatype is already supported, all available data should be displayed.
pyDataView uses fields of five dimensional data: three spatial, one temporal and one for dimensionality of data.
As well as the raw data fields, derived fields are also supported, for example, dividing momentum by density to get velocity.
If you use Windows, a pre-compiled executable using pyinstaller is available
- Action Autobuild (latest version) here
- Stable download here (Built 01/12/23)
One of the main aims of pyDataView is to make it easy to add new readers.
In order to add new datatypes, the user must create a raw data reader in newreader.py,
from rawdata import RawData

class SomeNewReader(RawData):

    def __init__(self,fdir,fname,dtype,nperbin):
        if (fdir[-1] != '/'): fdir += '/'
        self.fdir = fdir
        self.fname = fname
        self.dtype = dtype
        self.nperbin = nperbin
        self.filepath = self.fdir + self.fname + '/'
        self.header = self.read_header(fdir)  #The user should write these
        self.grid = self.get_gridtopology()   #The user should write these
        self.maxrec = self.get_maxrec()

    def read(self, startrec, endrec):

        # Read a 5D array [nx, ny, nz, nperbin, nrecs]
        # where nrecs=endrec-startrec+1 and nperbin is 1 for scalar field
        # and 3 for vector field, etc

        return bindata
To use this raw data, a field datatype can then be added to newfield.py,
from field import Field
from newreader import SomeNewReader

class SomeNewVectorField(Field):

    dtype = 'd'
    nperbin = 3

    def __init__(self,fdir):
        Raw = SomeNewReader(fdir, self.fname, self.dtype,
                         self.nperbin)
        Field.__init__(self,Raw)
        self.header = self.Raw.header
        self.axislabels = ['x','y','z']
This field type can now be called in any python script, allowing 5D data fields to be read as well as data preparation for plots, including profiles, contours, fft, etc. To add these new fields to the GUI, they should be added to newpostproc.py
from postproc import PostProc
from newfield import SomeNewVectorField

class New_PostProc(PostProc):

    def __init__(self,resultsdir,**kwargs):
        self.resultsdir = resultsdir
        self.plotlist = {}

        possibles = {'New Field': SomeNewVectorField}

        self.plotlist = {}
        for key, field in possibles.items():
            try:
                self.plotlist[key] = field(self.resultsdir)
            except AssertionError:
                pass
which must be instantiated in allpostproc.py allowing pyDataView to find and display the new field format.
There are many examples of different data formats in the postproclib file which can be used as a template.