[Metricbeat] Add statistic method into configuration for aws module #12370
Comments
|
After discussing with @exekias , we think it will be good to support both statistic methods and a list of metric names that user wants to collect. Please correct me if I'm wrong 😬 I just realized I didn't update this right after our meeting. So my memory is a little fuzzy now 😅 |
|
that sounds good to me! I'm wondering now, if you can provide several Statistic methods, how will the metric names end up looking? Does it make sense to require several satistics for the same metric? |
|
@exekias Good point, I didn't think about changing names. I was thinking just add a field name in the event called To the question of if it's useful, I think if we support Should we only make this available on |
|
that sounds good to me |
|
Yay, I will move this issue to ready then 👍 Thank you for all the great ideas/discussions! |
|
just checking:
|
|
will it be possible to supply a list of statistic methods? without it, you'd need a config block for each statistics function, right? |
|
@roncohen Right now we are only hardcoding the statistic method for each metricset. I just find the default one statistic method from AWS Cloudwatch for each metricset because I was worries about how many metrics we will be reporting if default is for all statistic method. But I do agree, if default to be all statistic method, then it will give users the best out of the box experience. For supporting a list of statistic_methods with |
|
I guess retrieving all methods by default is ok for
If we go down this path, I'm also +1 to allowing defining a list of aggregations for
I don't think this is fully described anywhere, maybe you saw https://www.elastic.co/guide/en/beats/devguide/current/event-conventions.html (let's open a separate PR to add this maybe?). In any case, I think that's the notation we normally use, so appending As a note, this will be a breaking change, but should be ok as |
|
Oh no... breaking change...! But since |
|
We try to keep them to a minimum, but do them if needed. It is ok to to this kind of changes to a Beta module. I would say it's a requirement before moving this metricset to GA |
|
Sorry for coming back to this one, but this is also relevant in the context of ongoing Azure monitor design. I really hope we can agree on a common settings layout for both AWS cloudwatch and Azure monitor metricsets. Each one has different naming (ie AWS uses the term statistic, while Azure uses aggregation), I think we should probably respect that but keep the same layout for settings. So far we have these concepts (I'm keeping AWS terminology for this issue): Namespace - the root for a group of metrics Our last proposed layout has the drawback of repeating the namespace when we want a different set of statistics depending on the metric, we could do a different grouping to solve that: We could also decide that namespace is tied to the metricset like this: I'm leaning towards this last example, as we plan to use this metricset as an input for lightweight modules, where normally a single namespace is required. If needed, you can always create several instances of the module for different namespaces. Any opinions? Do you expect several namespaces being needed when monitoring a single cloud service (AWS ELB, Azure API Management, etc)? In all cases this would return in documents looking like this: cc @narph, would love your input here too |
|
@exekias The only thing I can think of regarding to "Do you expect several namespaces being needed when monitoring a single cloud service" is: when users monitoring their EC2 instances, they might be interested in both AWS/EC2 namespace as well as the AWS/RDS or AWS/EBS at the same time. But as you said, since users can always create more instances of the cloudwatch metricset for different namespaces, I think the second option will work. |
|
@exekias , there is a notable difference between the azure monitor and aws cloudwatch configuration and that is the resources that have to be identified before listing the namespaces. AWS does not have that. Are we final on the document format returned? The metric name is "Percentage CPU" and the aggregations selected are max, avg, min. |
|
Thank you both for the answers
From your examples it would seem that for each resource filter you always use the same namespace, which probably makes sense. Perhaps resource filter and namespace should have a 1:1 mapping? That would mean the namespace is defined at the same level where you define the resource filter.
+1
Having the aggregation as a suffix or subdocument makes no difference for Elasticsearch, so your document looks good to me! I've updated my example to avoid confusion, as implementation wise, this is easier. |
|
@exekias How about we remove the |
|
We have done this kind of namespacing ( It seems that in Azure, in some cases, multiple namespaces may be needed. For instance to retrieve custom metrics along with VM metrics in Azure: MicrosoftDocs/azure-docs#28457. So I would say the safe play is doing this for AWS: And figure out Azure afterwards, as it may be different (to be seen) |
Yes, so it seems that users can create and send the custom metrics themselves using the following methods to Azure Monitor.
and I could already see the added metric namespace to my resource: I was then able to retrieve the metrics specified: So a resource can allow multiple namespaces. |
|
Thank you for sharing @narph! So it seems clear that there are some differences between Azure and AWS, we should not try to force the same config. That said, I see an opportunity for a more similar layout, from your example: WDYT? |
|
sounds good, looks more compact already |
Looking at various statistic method that AWS supports on their dashboards made me start thinking it might be useful to add a config option into aws module for different statistic methods when querying cloudwatch metrics. Currently in aws module, for each metricset, there is a default/hardcoded statistic method. If we make this configurable, users would have more flexibility to query metrics and the aws module itself will behave more similar to Cloudwatch itself.
With statistic method option, the config for aws module will look like:
Two problems here:
If we do allow multiple methods, then same metrics will be reported multiple times with different statistic methods applied.
Also we need to consider if the code should treat the config example above same as the config below (how to make Cloudwatch query more efficient that way).
For

NumberOfMessagesSent, it's usingSumby default:For
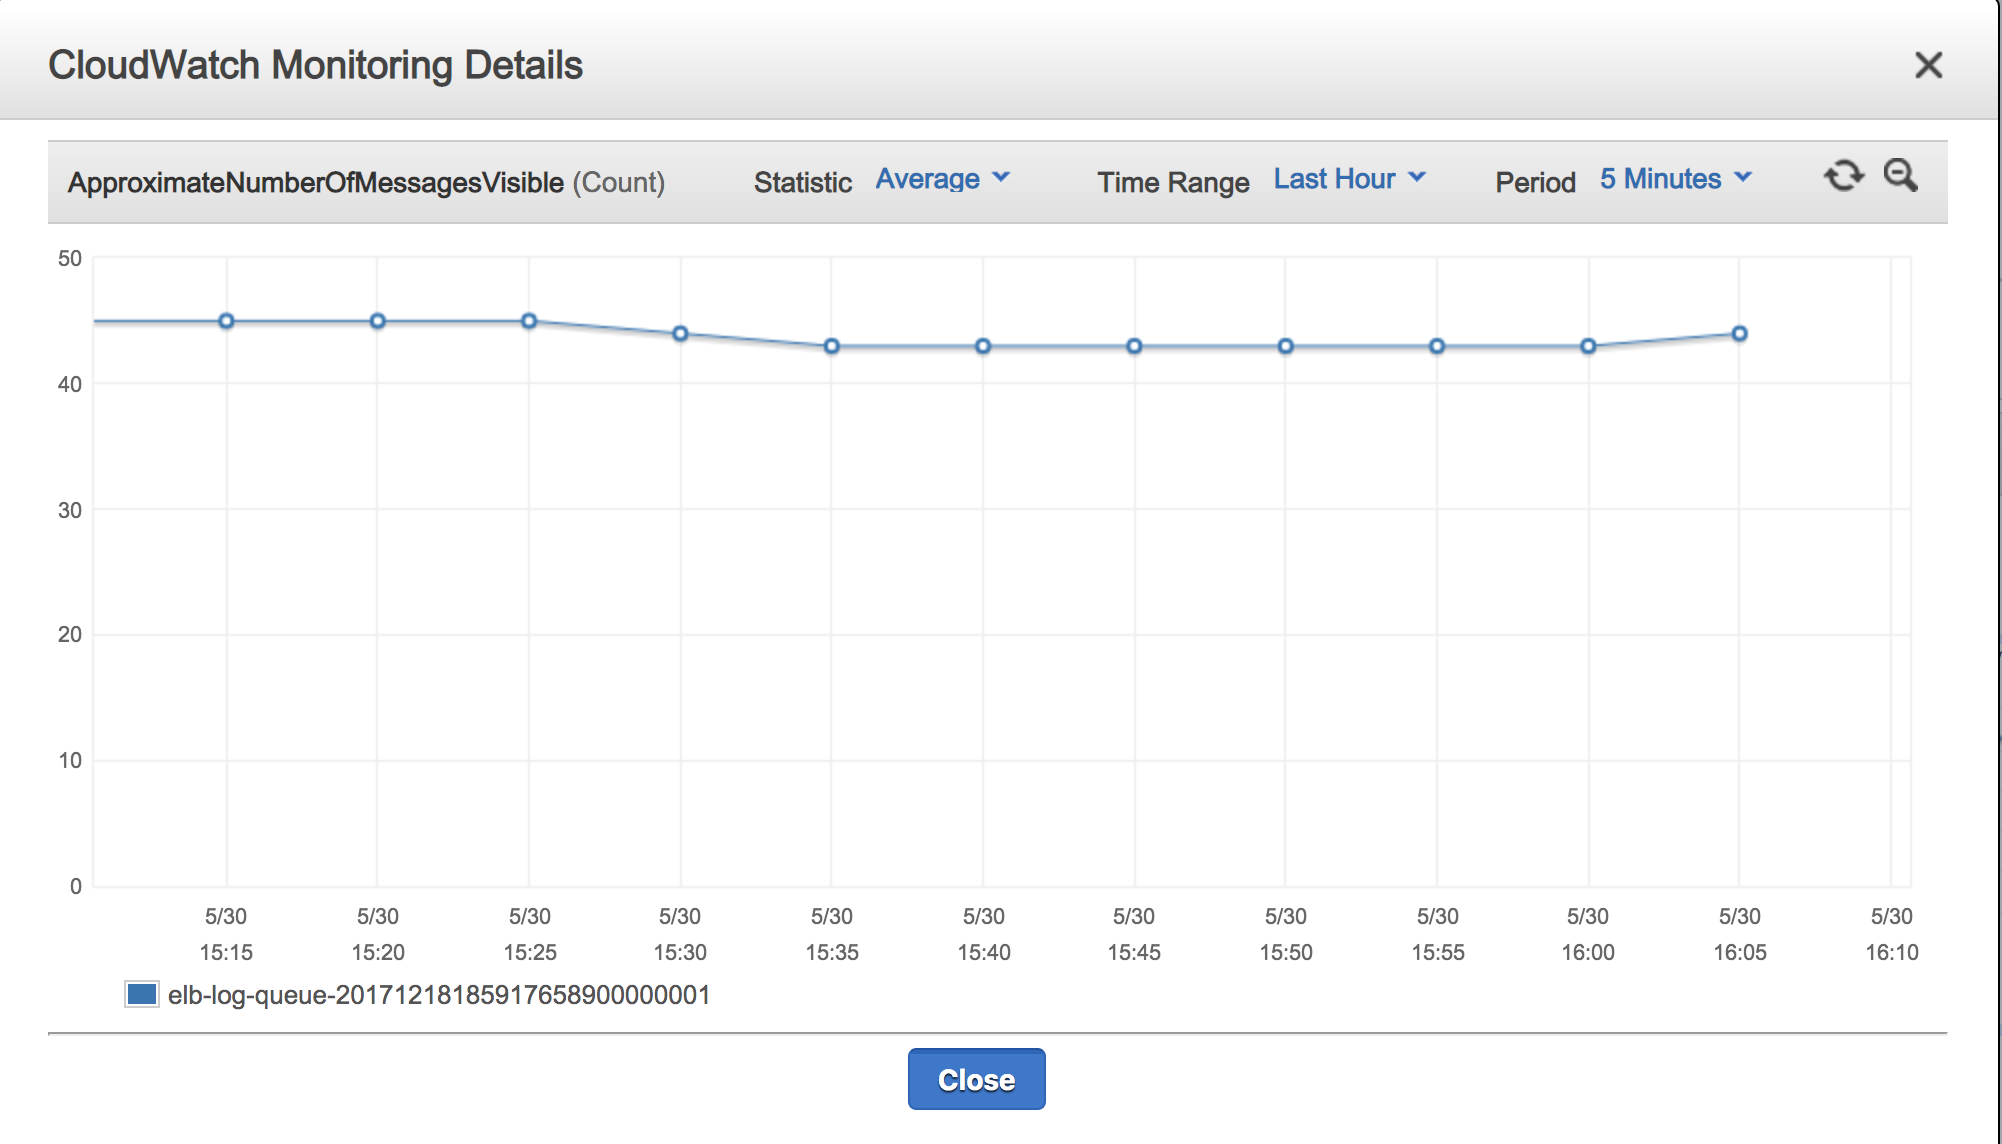
ApproximateNumberOfMessagesVisible, it's usingAverageby default:This problem is the main thing that's stopping me from implementing: the ability to specify different statistic methods for different metrics in the same metricset.
The text was updated successfully, but these errors were encountered: