PHASE 1 PROJECT Using Exploratory Data Analysis (EDA) to Generate Insights for a Business Stakeholder.
Microsoft Corporation is a multinational technology company founded by Bill Gates and Paul Allen on April 4, 1975 with a significant influence on the global software and technology industry. Microsoft operates in various domains and offers a wide range of products and services. Here are some key domains and products associated with Microsoft: Microsoft Windows OS is one of the most well-known products in this domain. Office Productivity Suite with applications like Microsoft Word, Excel, PowerPoint, and Outlook, that are used for personal and business settings. Microsoft Azure is Microsoft's cloud computing platform, providing a range of services such as virtual machines, databases, AI, and machine learning tools, as well as infrastructure for building, deploying, and managing applications through Microsoft's global network of data centers. Microsoft SQL Server is a popular relational database management system used by businesses for data storage and retrieval. Visual Studio is a widely-used integrated development environment (IDE) for creating applications for Windows, web, cloud, and mobile platforms. GitHub, a platform for hosting and collaborating on software development projects, was acquired by Microsoft in 2018. Microsoft produces hardware products like the Surface line of laptops and tablets, Xbox gaming consoles, and accessories. Microsoft owns the search engine Bing and provides online services like Outlook.com and OneDrive for email and cloud storage, respectively.
Responding to the growing trend by major companies producing original video contents, Microsoft corporation seeks to establish its own movie studio. This initiative Is aimed to place Microsoft as a competitor in the digital content market. The establishment of a digital movie studio by Microsoft also aligns with the corporation’s vision to diversify its revenue collection ,expand its influence and leverage its technological expertise .
In recent years, the digital content space has undergone much change. There is an increase in the streaming platforms, that has resulted to a diverse consumer habits and the positive impact on tech corporations joining the content production domain and reshaping the industry. In response, Microsoft has identified an opportunity to expand its revenue streams and expand its influence within the digital content market. Some of the cons of venturing in this market are : The digital content market is competitive with established entities therefore Microsoft must make its content stand out in the saturated space The success of Microsoft in the digital content market also depends on the quality they will deliver . For success in this field Microsoft will need to be consistent in producing quality content that resonates with the consumers. The dynamic nature of the market as well affects the consumer behavior due to dynamic technologies therefore continuous innovation and successful adapting of new technologies will help Microsoft to remain competitive in the digital content market. On the pros side Microsoft will be able to diversify their revenue income by monetizing the content, subscriptions and partnerships. This will help Microsoft establish new revenue streams. This will also enhance the brand as it will put Microsoft in the innovative space that resonates with the audiences thus strengthening the brand influence. This will also place Microsoft in a postion to contribute to the market share by positioning it as a key player alongside established competitors. To help Microsoft solve this problem, I will find out the following : How many movies are being made of each genre? What genres are the most successful, that is in terms of audience rating and gross earnings? 3. Which genres are most successful in terms of gross i.e. with the highest gross earnings?
The main Objectives are :-
- To determine the optimal genre (s) produced for each genre.
- To find the genres with highest earnings and highest audience ratings in the movie market.
- To determine Which Genres Are Financially Successful by highest gross earnings.
- The data is sourced from three reputable movie industry datasets: IMDb, The Movie Database, and Box Office Mojo. These sources are known for their reliability in providing movie-related information.
- Time Period: The data covers the years 2012 and 2018, providing a snapshot of the movie industry during that specific time frame.
- Data Types: The dataset includes a mix of data types, including numerical and categorical data. Numerical data includes ratings, earnings, and counts. Categorical data includes genres and movie titles.
- Data Volume: The volume of data was varying depending on the specific dataset and source. It includes information on multiple movies produced during the specified time frame.
- Data Structure: The data is structured in tabular form, typically with rows representing individual movies and columns representing attributes such as titles, genres, ratings, earnings, and release dates.
- Data Completeness: Data completeness was varying, and some datasets had missing values. Handling missing data was necessary during data preprocessing.
- Data Exploration: Exploratory Data Analysis (EDA) techniques were used to understand data distributions, identify patterns, and visualize relationships within the data.
- Data Relationships: The data allowed for the exploration of relationships between variables, such as the relationship between movie genres, ratings, and earnings.
- Data Analysis Tools: Data analysis tools and libraries, such as Python with Pandas, NumPy, Matplotlib, and Seaborn, were used to explore and analyze the data.
Univariate EDA focused on examining individual variables to understand their distributions, central tendencies, and variability.
- Histograms and Distributions: Plotted histograms for numerical variables like ratings and earnings to visualize their distributions. To observe the shape of the distribution and check for normality.
- Frequency Counts: Created bar plots for categorical variables like genres and count the frequency of each category. To determine the most common genres and their prevalence in the dataset.
Bivariate EDA explores relationships between pairs of variables to uncover patterns and correlations.
- Scatter Plots: Created scatter plots to examine relationships between numerical variables, such as ratings and earnings. Used them to assess whether there is a linear or non-linear relationship between these variables.
- Box Plots: Constructed box plots to compare the distributions of numerical variables across different categories. For example, compare earnings for different genres to identify variations in box office performance.
- Correlation Analysis: Calculated correlation coefficients to quantify the strength and direction of relationships between numerical variables. Visualized correlations using a correlation matrix.
Based on the analysis and conclusions drawn from the data used in my analysis, here are some recommendations for Microsoft Corporation as they enter the movie production market:
Microsoft should Consider Investing in Adventure Movies as the data suggests that adventure movies, on average, received high ratings and generated substantial earnings. Microsoft may want to consider producing adventure films as part of their movie lineup.
They should Focus on High-Quality Content, genres like Adventure, Action, Sci-Fi, and Comedy received high average ratings. Microsoft should prioritize creating high-quality content within these genres to attract and retain audiences.
Invest in Sci-Fi and Fantasy Genres as both had high average ratings and significant earnings per movie. Microsoft may find it lucrative to explore these genres in their film production endeavors.
Action and Adventure genres dominated in terms of total gross earnings. Consider allocating resources to produce movies in these genres, as they have a proven track record of success at the box office.
The analysis is based on data from 2017-2018. Microsoft should continuously monitor market trends and audience preferences to stay up-to-date with changing tastes and adjust their production strategies accordingly.
While the number of adventure movies was relatively low, their quality and earnings were high. Microsoft should prioritize producing fewer high-quality movies rather than flooding the market with a large quantity of films.
Engage with the audience and gather feedback to understand their preferences and expectations. Building a strong relationship with the audience can lead to more successful films.
Consider collaborating with experienced directors, producers, and writers in the industry to leverage their expertise and enhance the quality of movie production.
Develop effective marketing and distribution strategies to ensure that the movies reach their target audience and maximize box office earnings.
While the analysis points to specific genres, it's essential to maintain a diverse portfolio of movie genres to cater to a broad audience. Don't limit to one genre alone.
It's important to note that the movie industry is highly competitive and subject to evolving trends. Microsoft should conduct thorough market research, stay flexible, and adapt to changing market dynamics to increase their chances of success in the movie production business.
You've made it all the way through the first phase of this course - take a minute to celebrate your awesomeness!

Now you will put your new skills to use with a large end-of-Phase project!
In this project description, we will cover:
- Project Overview: the project goal, audience, and dataset
- Deliverables: the specific items you are required to produce for this project
- Grading: how your project will be scored
- Getting Started: guidance for how to begin your first project
For this project, you will use exploratory data analysis to generate insights for a business stakeholder.
Microsoft sees all the big companies creating original video content and they want to get in on the fun. They have decided to create a new movie studio, but they don’t know anything about creating movies. You are charged with exploring what types of films are currently doing the best at the box office. You must then translate those findings into actionable insights that the head of Microsoft's new movie studio can use to help decide what type of films to create.
In the folder zippedData are movie datasets from:
Because it was collected from various locations, the different files have different formats. Some are compressed CSV (comma-separated values) or TSV (tab-separated values) files that can be opened using spreadsheet software or pd.read_csv, while the data from IMDB is located in a SQLite database.
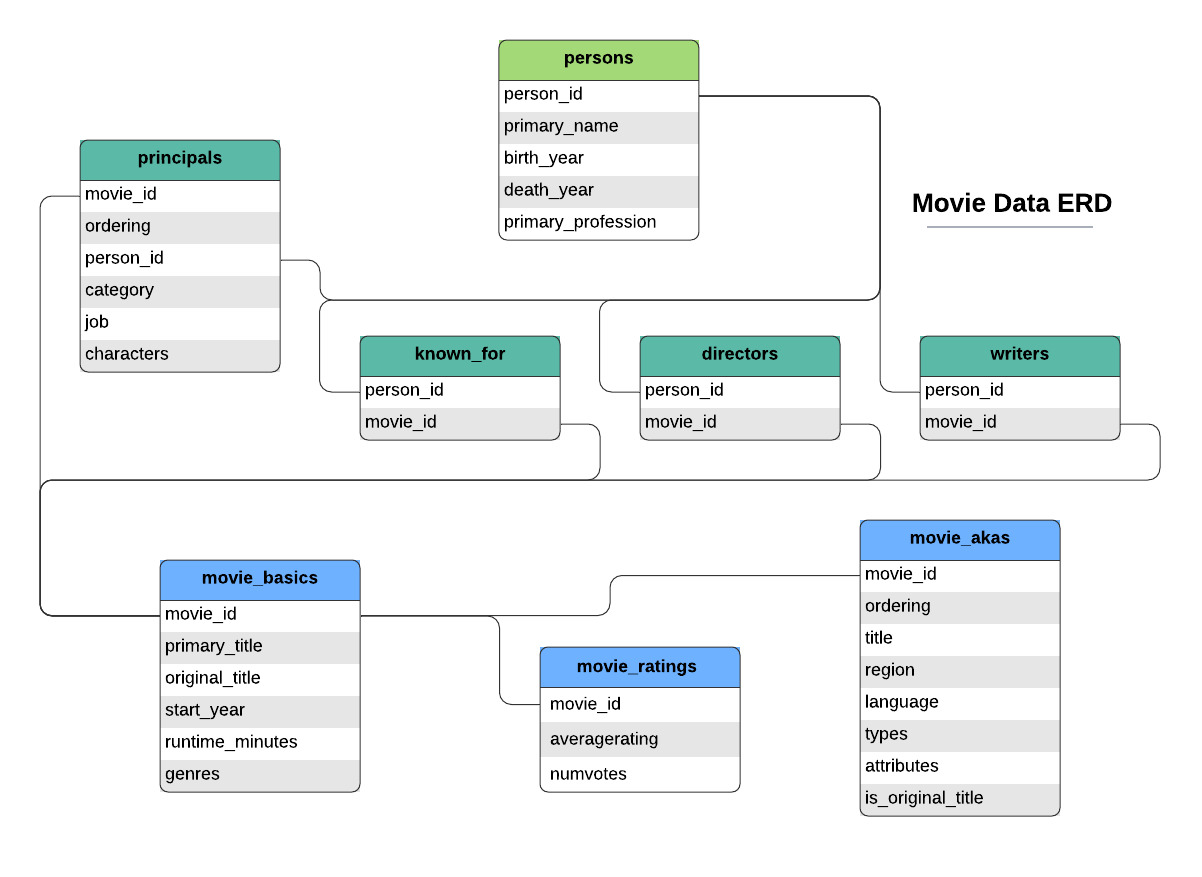
Note that the above diagram shows ONLY the IMDB data. You will need to look carefully at the features to figure out how the IMDB data relates to the other provided data files.
It is up to you to decide what data from this to use and how to use it. If you want to make this more challenging, you can scrape websites or make API calls to get additional data. If you are feeling overwhelmed or behind, we recommend you use only the following data files:
im.db.zip- Zipped SQLite database (you will need to unzip then query using SQLite)
movie_basicsandmovie_ratingstables are most relevant
bom.movie_gross.csv.gz- Compressed CSV file (you can open without expanding the file using
pd.read_csv)
- Compressed CSV file (you can open without expanding the file using
-
Your analysis should yield three concrete business recommendations. The ultimate purpose of exploratory analysis is not just to learn about the data, but to help an organization perform better. Explicitly relate your findings to business needs by recommending actions that you think the business (Microsoft) should take.
-
Communicating about your work well is extremely important. Your ability to provide value to an organization - or to land a job there - is directly reliant on your ability to communicate with them about what you have done and why it is valuable. Create a storyline your audience (the head of Microsoft's new movie studio) can follow by walking them through the steps of your process, highlighting the most important points and skipping over the rest.
-
Use plenty of visualizations. Visualizations are invaluable for exploring your data and making your findings accessible to a non-technical audience. Spotlight visuals in your presentation, but only ones that relate directly to your recommendations. Simple visuals are usually best (e.g. bar charts and line graphs), and don't forget to format them well (e.g. labels, titles).
There are three deliverables for this project:
- A non-technical presentation
- A Jupyter Notebook
- A GitHub repository
The non-technical presentation is a slide deck presenting your analysis to business stakeholders.
- Non-technical does not mean that you should avoid mentioning the technologies or techniques that you used, it means that you should explain any mentions of these technologies and avoid assuming that your audience is already familiar with them.
- Business stakeholders means that the audience for your presentation is Microsoft, not the class or teacher. Do not assume that they are already familiar with the specific business problem, but also do not explain to them what Microsoft is.
The presentation describes the project goals, data, methods, and results. It must include at least three visualizations which correspond to three business recommendations.
We recommend that you follow this structure, although the slide titles should be specific to your project:
- Beginning
- Overview
- Business Understanding
- Middle
- Data Understanding
- Data Analysis
- End
- Recommendations
- Next Steps
- Thank You
- This slide should include a prompt for questions as well as your contact information (name and LinkedIn profile)
You will give a live presentation of your slides and submit them in PDF format on Canvas. The slides should also be present in the GitHub repository you submit with a file name of presentation.pdf.
The graded elements of the presentation are:
- Presentation Content
- Slide Style
- Presentation Delivery and Answers to Questions
See the Grading section for further explanation of these elements.
For further reading on creating professional presentations, check out:
The Jupyter Notebook is a notebook that uses Python and Markdown to present your analysis to a data science audience.
- Python and Markdown means that you need to construct an integrated
.ipynbfile with Markdown (headings, paragraphs, links, lists, etc.) and Python code to create a well-organized, skim-able document.- The notebook kernel should be restarted and all cells run before submission, to ensure that all code is runnable in order.
- Markdown should be used to frame the project with a clear introduction and conclusion, as well as introducing each of the required elements.
- Data science audience means that you can assume basic data science proficiency in the person reading your notebook. This differs from the non-technical presentation.
Along with the presentation, the notebook also describes the project goals, data, methods, and results. It must include at least three visualizations which correspond to three business recommendations.
You will submit the notebook in PDF format on Canvas as well as in .ipynb format in your GitHub repository.
The graded elements for the Jupyter Notebook are:
- Business Understanding
- Data Understanding
- Data Preparation
- Data Analysis
- Visualization
- Code Quality
See the Grading section for further explanation of these elements.
The GitHub repository is the cloud-hosted directory containing all of your project files as well as their version history.
This repository link will be the project link that you include on your resume, LinkedIn, etc. for prospective employers to view your work. Note that we typically recommend that 3 links are highlighted (out of 5 projects) so don't stress too much about getting this one to be perfect! There will also be time after graduation for cosmetic touch-ups.
A professional GitHub repository has:
README.md- A file called
README.mdat the root of the repository directory, written in Markdown; this is what is rendered when someone visits the link to your repository in the browser - This file contains these sections:
- Overview
- Business Understanding
- Include stakeholder and key business questions
- Data Understanding and Analysis
- Source of data
- Description of data
- Three visualizations (the same visualizations presented in the slides and notebook)
- Conclusion
- Summary of conclusions including three relevant findings
- A file called
- Commit history
- Progression of updates throughout the project time period, not just immediately before the deadline
- Clear commit messages
- Commits from all team members (if a group project)
- Organization
- Clear folder structure
- Clear names of files and folders
- Easily-located notebook and presentation linked in the README
- Notebook(s)
- Clearly-indicated final notebook that runs without errors
- Exploratory/working notebooks (can contain errors, redundant code, etc.) from all team members (if a group project)
.gitignore- A file called
.gitignoreat the root of the repository directory instructs Git to ignore large, unnecessary, or private files- Because it starts with a
., you will need to typels -ain the terminal in order to see that it is there
- Because it starts with a
- GitHub maintains a Python .gitignore that may be a useful starting point for your version of this file
- To tell Git to ignore more files, just add a new line to
.gitignorefor each new file name- Consider adding
.DS_Storeif you are using a Mac computer, as well as project-specific file names - If you are running into an error message because you forgot to add something to
.gitignoreand it is too large to be pushed to GitHub this blog post(friend link) should help you address this
- Consider adding
- A file called
You wil submit a link to the GitHub repository on Canvas.
See the Grading section for further explanation of how the GitHub repository will be graded.
For further reading on creating professional notebooks and READMEs, check out this reading.
To pass this project, you must pass each project rubric objective. The project rubric objectives for Phase 1 are:
- Attention to Detail
- Data Communication
- Authoring Jupyter Notebooks
- Data Manipulation and Analysis with
pandas
If you have searched for a job, you have probably seen "attention to detail" appear on a job description. In a survey of hiring managers, fully 56% of them said they felt that recent college grads lacked this skill. So, what does "attention to detail" mean, and how will you be graded on it at Flatiron School?
Attention to detail means that you accomplish tasks thoroughly and accurately. You need to understand what is being asked of you, and double-check that your work fulfills all of the requirements. This will help make you a "no-brainer hire" because it helps employers feel confident that they will not have to double-check your work. For further reading, check out this article from Indeed.
Attention to detail will be graded based on the project checklist. In Phase 1, you need to complete 60% (6 out of 10) or more of the checklist elements in order to pass the Attention to Detail objective. The standard for passing the Attention to Detail objective will increase with each Phase, until you are required to complete all elements to pass Phase 5 (Capstone).
The Phase 1 Project Checklist is linked here as well as directly in Canvas. The elements highlighted in yellow are the elements you need to complete in order to pass this objective. We recommend that you make your own copy of this document, so that you can check off each element as you complete it. The checklist also contains more specific, detailed guidance about the deliverables described above.
Below are the definitions of each rubric level for this objective. This information is also summarized in the rubric, which is attached to the project submission assignment.
70% or more of the project checklist items are complete
60% of the project checklist items are complete
50% of the project checklist items are complete
40% or fewer of the project checklist items are complete
Communication is another key "soft skill". In the same survey mentioned above, 46% of hiring managers said that recent college grads were missing this skill.
Because "communication" can encompass such a wide range of contexts and skills, we will specifically focus our Phase 1 objective on Data Communication. We define Data Communication as:
Communicating basic data analysis results to diverse audiences via writing and live presentation
To further define some of these terms:
- By "basic data analysis" we mean that you are filtering, sorting, grouping, and/or aggregating the data in order to answer business questions. This project does not involve inferential statistics or machine learning, although descriptive statistics such as measures of central tendency are encouraged.
- By "results" we mean your three visualizations and recommendations.
- By "diverse audiences" we mean that your presentation and notebook are appropriately addressing a business and data science audience, respectively.
Below are the definitions of each rubric level for this objective. This information is also summarized in the rubric, which is attached to the project submission assignment.
Creates and describes appropriate visualizations for given business questions, where each visualization fulfills all elements of the checklist
This "checklist" refers to the Data Visualization checklist within the larger Phase 1 Project Checklist
Creates and describes appropriate visualizations for given business questions
This objective can be met even if all checklist elements are not fulfilled. For example, if there is some illegible text in one of your visualizations, you can still meet this objective
Creates visualizations that are not related to the business questions, or uses an inappropriate type of visualization
Even if you create very compelling visualizations, you cannot pass this objective if the visualizations are not related to the business questions
An example of an inappropriate type of visualization would be using a line graph to show the correlation between two independent variables, when a scatter plot would be more appropriate
Does not submit the required number of visualizations
According to Kaggle's 2020 State of Data Science and Machine Learning Survey, 74.1% of data scientists use a Jupyter development environment, which is more than twice the percentage of the next-most-popular IDE, Visual Studio Code. Jupyter Notebooks allow for reproducible, skim-able code documents for a data science audience. Comfort and skill with authoring Jupyter Notebooks will prepare you for job interviews, take-home challenges, and on-the-job tasks as a data scientist.
The key feature that distinguishes authoring Jupyter Notebooks from simply writing Python code is the fact that Markdown cells are integrated into the notebook along with the Python cells in a notebook. You have seen examples of this throughout the curriculum, but now it's time for you to practice this yourself!
Below are the definitions of each rubric level for this objective. This information is also summarized in the rubric, which is attached to the project submission assignment.
Uses Markdown and code comments to create a well-organized, skim-able document that follows all best practices
Refer to the repository readability reading for more tips on best practices
Uses some Markdown to create an organized notebook, with an introduction at the top and a conclusion at the bottom
Uses Markdown cells to organize, but either uses only headers and does not provide any explanations or justifications, or uses only plaintext without any headers to segment out sections of the notebook
Headers in Markdown are delineated with one or more
#s at the start of the line. You should have a mixture of headers and plaintext (text where the line does not start with#)
Does not submit a notebook, or does not use Markdown cells at all to organize the notebook
pandas is a very popular data manipulation library, with over 2 million downloads on Anaconda (conda install pandas) and over 19 million downloads on PyPI (pip install pandas) at the time of this writing. In our own internal data, we see that the overwhelming majority of Flatiron School DS grads use pandas on the job in some capacity.
Unlike in base Python, where the Zen of Python says "There should be one-- and preferably only one --obvious way to do it", there is often more than one valid way to do something in pandas. However there are still more efficient and less efficient ways to use it. Specifically, the best pandas code is performant and idiomatic.
Performant pandas code utilizes methods and broadcasting rather than user-defined functions or for loops. For example, if you need to strip whitespace from a column containing string data, the best approach would be to use the pandas.Series.str.strip method rather than writing your own function or writing a loop. Or if you want to multiply everything in a column by 100, the best approach would be to use broadcasting (e.g. df["column_name"] * 100) instead of a function or loop. You can still write your own functions if needed, but only after checking that there isn't a built-in way to do it.
Idiomatic pandas code has variable names that are meaningful words or abbreviations in English, that are related to the purpose of the variables. You can still use df as the name of your DataFrame if there is only one main DataFrame you are working with, but as soon as you are merging multiple DataFrames or taking a subset of a DataFrame, you should use meaningful names. For example, df2 would not be an idiomatic name, but movies_and_reviews could be.
We also recommend that you rename all DataFrame columns so that their meanings are more understandable, although it is fine to have acronyms. For example, "col1" would not be an idiomatic name, but "USD" could be.
Below are the definitions of each rubric level for this objective. This information is also summarized in the rubric, which is attached to the project submission assignment.
Uses pandas to prepare data and answer business questions in an idiomatic, performant way
Successfully uses pandas to prepare data in order to answer business questions
This includes projects that occasionally use base Python when
pandasmethods would be more appropriate (such as usingenumerate()on a DataFrame), or occasionally performs operations that do not appear to have any relevance to the business questions
Uses pandas to prepare data, but makes significant errors
Examples of significant errors include: the result presented does not actually answer the stated question, the code produces errors, the code consistently uses base Python when
pandasmethods would be more appropriate, or the submitted notebook contains significant quantities of code that is unrelated to the presented analysis (such as copy/pasted code from the curriculum or StackOverflow)
Unable to prepare data using pandas
This includes projects that successfully answer the business questions, but do not use
pandas(e.g. use only base Python, or use some other tool like R, Tableau, or Excel)
Please start by reviewing the contents of this project description. If you have any questions, please ask your instructor ASAP.
Next, you will need to complete the Project Proposal which must be reviewed by your instructor before you can continue with the project.
Then, you will need to create a GitHub repository. There are three options:
- Look at the Phase 1 Project Templates and Examples repo and follow the directions in the MVP branch.
- Fork the Phase 1 Project Repository, clone it locally, and work in the
student.ipynbfile. Make sure to also add and commit a PDF of your presentation to your repository with a file name ofpresentation.pdf. - Create a new repository from scratch by going to github.com/new and copying the data files from one of the above resources into your new repository. This approach will result in the most professional-looking portfolio repository, but can be more complicated to use. So if you are getting stuck with this option, try one of the above options instead.
This project will give you a valuable opportunity to develop your data science skills using real-world data. The end-of-phase projects are a critical part of the program because they give you a chance to bring together all the skills you've learned, apply them to realistic projects for a business stakeholder, practice communication skills, and get feedback to help you improve. You've got this!