This is a repository of the python code used in the paper https://www.mdpi.com/2075-4418/13/1/7. All python scripts and notebooks, as well as extracted features needed to reproduce the analysis are included.
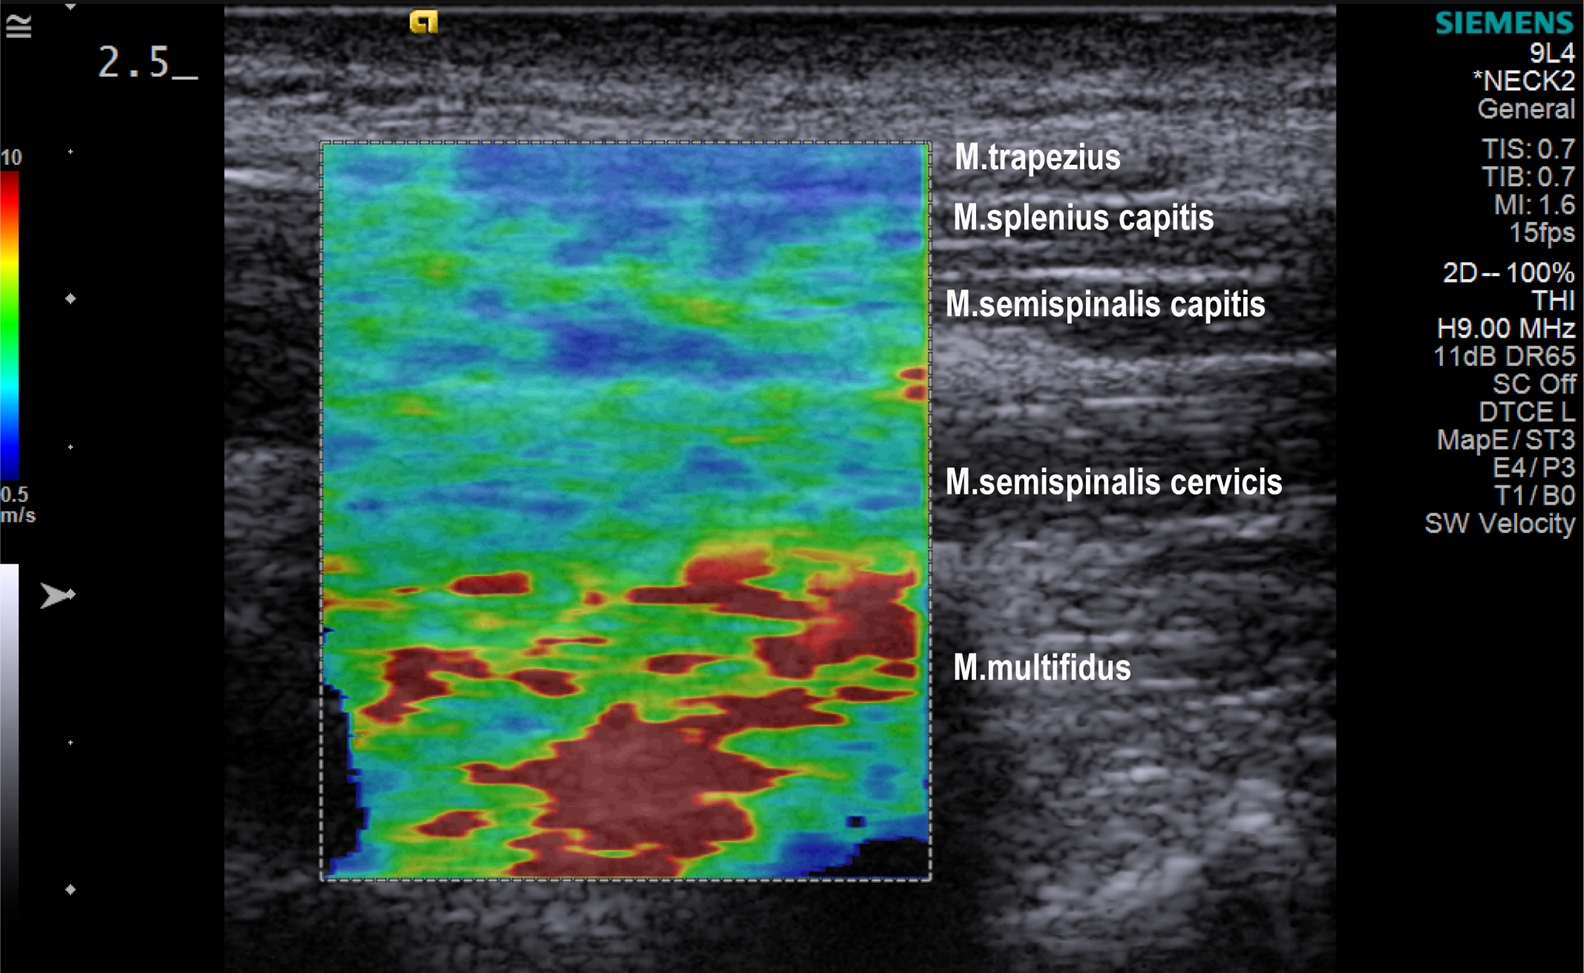
Everyone has or will have experienced some degree of neck pain. Typically, neck pain is associated with the sensation of tense, tight, or stiff neck muscles. However, it is unclear whether the neck muscles are objectively stiffer with neck pain. The study used 1099 ultrasound elastography images (elastograms) obtained from 38 adult women, 20 with chronic neck pain and 18 asymptomatic. For training machine learning algorithms, 28 numerical characteristics were extracted from both the original and transformed shear wave velocity color-coded images as well from respective image segments. Overall, a total number of 323 distinct features were generated from the data. A supervised binary classification was performed, using six machine-learning algorithms. The random forest algorithm produced the most accurate model to distinguish elastograms of women with chronic neck pain from asymptomatic women with an AUC of 0.898. When evaluating features that can be used as biomarkers for muscle dysfunction in neck pain, the region of the deepest neck muscles (M. multifidus) provided the most features to support the correct classification of elastograms. By constructing summary images and associated Hotelling’s T² maps, we enabled the visualization of group differences and their statistical confirmation.
For the analysis Python 3.10 was used.
pip install -r requirements.txt
The folder structure could be easily customized within the scripts. The here presented structure is merely a suggestion.
It is recommended, the scripts to be placed in a directory, together with the following folders:
- data - directory that contains csv files with data information and data/images contains the raw image data.
- figures - directory that contains all graphs generated by scripts with matplotlib.
- tables - directory that contains csv tables generated by scripts.
The scripts require a csv file that contains imaging following the proposed structure.
- subject - the id of the subject.
- repeat - the number of the imaging session.
- group - the pain or control. (e.g. pain = 0, control = 1)
- task1_E - path to the elastrography image file.
- task2_Q - path to the quality map file.
The number of columns is not limited, but additional columns should always be added in pairs of elastography images and quality maps.
| subject | repeat | group | task1_E | task1_Q | task2_E | task2_Q |
|---|---|---|---|---|---|---|
| 1 | 1 | 0 | data/images/imageE001.BMP | data/images/imageQ001.BMP | data/images/imageE007.BMP | data/images/imageQ007.BMP |
| 1 | 2 | 0 | data/images/imageE002.BMP | data/images/imageQ002.BMP | data/images/imageE007.BMP | data/images/imageQ008.BMP |
| 1 | 3 | 0 | data/images/imageE003.BMP | data/images/imageQ003.BMP | data/images/imageE009.BMP | data/images/imageQ009.BMP |
| 2 | 1 | 1 | data/images/imageE004.BMP | data/images/imageQ004.BMP | data/images/imageE010.BMP | data/images/imageQ010.BMP |
| 2 | 2 | 1 | data/images/imageE005.BMP | data/images/imageQ005.BMP | data/images/imageE011.BMP | data/images/imageQ011.BMP |
| 2 | 3 | 1 | data/images/imageE006.BMP | data/images/imageQ006.BMP | data/images/imageE012.BMP | data/images/imageQ012.BMP |
The script generates mean, median, and std summary images, together with Hotelling's T² test map, by analyzing the shear wave elastography images of two groups.
Usage:
summary_image_and_hotellings_t2_map_generator.py [-h] [-data DATA] [-r] [-tasks TASKS] [-inter]

Summary image generator

options:
  -h, --help    show this help message and exit
  -data DATA    CSV file with images info.
  -r            Remove all images with less than 50 percent colored pixels.
  -tasks TASKS  Read in the tasks from CSV file.
  -inter        Use intersection of ROI instead of the largest ROI when cropping the images.

Example usage:
  python summary_image_and_hotellings_t2_map_generator.py -data data/dataset.csv -inter
The script extracts features from the shear wave elastography images such as mean, median, number of red pixels etc., from the whole image or/and from horizontal segments.
Usage:
swe_image_feature_extractor.py [-h] [-csv CSV] [-roi] [-seg] [-remove] [-bottom]

Feature extraction script.

options:
  -h, --help  show this help message and exit
  -csv CSV    path to dataset csv file.
  -roi        Extract features of roi.
  -seg        Segment roi and extract features.
  -remove     Remove images with less than 50 percent colored pixels.
  -bottom     Extract features from bottom part only.

Example usage:
  python swe_image_feature_extractor.py -csv data/dataset.csv -roi
The notebooks can be loaded in JupyterLab or Jupyter Notebook.
Evaluation of six machine learning models with hyper-parameter optimization and nested cross-validation.
Extracting impurity base feature importance from cross-validation of Random Forest Classifier.