GPipe is a Gerrit Analysis Pipeline that uses the Gerrit REST API to fetch changes made to Chromium, OpenDEV or android, and presents them using graphs or excel.
GPipe was made by Oliver Bölin during a university course at Blekinge Tekniska University (BTH).
To use and install this tool, it is recommended that you'll need
1. Python 3.x
2. Pip
While there is an executable available, it is not recommended to use it. Instead, it is recommended that you install Python, and pip separately and then run the tool using the provided Python script.
For non technical users:
- 1. Press the green code button to the top right and press
Download ZIP - 2. Unpack the folder you downloaded to the desired place
- 3. Run
GPipe.exe, it should be the one with the gp icon. Windows antivirus will likely tell you something is wrong, but this is just because of python executables looking unsafe - 4. The software should be running now
First-time installation:
- 1. Clone the repository:
git clone https://github.com/frankuman/GPipe - 2. Open a terminal window in the folder by typing:
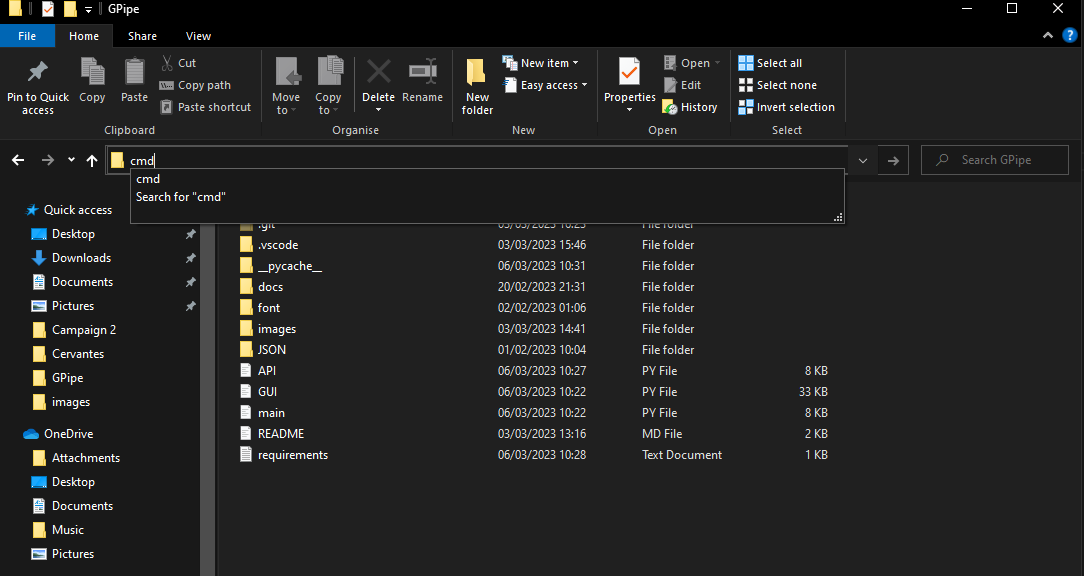
cd GPipeor by writing cmd in the fileinput - 3. Install the required packages:
pip install -r requirements.txt - 4. Ubuntu users also need to run:
sudo apt-get python3-tk

How to run:
- (RECOMMENDED) Run the script with:
python gpipe_main.py - (WINDOWS USERS) If you don't know about Python or pip, you can just make a shortcut of the GPipe.exe and run that shortcut from anywhere
- Have fun!
GPipe is not that sophisticated and should not be that hard to learn!
- Time settings - Here you can set the time for your search, default is current time - 1 day
- Graph settings - Here you can choose the X-axis and if you want to pop out pyplot
- Generate graph - If you have made a run, you can now generate a graph on that data. You can also change the X-axis in graph settings.
- Generate PDF - If you have made a run, you can now generate a PDF on that data. You can also change the X-axis in graph settings.
- Generate EXCEL - If you have made a run, you can now generate an EXCEL on that data.
- Platform picker - Here you choose one of the platforms. I have not added authentication, but it could probably be done easily. Chromium and Android are a bit slower than OpenDEV.
- is: - Choose a metric, or none, if none, it searches all changes.
- / Crawl - Input a username or similar stuff
- / Run - Run GPipe with current settings
- / Quit - Quit GPipe
Thank you testers, Gustav B(win10), Elias E(win10), Edwin Ö(win10), Philippe D(win 10)
