jqPivot in version 4.9
The code of jqPivot included in free jqGrid 4.8 was almost identical to the code from jqGrid 4.7. It was only some small bug fixes implemented. The bugs reported later after publishing of free jqGrid 4.8 were much more difficult to fix.
The implementation of old jqPivot had many principal problems which could be difficult to solve. The code consists mostly from two parts. In the first part one scans the input data and creates the internal tree structure with some properties holding the input information and the results of calculations of the aggregates which will be the input data of jqGrid. In the second part one generates jqGrid columns (colModel), the grouping header information. The second part are implemented as recursive function. In both parts one uses enumeration by properties of objects. The order of enumeration is very important for some parts, but it could be in general different for different web browsers.
One more important problem of old implementation of jqPivot was the usage of column names based on the properties of input data. The problem is that there are almost no restrictions on the properties of JavaScript and so on the properties of input data. On the other side the column names of colModel will be used to build ids of resulting HTML elements, which produces an important problem. The old code cut only spaces from the input data, but only spaces. It produced another problems. Moreover one used in some other, more complicates cases, the column names which had the space at the end of the name. I don't want to describe all problems in the old code. One of the main problems was the debugging problem of the old code. It was very difficult to debug recursive part of the code to locale the reported bug. Some other simple changes in the code have changed just the order of enumerating properties in some loops and it break the code.
At the end I decided to rewrite the whole code just trying to hold the main compatibility. The main goal was to organize the code in some clear separated parts. In the first part of new code I creates just sorted index of unique X and Y values (see xDimension and yDimension option) of input data. The indexes consists mostly from the unique set of X and Y vectors found in the input data and the references (indexes) of the vectors in the source data. Then the code creates the column (colModel) and column headers. Finally it will be made the calculation of the aggregated values. Such code organizations simplifies debugging and allows to implement new advanced options relatively easy without any side effects.
The base structure of the options of jqPivot is exactly like before:
$("#grid").jqGrid("jqPivot", data, pivotOptions, gridOptions, ajaxOptions);The changes exists only in pivotOptions.
To describe there I will first remind what jqPivot do. We starts with an typical example of the usage. Let us we have statistic data of selling of different goods/products and we need to analyse the data. We have large set of data: which goods/products, when were sold, to which category the good/product belongs, the price, the number of sold items of goods, the date of selling and many other things. We want to produce the grid with selling statistic grouped by year, mouth and week name. We use for example the texts "first", "second", "third" and "fourth" for the week name inside of the month. The results should looks close to the picture below:
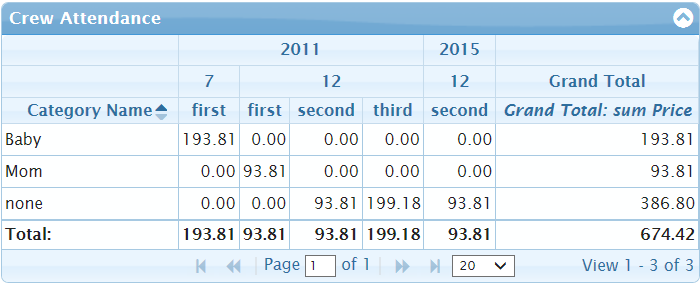
To build such grid we need dynamically build colModel of jqGrid based on the input data. Let us we have the input data as array of items with the following properties for example
{
    "CategoryName": "Baby",
    "ProductName": "Baby Oil",
    "Price": "193.81",
    "Quantity": "1",
    "sellmonth": "7",
    "sellyear": "2011",
    "week": "first"
}
It could be many items of data having CategoryName: "Baby", but we want to group all the data together in one row of the output grid. Such option, which build the rows of resulting grid will be named as xDimension.
xDimension: [
    { dataName: "CategoryName", label: "Category Name" }
]
The items of xDimension defines not only the rows in the resulting grids, but the fist columns too. One have to define at least one item in xDimension, but it's possible to define multiple xDimension. jqGrid will use grouping by the second item of xDimension automatically. One can have additionally add grouping. So that one can collapse the items to see overview and to expand group to see details:


We will use below the following input data
[
    { "CategoryName": "Baby", "Price": "193.81", "sellmonth": "7",  "sellyear": "2011", "week": "first", ... },
    { "CategoryName": "Mom",  "Price": "93.81",  "sellmonth": "12", "sellyear": "2011", "week": "first", ... },
    { "CategoryName": "none", "Price": "93.81",  "sellmonth": "12", "sellyear": "2011", "week": "second", ... },
    { "CategoryName": "none", "Price": "93.81",  "sellmonth": "12", "sellyear": "2011", "week": "third", ... },
    { "CategoryName": "none", "Price": "105.37", "sellmonth": "12", "sellyear": "2011", "week": "third", ... },
    { "CategoryName": "none", "Price": "93.81",  "sellmonth": "12", "sellyear": "2015", "week": "second", ... }
]
and will display the pivot
The input data contains many different unique combinations of the y-vector (year, mouth, week name). All different values of the y-vector defines columns of the grid:
[
    {"sellyear": "2011", "sellmonth": "7",  "week": "first", ...}
    {"sellyear": "2011", "sellmonth": "12", "week": "first", ...}
    {"sellyear": "2011", "sellmonth": "12", "week": "second", ...}
    {"sellyear": "2011", "sellmonth": "12", "week": "third", ...}
    {"sellyear": "2015", "sellmonth": "12", "week": "second", ...}
]
and many different unique "Category Name" values which builds x-vector:
[
    { "CategoryName": "Baby", ... },
    { "CategoryName": "Mom",  ... },
    { "CategoryName": "none", ... },
]
The following basis jqPivot options can be used
xDimension: [
    { dataName: "CategoryName", label: "Category Name"}
],
yDimension: [
    { dataName: "sellyear", sorttype: "integer" },
    { dataName: "sellmonth", sorttype: "number" },
    { dataName: "week"}
],
aggregates: [
    { member: "Price", aggregator: "sum"}
]
The label in items of xDimension defines the header of the first column of the resulting grid. The sorttype is important because for the correct grouping one need to sort the input data by yDimension.
After the grouping by xDimension and yDimension one can still have more as one items which corresponds the same criteria. The following input data provide an example of such case
[
    ...
    { "CategoryName": "none", "Price": "93.81",  "sellmonth": "12", "sellyear": "2011", "week": "third", ... },
    { "CategoryName": "none", "Price": "105.37", "sellmonth": "12", "sellyear": "2011", "week": "third", ... },
    ...
]
So one calculate some aggregate function over the grouped items. We displays in the resulting grid the Price and one need calculate the sum of values of the the Price properties of input data. The aggregates option informs jqGrid about the required settings
aggregates: [
    { member: "Price", aggregator: "sum" }
]
One can specify multiple aggregates items. For example
aggregates: [
    { member: "Price", aggregator: "sum" },
    { member: "Price", aggregator: "count" }
]
or to calculate the same aggregates "sum" over different input items. More full above data used as the input contains Quantity property which shows the number of items sold:
{
"CategoryName": "Baby",
"ProductName": "Baby Oil",
"Price": "193.81",
"Quantity": "1",
"sellmonth": "7",
"sellyear": "2011",
"week": "first"
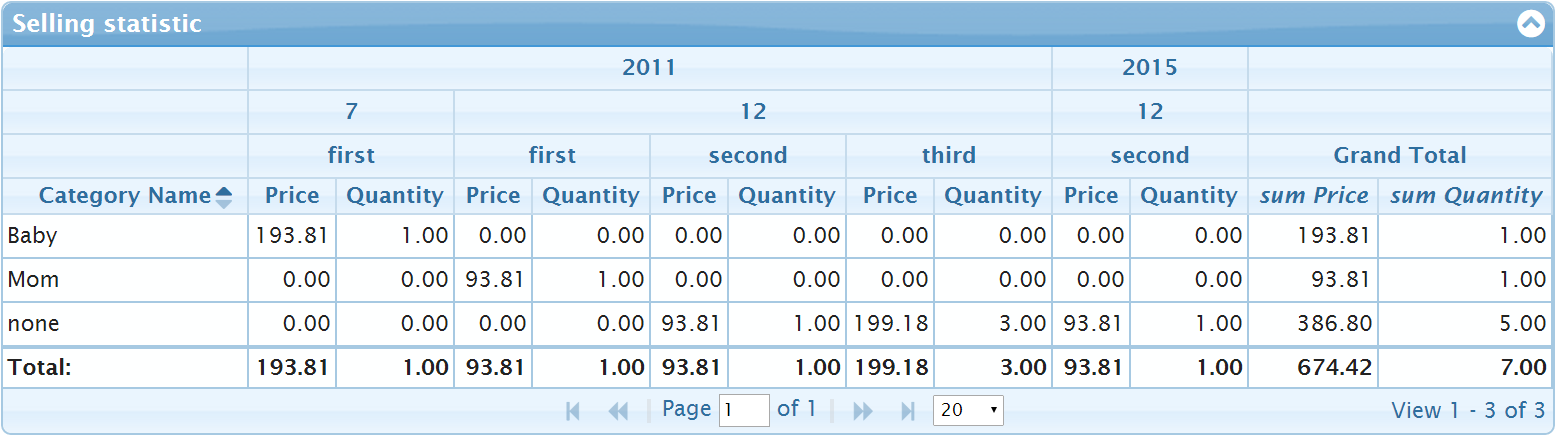
}Such value gives us better information if the above information gives already the summary of the week sells. So we can use
aggregates: [
    { member: "Price",   aggregator: "sum", label: "Price" },
    { member: "Quantity", aggregator: "sum", label: "Quantity" }
]
to have the results like below
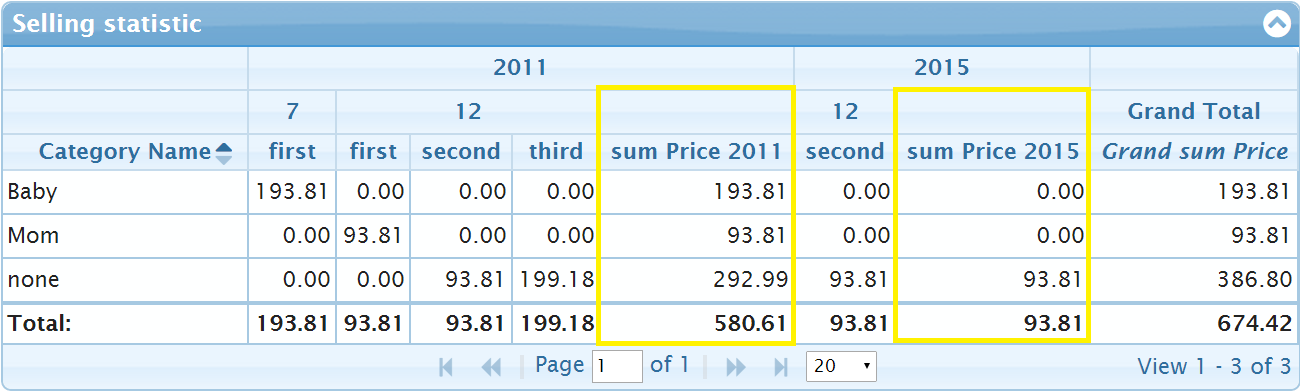
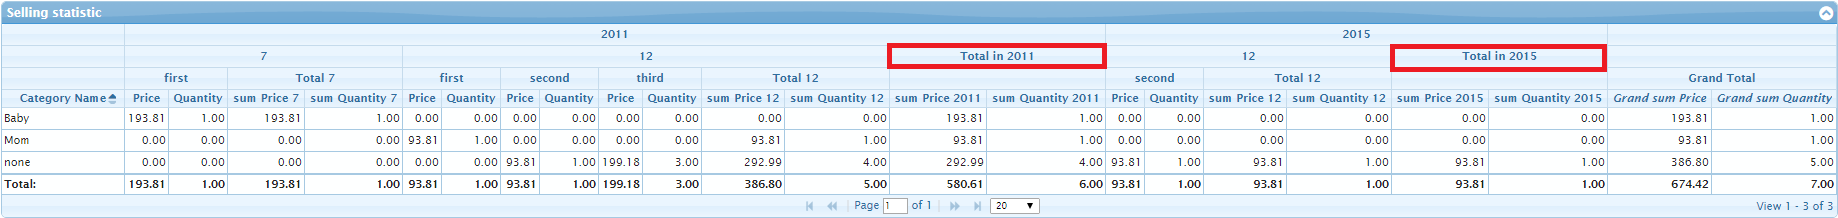
One sees additional total summary information on the grid in the footer row of the grid and in the last column. The corresponding information is marked in blue and yellow on the picture below:
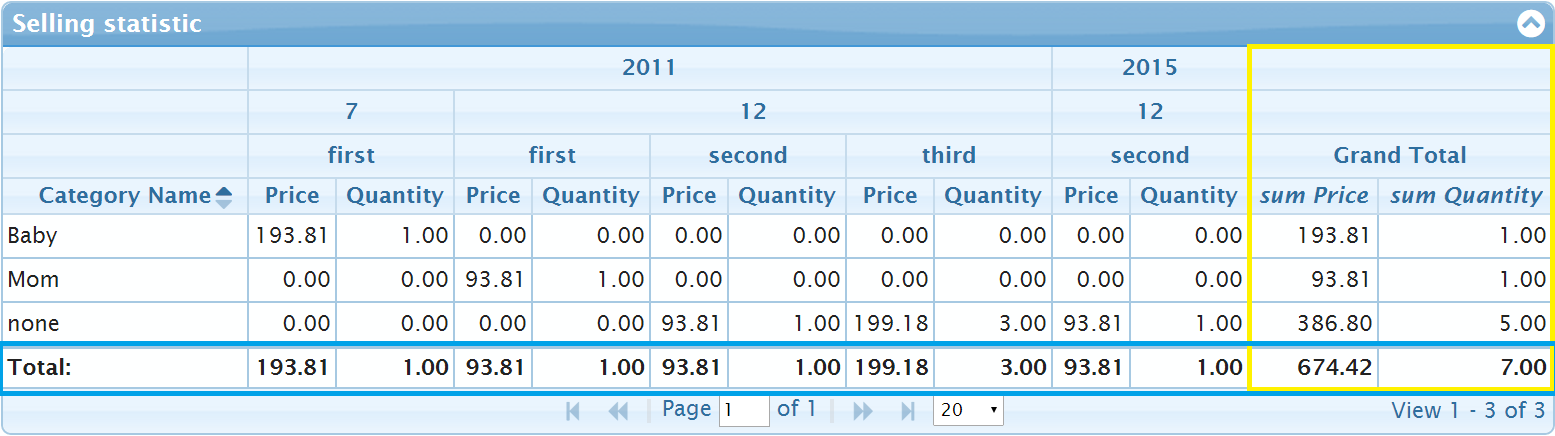
The footer option on the following options
footerTotals: true,
footerAggregator: "sum",
xDimension: [
    { dataName: "CategoryName", label: "Category Name", footerText: "Total:" }
]
The footerTotals: true option specify that the footer row need be created. The footerAggregator: "sum" means that the sum over all values from the corresponding column need be calculated. The label specifies the text of the header of the first column and the footerText specifies the text of the footer. The previous version of the grid used colTotals instead of footerTotals. We test for the value too because of compatibility reasons, but we recommend to use new footer... options because there have less misunderstandable names.
To create the last column in the grid with the totals over the value of every row one need to add the options like the following
totalHeader: "Grand Total",
totalText: "<span style='font-style: italic'>{0} {1}</span>"
which creates the last column. The totalText option contains the template with {0} and {1} which will be replaced to aggregates[i].aggregator and aggregates[i].member. It's also new feature in the new version of jqPivot.
New version of jqPivot allows to use templates (strings with {0}, {1}, {2}, ...) and callback functions in label property of xDimension and in totalText. One can defines aggregator as callback function too for calculation of custom aggregation values from the input data.
Additionally one can specify totals, totalsText and totalHeader inside of yDimension to calculate additional aggregates over the part of row data. For example one row of data can contains the information about multiple years (2011 and 2015 in the above example) and one can display additional columns with totals calculated over every of the year. We will describe the possibility below.
The above example
totalHeader: "Grand Total",
totalText: "<span style='font-style: italic'>{0} {1}</span>"
can be rewritten using totalText defined as callback function alternatively:
totalHeader: "Grand Total",
totalText: function (options) {
    return "<span style='font-style: italic'>" + options.aggregate.aggregator + " " +
        options.aggregate.member + "</span>";
}
The option parameter have currently tree properties aggregate, iAggregate and pivotOptions. One can rewrite the above callback function to use the properties iAggregate and pivotOptions instead of aggregate:
totalHeader: "Grand Total",
totalText: function (options) {
    var aggregate = options.pivotOptions.aggregates[options.iAggregate];
    return "<span style='font-style: italic'>" + aggregate.aggregator + " " + aggregate.member + "</span>";

}The standard string values of aggregator supported by new jqPivot are: "sum", "count", "avg", "min" and "max". The "avg" was not supported by old jqPivot. To allow the most flexible aggregate functions one can define it as the callback. For example one can define an element of aggregates as
{
    member: "Price",
    label: "Custom Sum",
    aggregator: function (options) {
        return options.previousResult + options.value;
    }
}
The options contains all information which could be required: The previousResult and value are the based properties. Additionally one have access to all properties of the row: the item property. The value property contains the value of fieldName property. The property items contains all rows and the iItem the index of the row in the items array. So one can rewrite the above example as
{
    member: "Price",
    label: "Custom Sum",
    aggregator: function (options) {
        return options.previousResult + parseFloat(options.item[options.fieldName]);
    }
}
The options.item is the same as options.items[options.iItem].
One should remark that the usage of aggregator property defined as function required to change totalText function defined above to the following
totalHeader: "Grand Total",
totalText: function (options) {
    if (typeof options.aggregate.aggregator === "string") {
        return "<span style='font-style: italic'>" + options.aggregate.aggregator + " " +
            options.aggregate.member + "</span>";
    }
    return "<span style='font-style: italic'>" + options.aggregate.label + " " +
        options.aggregate.member + "</span>";
}
The pivot from the following picture
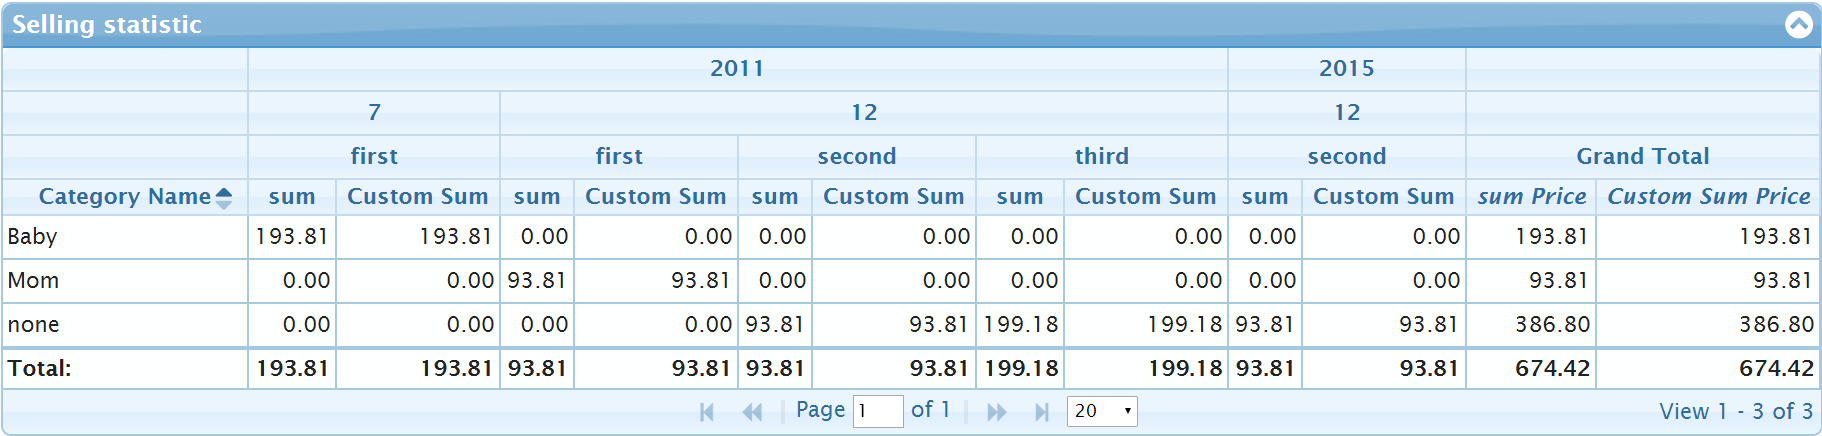
uses the following full set of pivot options
{
    footerTotals: true,
    footerAggregator: "sum",
    totals: true,
    totalHeader: "Grand Total",
    totalText: function (options) {
        if (typeof options.aggregate.aggregator === "string") {
            return "<span style='font-style: italic'>" + options.aggregate.aggregator + " " +
                options.aggregate.member + "</span>";
        }
        return "<span style='font-style: italic'>" + options.aggregate.label + " " +
            options.aggregate.member + "</span>";
    },
    xDimension: [
        { dataName: "CategoryName", label: "Category Name", footerText: "Total:" }
    ],
    yDimension: [
        { dataName: "sellyear",  sorttype: "integer" },
        { dataName: "sellmonth", sorttype: "integer" },
        { dataName: "week" }
    ],
    aggregates: [
        { member: "Price", aggregator: "sum" },
        { member: "Price", label: "Custom Sum",
            aggregator: function (options) {
                return options.previousResult + options.value;
            }
        }
    ]
}Additionally one can specify totals, totalsText and totalHeader inside of yDimension to calculate additional aggregates over the part of row data. For example one row of data can contains the information about multiple years (2011 and 2015 in the above example) and one can display additional columns with totals calculated over every of the year.
Simple adding the property totals: true to the item of yDimension which corresponds to sellyear property produce additional totals column for every group of years. The new columns are marked yellow colors on the picture below
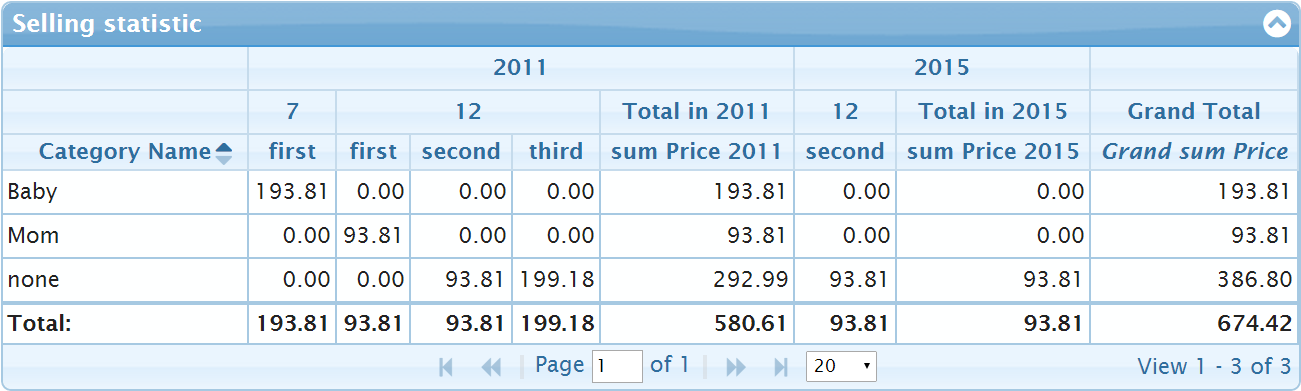
To have custom header in the grouping total columns one need specify totalHeader property in the corresponding yDimension item. One don't need to use totals: true in the case, because jqPivot set it automatically to true if totalHeader or totalText are specified for the yDimension item.
The picture below used totalHeader: "Total in {0}" property for sellyear column
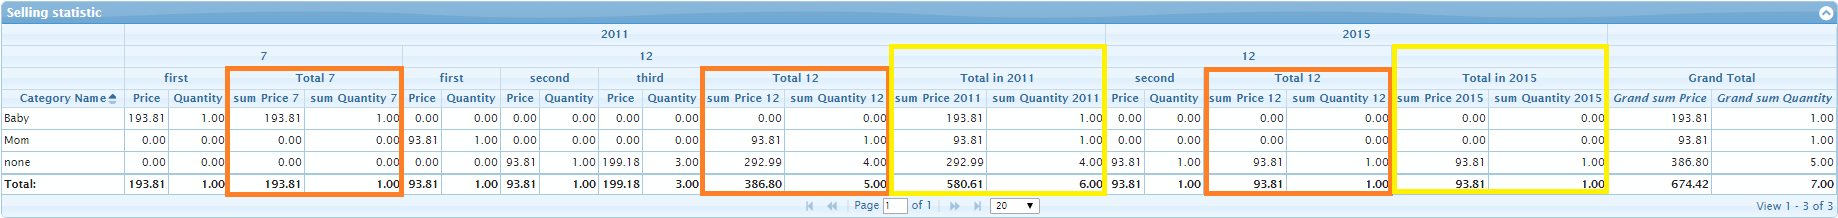
One can define close property for the "sellmonth" y-item too. It will increase the number of columns. If we add totals: true in the second ("sellmonth") y-item we get the pivot grid like on the picture below. New columns are marked in orange color:
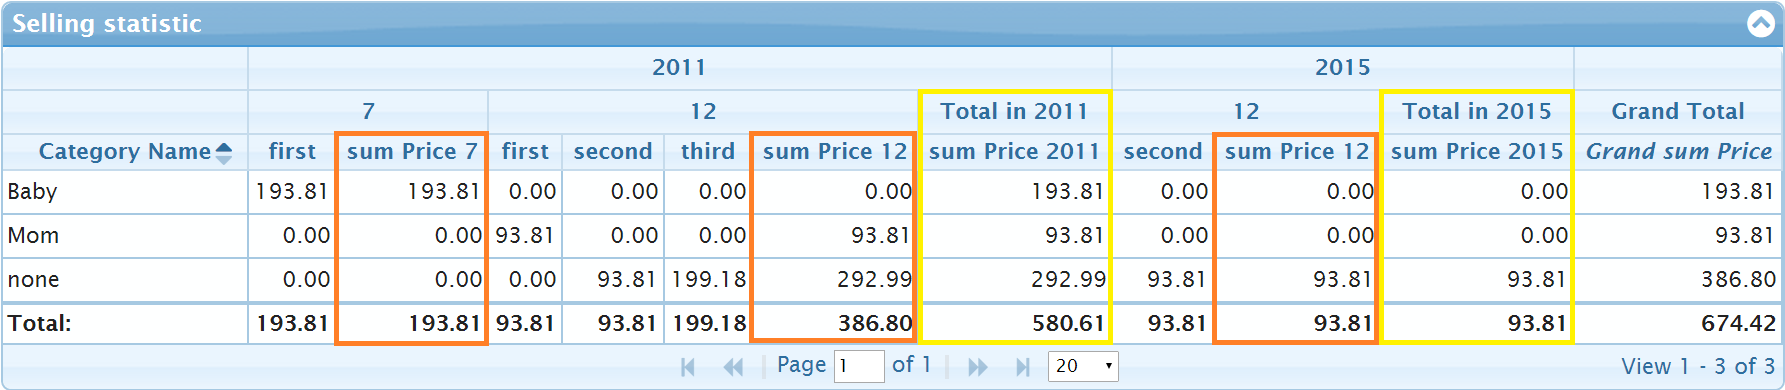
By adding the second item in aggregates we double the number of columns in the grid and increase the level of grouping of headers. So we replace totals: true in the y-item "sellmonth" to totalHeader: "Total {0}". The resulting grid looks like on the next picture:
One more option headerOnTop: true allows to lift the headers "Totals in 2011" and "Totals in 2015" higher. The pivot
uses the following full set of pivot options:
{
    footerTotals: true,
    footerAggregator: "sum",
    totalHeader: "Grand Total",
    totalText: "<span style='font-style: italic'>Grand {0} {1}</span>",
    xDimension: [
        { dataName: "CategoryName", label: "Category Name", footerText: "Total:" }
    ],
    yDimension: [
        { dataName: "sellyear",  sorttype: "integer", totals: true, totalHeader: "Total in {0}", headerOnTop: true },
        { dataName: "sellmonth", sorttype: "integer", totals: true, totalHeader: "Total {0}" },
        { dataName: "week" }
    ],
    aggregates: [
        { member: "Price",    aggregator: "sum", label: "{1}" },
        { member: "Quantity", aggregator: "sum", label: "{1}" }
    ]
}
One can use of cause functions as the value of label property of aggregates, totalText and totalHeader property of yDimension items.
We consider to rearrange a little the headers of grouping totals and insert a button "+" inside. It will allows to collapse/expand the grouping totals in the same way like one can collapse/expand the rows of grouping by xDimension.
Additional options allows to customize some other behavior of jqPivot. Some options exist already in old version of jqPivot
-
useColSpanStyle: true(defaultfalse) makes headers of the first columns (fromxDimension) be in the middle of the headers. -
groupSummary: true- can be used to group rows. One can use the options in case of usagexDimensionwhich contains more as one item -
groupSummaryPos: "header"- the option will be used by grouping. One should addsummaryType(for examplesummaryType: "sum") in the items ofaggregatesto specify which kind of grouping one need to use in the summary footers/headers. -
frozenStaticCols: false- settingfrozenStaticCols: truemakes the first columns (fromxDimension) be frozen.
The next group of options can customize the x- and y-indexes - the set of unique values (x vectors and y vectors) collected from the input data. New jqPivot uses binary search which have log(n) complexity for sorting. So it is not slow, but you can use skipSortByX: true and skipSortByY: true to switch off the sorting. It is recommended to do only if the input data are already sorted like you want to display. Summarize:
-
trimByCollect: false- switch off trimming of string from input data -
skipSortByX: true- skip sorting by xDimension -
skipSortByY: true- skip sorting by yDimension -
caseSensitive: false- make compare of strings during sorting case sensitive -
compareVectorsByX- callback function which allows to implement custom sorting by the whole x vector. See later for the detail description and the demo example. -
compareVectorsByY- callback function which allows to implement custom sorting by the whole y vector. See later for the detail description and the demo example.
The last option customize the type of data used in columns of the grid (skipping the first xDimension columns). By default jqGrid add template: "number" is no template or formatter option are specified in aggregates items. One can use defaultFormatting: false to switch off the behavior. As the result one will see empty cells instead of 0.00 on the place where no values are defined. The results will looks like on the picture below
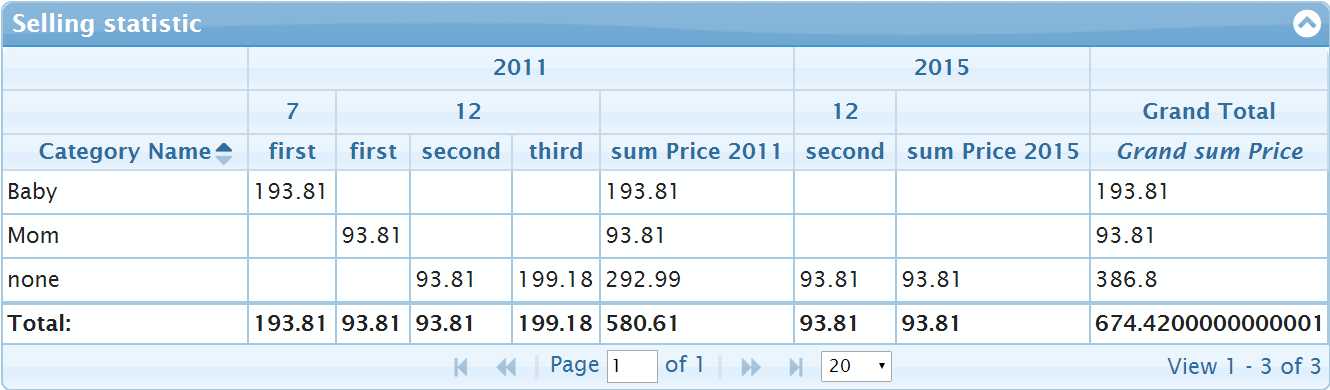
The small disadvantage of switching off the formatting can be the values like 674.4200000000001 instead of 674.42 because of usage floating point numbers. One can other jqGrid customization to round such values.
The pivot option used for creating jqGrid will be saved in the pivotOptions parameter of jqGrid. One can access it by usage getGridParam exactly like all other parameters.
It could be important to understand that the unique x and y indexes creating during working of jqPivot will be saved as properties of pivotOptions parameter: xIndex, yIndex and data properties, where data specifies the input data (before aggregation).
There are exist additionally other data which could be helpful for customization of the grid. First of all one should mention that the first columns of the grid have the names "x0", "x1" and so on. The number of such columns corresponds the length of xDimension parameter of jqPivot.
The next main columns of the grid will be have the names "y0", "y1", "y2", ... if the length of aggregates parameter is 1 and "y0a0", "y0a1", "y0a2", ... "y1a0", "y1a2", "y1a3", ... "y2a0", "y2a1", "y2a2", ... if the length of aggregates parameter is larger as 1. The number of yi corresponds to the number of unique y values in the input data. The pivotOptions.yIndex.items contains all the unique values.
If one uses group totals (totals: true or totalText or totalHeader properties in yDimensions) then there are exist additional columns after every group. The names of such columns looks like "y<i>t<j>a<k>" where <i>, <j> and <k> are numbers and <j> corresponds to the number of the total group.
The columns for the totals (the totals over all columns of the row calculated using the same aggregate) have the name "t" if the length of aggregates parameter is 1 and "t0", "t1", "t2", ... if the length of aggregates parameter larger as 1.
Additionally to common xIndex, yIndex and data properties of pivotOptions parameter jqPivof generates row specific and cell specific values and place the values inside of pivotInfos property of every row of data. One can access the data inside of cellattr, rowattr, custom formatter or just use getLocalRow for some row and examine the value of pivotInfos property.
The pivotInfos object contains x and iX properties which informs about x vector of the row and the index of x vector of the row inside of the xIndex (pivotOptions.xIndex.items[iX] is equal to pivotInfos.x). It's the row specific information saved in the pivotInfos. Other information is cell specific. Inside of cellattr, rowattr, custom formatter one have access to cm (the item of colModel). So one have access to cm.name. To get pivot specific information associated with the cell one need use pivotInfos[cm.name]. The resulting object have multiple properties:
-
colTypedescribes the type of the cell.0means the standard pivot cell.1means group total column and2- the row total. -
iA- index inside ofaggregatesused for calculation the value of the column -
a- the item ofaggregates -
rows- the array of input data used for calculation. The rows have the samexandyvalues -
iRows- the indexes of items fromrowsinside of array of input datapivotOptions.data -
y-yvector of the column. It's array of the same length likeyDimensions. The property will be filled only for the standard cells (colType === 0). -
iY- index inside ofyIndex(pivotOptions.yIndex.items[iY]). The property will be filled only for the standard cells (colType === 0). -
level- it informs about the level of group (0-bases index inyDimensionarray) used in total. 0 - means the top level which corresponds the first element ofyDimensionarray. The property will be filled only for the standard cells (colType === 1). -
ys- array ofyvector of the column. The property will be filled only for the standard cells (colType !== 0). (for totals and group total) -
iYs- array of indexes ofyvectors inside ofyIndex(pivotOptions.yIndex.items[iYs[i]]isys[i]). The property will be filled only for the standard cells (colType !== 0). (for totals and group total)
The example below shows how one can use pivotOptions and pivotInfos inside of cellattr:
cellattr: function(rowId, cellValue, rawObject, cm, rdata) {
    var gridPivotInfos = $(this).jqGrid("getGridParam", "pivotOptions"),
        pivotInputData = gridPivotInfos.data,
        yIndex = gridPivotInfos.yIndex,
        xIndex = gridPivotInfos.xIndex,
        rowPivotInfos = rdata != null ? rdata.pivotInfos : null,
        x = rowPivotInfos != null ? rowPivotInfos.x : null, // the same as xIndex[rowPivotInfos.iX]
        cellPivotInfos = rowPivotInfos != null ? rowPivotInfos[cm.name] : null, // rowPivotInfos is undefined cuttenly for columns with total or group totals
        y = cellPivotInfos != null ? cellPivotInfos.y : null,
        a = cellPivotInfos != null ? cellPivotInfos.a : null, // gridPivotInfos.aggregates[cellPivotInfos.ia]
        iRows = cellPivotInfos != null ? cellPivotInfos.iRows : null, // indexs of pivotInputData used in cell value
        rows = cellPivotInfos != null ? cellPivotInfos.rows : null; // array of items of pivotInputData used in cell value

    // The callback cellattr will be called to build grouping summary row too
    // One have rowId===undefined, rawObject===undefined, rdata===undefined in the case
    var inputData = rdata != null ? rdata[cm.name] : cellValue;
    if ((x != null && x[0] === "Baby") && (y != null && y[0] === "2011") && parseFloat(inputData) < 200) {
        return ' class="ui-state-error"';
    }
}The options compareVectorsByX and compareVectorsByY allows to specify callback function which will be used for custom sorting by the whole x or y vector.
The default implementation of sorting by the vector can be found here. It's compareVectorsEx method of ArrayOfFieldsets. It's important to understand that the function will be used for two purpose: 1) compare the vectors 2) finding the index of the vectors where there are differences in the compared vectors. So the method compareVectorsEx returns object with two properties: index and result. The property result is well known value -1, which means that the first vector is less then the second one, 0, means the vectors are equal to, 1, which means that the first vector is greater then the second one. The property index returns 0-based index of the element of the compared vectors where the vectors are different.