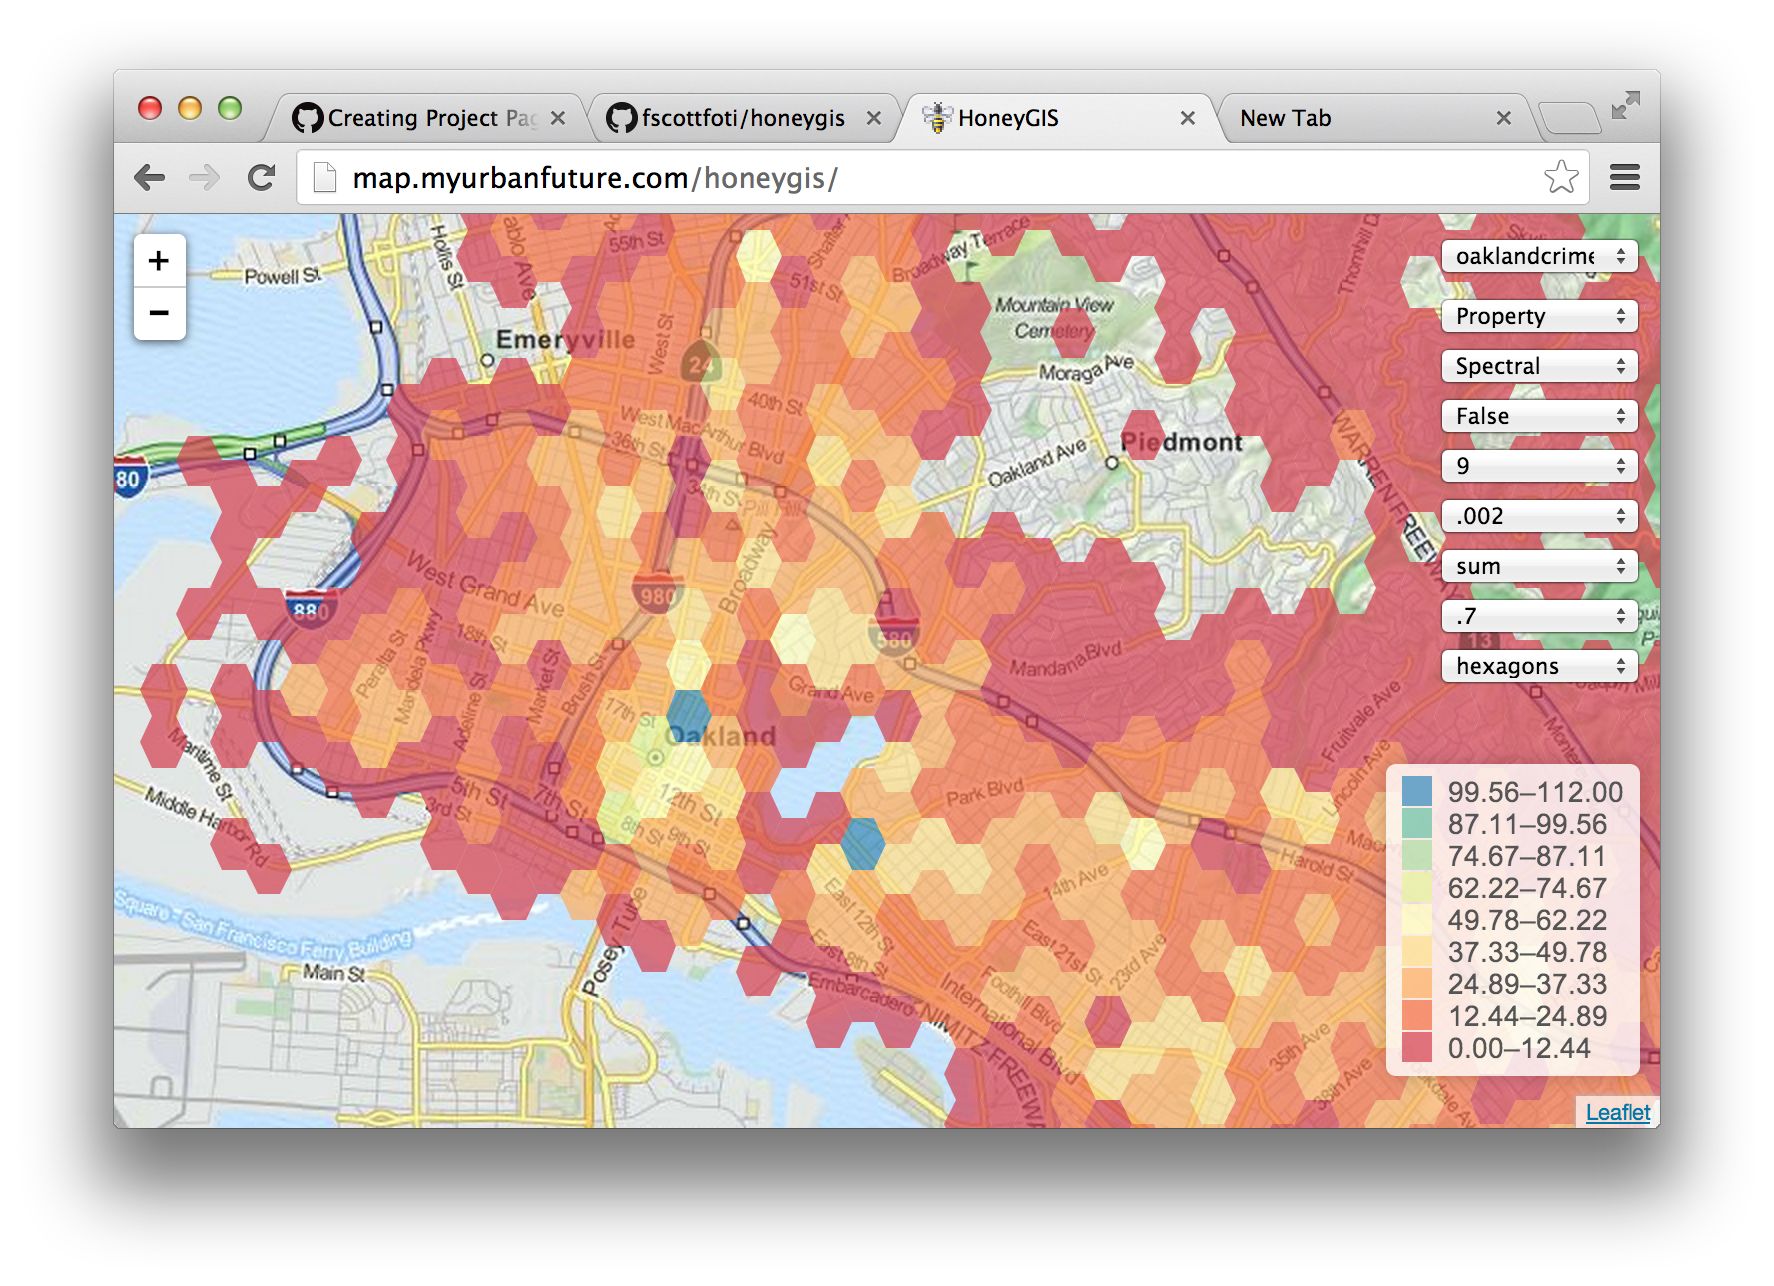
HoneyGIS is the simplest GIS imaginable. It's ideal for medium-sized amounts of point data (around 20-40k points). First you add the data (see below) and start HoneyGIS (also see below). Pick a file in the first dropdown (HoneyGIS will move to the center of data, anywhere in the world), and a column in the second dropdown. A set of colored hexagons will be visualized which represent a summary of the underlying point data.
Or just go and try it.
The following parameters are supported:
- 3rd dropdown: color scheme
- 4th dropdown: quantile or equal interval (quantile is true)
- 5th dropdown: number of bins
- 6th dropdown: size of hexagons
- 7th dropdown: how to aggregate points within hexagon (e.g. sum or mean)
- 8th dropdown: opacity
- 9th dropdown: DON'T FORGET TO TRY THE MARKERS SETTING TO SEE THE UNDERLYING POINT DATA
Run go.sh. That's it. Should execute on any unix-y system (e.g. Mac). Really it's just a webpage so all you need is a webserver.
go.sh does 3 things:
- lists any csv files in the data directory and puts them in the FILES file
- starts Python as a webserver and
- opens index.html.
Like I said before, really you just need to get the files on a webserver.
Put csv files in the data directory, then add them to the file called FILES. If the csv isn't in FILES, it isn't visible. If it's in there it is visible. If you run go.sh, any csv in data gets added to FILES. Each CSV needs fields called "x" and "y" which contain longitude and latitude. If the CSV doesn't have those fields, HoneyGIS will break.