Overlay
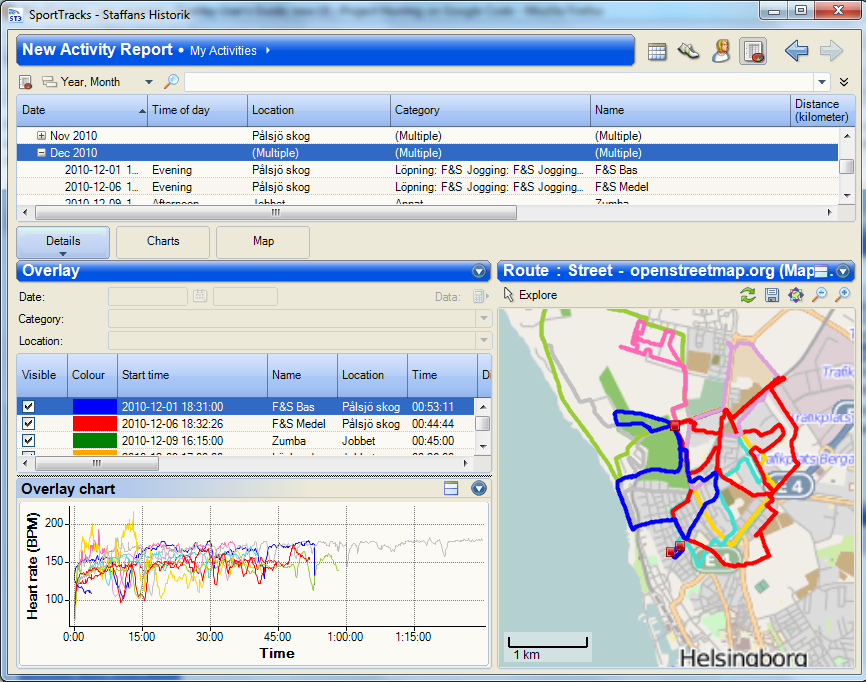
Overlay is a plugin that lets you compare activities using a list for numeric values, a chart for data tracks and the map for routes.
Overlay plugin lets you compare data tracks like heart rate, pace, speed, power, cadence, distance and time between two or more activities. It does so by presenting each of these in the same graph, so you may visually see how well your form is progressing. You can also plot the difference between a selectable reference activity and other activities regarding heart rate, distance and time. It will be easy to determine how much faster you were after 5 km in the last race compared to the previous one.
Using the list you can compare values like, heart rate, distance, pace etc between your activities. If you set a reference activity, you can also see relative values compared to the reference activity.
You can compare the routes taken using the Route window where the routes for all of the compared activities are drawn on the map.
Overlay makes it easy to compare your performance in different races over the year, or maybe the performance in the same race over the years. When you've chosen the relevant activities, you can set one of them as the reference that other activities will be compared to. By default, the first activity in the list will be the reference.
Choose the list columns that you are interested in. The heart difference in time, distance, speed or pace and heart rate rate should be particularly interesting for this use case.
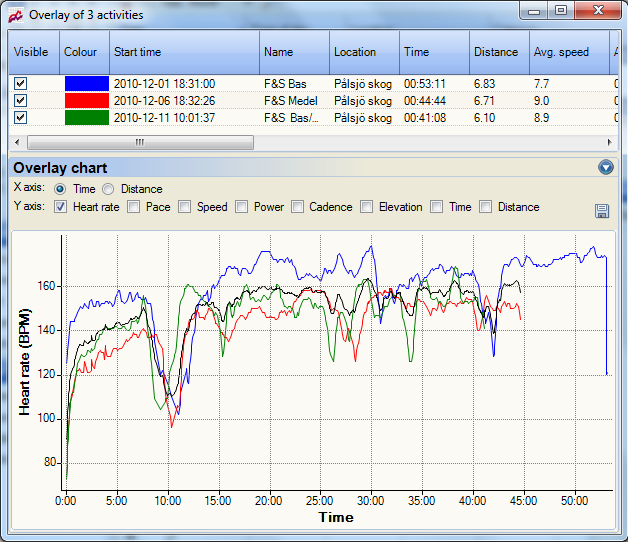
Use the chart in order to compare distance, time, heart rate, pace, speed, power and cadence over the course of the races. You can see if different strategies were used and what the end result was.
If you compare the same race from different years, the map will show you any differences regarding the race route.
One way of monitoring improvement in fitness is by comparing your heart rate tracks of two similar activities (same distance, speed, time of day, and other parameters that may influence the heart rate) but with some time in between. So lets say there are four weeks between the two similar activities you are considering, and you then overlay the two heart rate graph using the plugin. If the graph of the latter is below the first, your form is improving, and vice versa if it is above.
Another way of seeing form improvement is to check how fast you heart rate drops after an exercise. I always get this information after a run, by resetting the laps, and starting it again to record my heart rate when I just walk around a bit and stretch before I go inside. So if you also do this, you can check you form progression using these stretch out sessions.
Overlay can be used from the daily activity view or the activity report view. The activity report view is a bit more flexible in how activities can be selected.
First go to the activity reports and select the activities that you wish to compare. You do this either by pressing down control and then select some activities, or by holding down shift and then select a range of activities by clicking the start and end element. In the activity report view, you can also select a line that has sub-items a line that has sub-items (like the month of December 2010 if the activity report list is grouped by year, month). Once you have selected at least one activity you are able to apply the Overlay plugin as shown in the figure below.
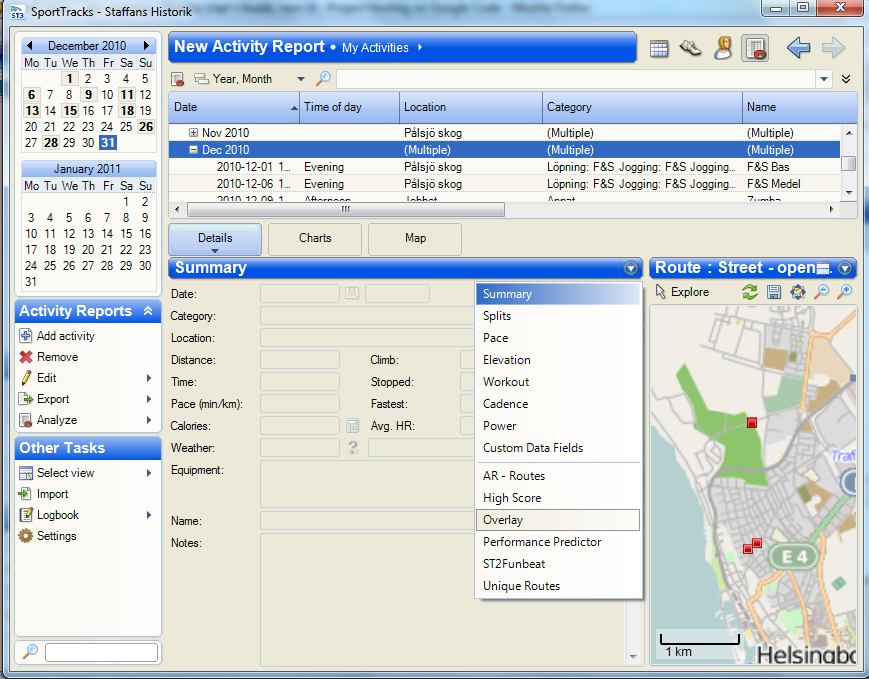
Above: Open Overlay as an Activity Page inside SportTracks.
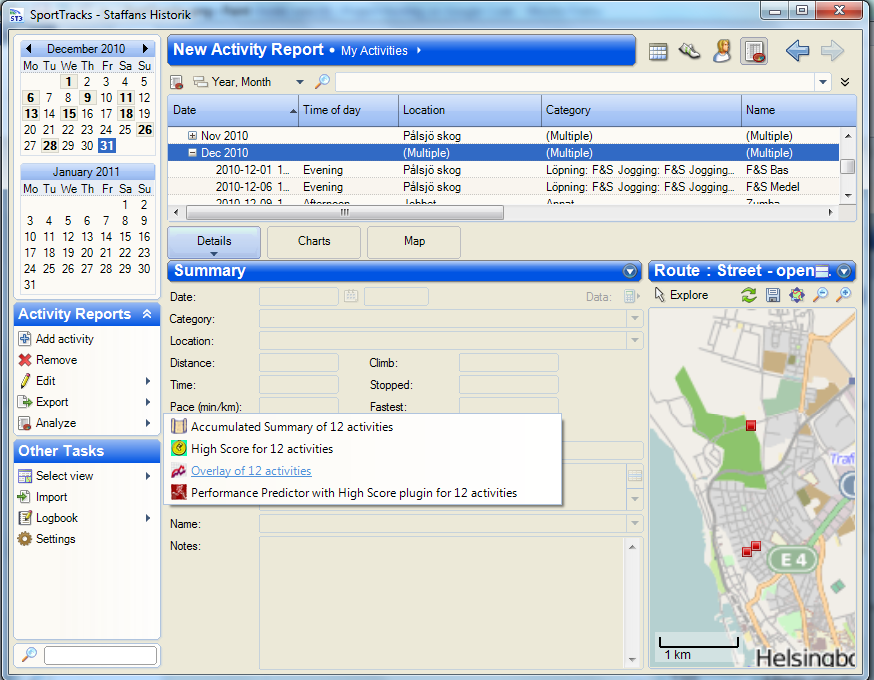
Above: Open Overlay in a popup window containing the list and the chart, allowing a larger chart to be used.
You can customize the list to your own liking by selecting what columns you need and in which order you want them.
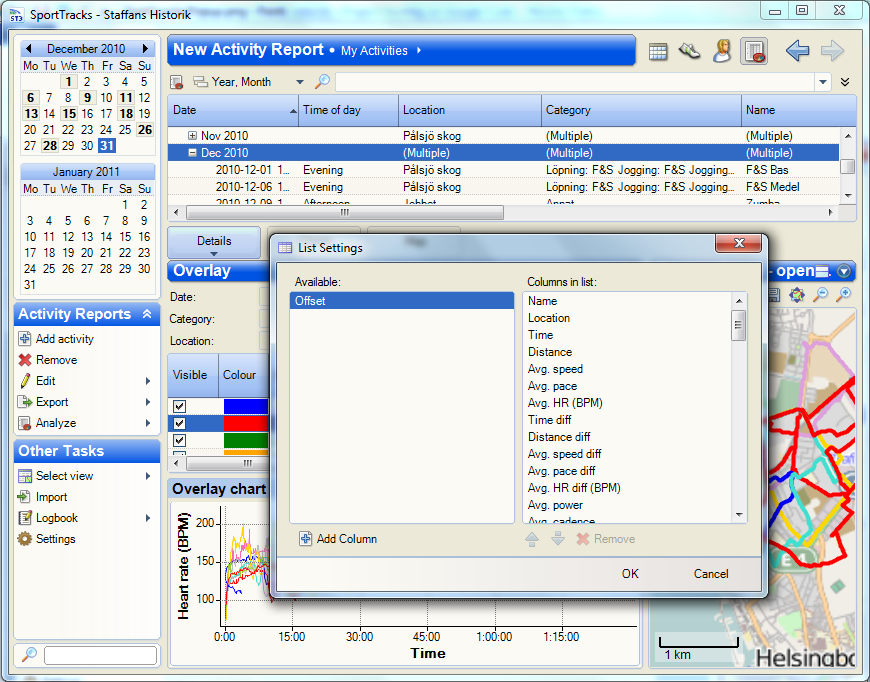
Above: Choose the contents of the list.
The "diff" columns display the difference between the reference activity and the activity on each row. They can be used to make it easier to compare activities. By default the reference is the first activity in the list, but a different reference can be chosen by selecting an activity, opening the list context menu and choosing Reference Activity.
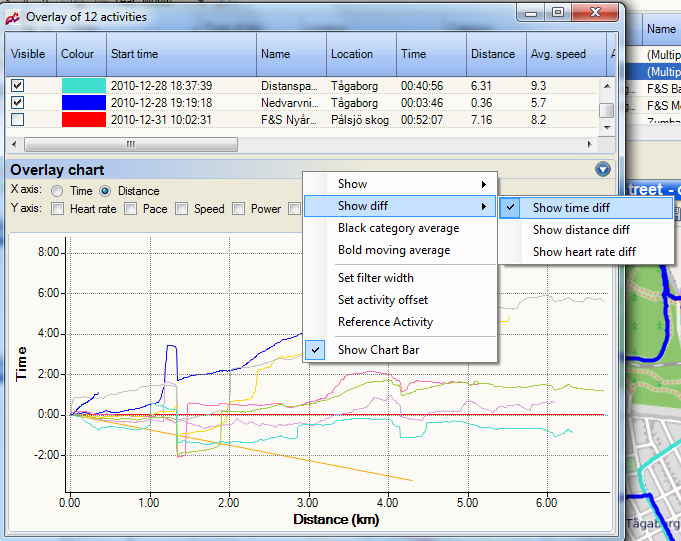
The chart x-axis can be either time or distance. Your choose with the radio buttons in the bar above the chart,
What data series that should be shown is selected using the context menu, which is opened by clicking the arrow to the right of the text "Overlay chart".
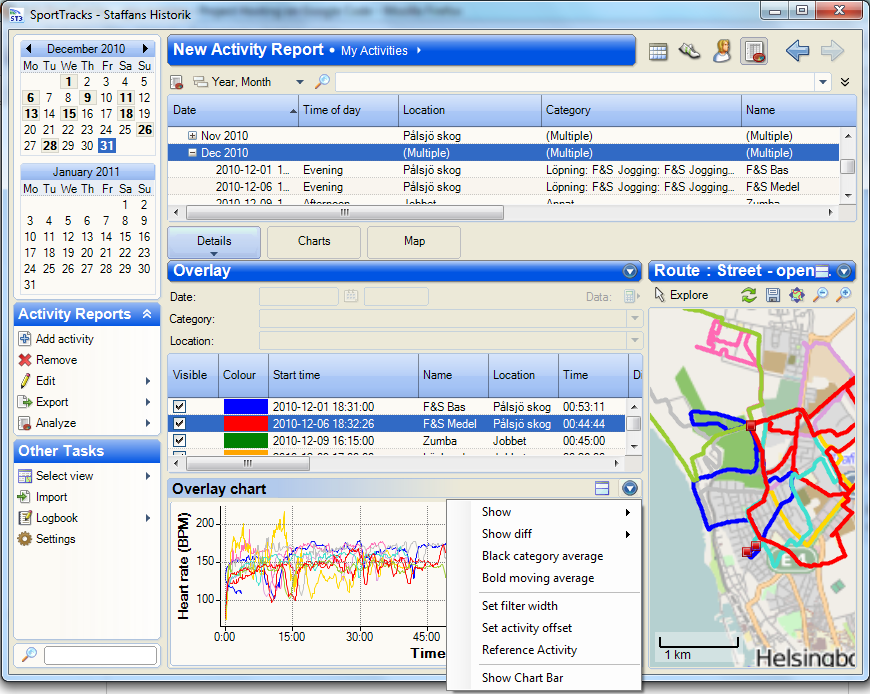
Above: Opening the menu.
The most common data series can also be selected in the chart bar just above the chart itself.
In the Show diff menu, you can select data series that for each point in time (or distance) show the difference between each activity and the reference activity. You can select time, distance or heart rate.
Above: Choose the tracks to plot in the chart using the bar or the menu.
The reference activity can be chosen using the context menu of the list. First select the desired reference activity, then open the context meny and select Reference Activity.
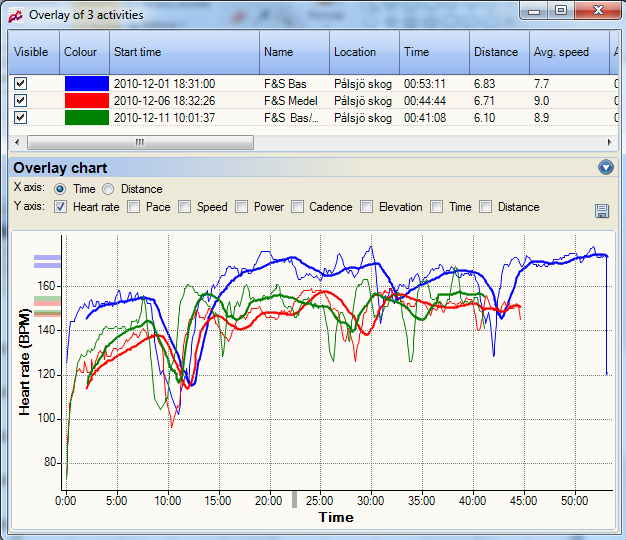
It is possible to see a category average for a collection of activities. Average is basically the average of each activity in some category, so, e.g., if you have three activities chosen and selected the heart rate track, then the category average is the average of each point of the three graphs. The category average is displayed as a black line.
The moving average filters each single graph. If the filter width it is set to 0 seconds or 0 meters it will show the average from the start of the activity; i.e., each point is the average of all the preceding points on the graph. This is similar to looking at your average speed or average heart rate on your watch. If you set the moving average to something bigger than 0, then the average is the average over the past seconds or meters. If the moving average is set to 120 seconds then the average of each point, will be the average of the last two minutes.
If you want to compare two activities but the interesting parts are not located at exactly the same time or distance, it is possible to set an offset on one of the activities. Select the activity in the list or the chart, open the menu and select "Select activity offset". A popup dialog will open, allowing you to enter an offset. The offset will be in time or distance depending on your current x-axis selection.
The list contains a Visible column with checkboxes. Deselecting a checkbox removes the corresponding line from the chart and the route from the map. The deselected activity will still be included in calculations like category average.
The selected activities will be displayed as routes on the map, assuming that they have GPS tracks. The routes will be color coded in the same way as in the chart and the list. The route for an activity can be removed by deselecting the checkbox in the Visible column of the activity in the list.
Note for ST before 3.0.4059: If you select individual activities instead of a group, the activities will not be displayed on the map. This is a limitation in the core SportTracks application, the plugin cannot overcome that. A workaround is to use Overlay in a popup (from Analyze menu), then select a single activity or a group.
The plugin has some features put in the list menu item advanced, to use in special cases.
- Process certain activities in other plugin, use as search selector. For the activities selected in Overlays activity list, the menu item will select the activities in the SportTracks list. This will allow processing in other plugins. One use case can be to mark all actities that a "special" in some way, make sure only they are selected and use Edit->Find and Replace to for instance change the name for many activities.
- Integration with Unique Routes. If Unique Routes plugin is installed, you can add activities similar to the reference activity to the Overlay activity list. Alternative ways of doing this could be to send the activities from Unique Routes plugin.
You can also use the Unique Routes plugin if you want to find activities with routes that are similar to one of your choice. Once you have found the activities, they can be sent to Overlay for further analysis. For further information, see the Unique Routes wiki.
- Setting offset from Unique Routes Common Stretches. The Common Stretches feature in Unique Routes is used to find the first common part of the marked activities compared to the reference activity. So if the first part differs, this feature will auto-sync the offset.
For patches, bug reports or feature suggestions, use the Google Code issue list. For feedback please use the thread for this plugin at SportTracks forum here.
The Trails plugin has more or less all features in Overlay and a lot more. You may consider using Trails instead.
Trails compares activities, normally based on positions. While it can be used to compare GPS activities without positions, Overlay is simpler in this aspect. The plugins share many features and code, as the same developer is involved in both, but most development has been put into Trails. Trails plugin also allows you to compare sections and splits of activities.
The Split trail is similar to the Overlay functionality.
Quick guide:
- Select the activities you are interested in (Daily Activity or Reports).
- Select Trails activity page
- Select the Splits trail in the dropdown list.
- Ctrl/shift click the activities you want to see in the graphs and on the map.
See also the Tutorial for more information.
- Unique Routes View similar routes. Much of the functionality is integrated in Overlay plugin.
- Trails see Trails Plugin.
- Dot Racing Non-free plugin with additional features, like integration with other old man biking plugins and as the name suggests, dot-racing.