Add toggleable on-screen debugging information/statistics while the project is running #63
Comments
|
Unity and Unreal both have this feature, but I found myself missing it in Godot. Also one or both of them allow you to see where the draw calls are coming from (even a basic Spatial/Particles3D split would do wonders, not the whole battery of details that RenderDoc can show) It is possible to get a fps/vertices/polys/draw calls display done in GDScript, but I am not too sure about the other screenshot (OS/CPU/GPU/RAM). For actually shipping Godot games, the latter would be even more useful than the former (players just sending you a screenshot and/or writing it down instead of wondering 'which card does this game use' which can be common in multi-gpu machines). |
My opinion is that more debug features => better for developers and players. I tried to follow guidelines for this proposal (even though the form is not 100% correct, apologies) and keep it as simple as possible for this time. However, I wouldn't be really scared to talk about even more advanced debug features/options but maybe it's too early for that. I have huge hopes in Vulkan implementation which can open for us large palette of new possibilities. Even though you can maybe display some information on screen via GDScript, I think it would be safer to have it as essential part of engine itself, especially if we talk about hardware detection/resources management. I find it to be "safer" solution as well, compared to only allowing users to make their own GDScripts. + I think fps/polys/draw calls/etc. type of info is very important and maybe there is certain benefit in case where engine handles this directly compared to situation when script is asking engine for the information and then drawing it on screen. |
|
I remember hearing about plans to add a more precise profiler in Godot 4.0, but I'm not sure. As for exposing graphics card and API information to GDScript, this could likely be implemented with relative ease. See godotengine/godot#28404. |
|
Please update your proposal using the template provided or else it will be closed in accordance with the first rule of godot-proposals (see rules here). This seems like a useful idea so it would be a shame to close :) |
Updated. If there is something I forgot, please let me know. And thank you. |
|
Related issue: godotengine/godot#21486 |
|
@Zireael07 That proposal isn't related to this one. That issue is about retrieving the display refresh rate, so you can do things like limiting FPS to the display refresh rate or setting the physics FPS to match the display refresh rate. This is probably not too difficult to add; it mostly involves digging into SDL's source code and picking up the relevant parts 🙂 |
|
Ah, I misread, I thought they wanted the refresh rate for debugging purposes :) |
Afaik Vulkan API provides insane amount of ways how to log and/or display all kinds of information, not only refresh rate (I made basic 3D engine using Vulkan long time ago and I was surprised how much information I could get just after initialization process in core of engine, much easier process than D3D12). As game developer seeking optimization, you probably care about everything related to hardware and usage of hardware resources, not just refresh rate. Refresh rate is more of a result but other information can help you understand why your refresh rate went down. This is one of the reasons why I am looking forward for Vulkan implementation in Godot because even in case this will not be default part of Godot, if I'm very lucky I might be able to implement it myself. I'm pretty sure you are aware of it, I just wanted to clarify more while I'm here. Anyway, I would like to thank to everyone who participates in process of implementation of Vulkan in Godot, that's massive work. |
|
I've been learning Godot recently, and I found this will be helpful. There are data in editor's
|

|
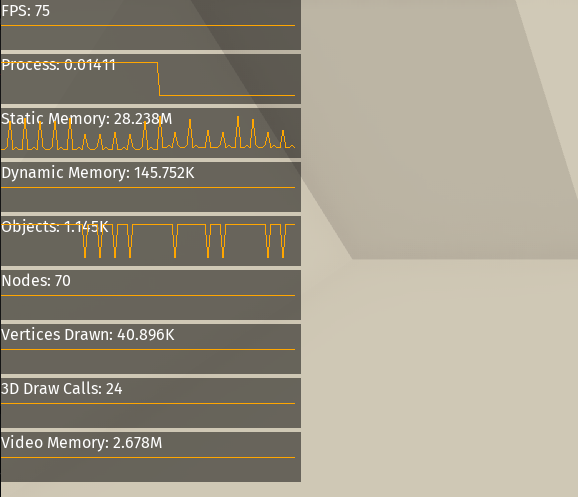
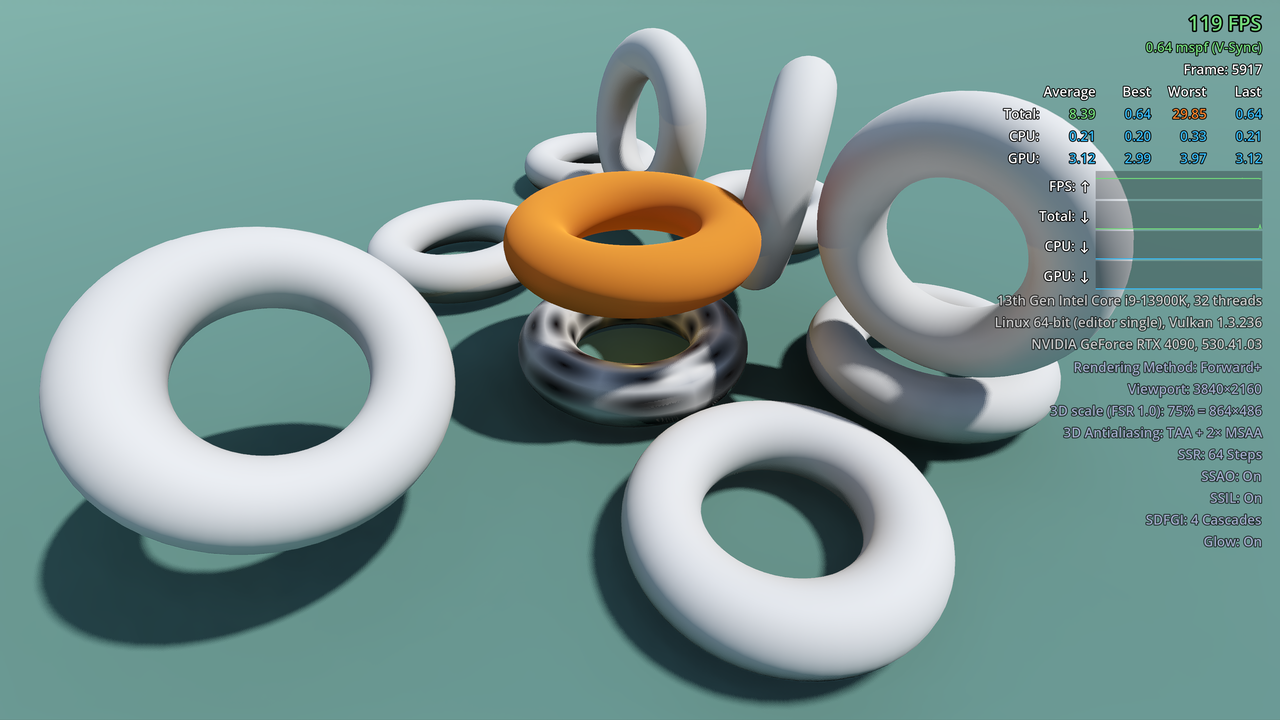
I've published a Godot 4.x add-on (and an associated demo project) that features a debug menu similar to the one proposed here.
|
|
@Calinou This is absolutely huge, thank you, I can not wait to try it out. At the end, I'm glad it works as add-on. |
Describe the project you are working on:
3D Racing Game.
Describe how this feature / enhancement will help your project:
This feature will help me to optimize the project, specifically for variety of hardware specs. It will help developers to understand hardware limitations better and it will also help them to set the minimum hardware requirement for their project more accurately. It will help developers to save player's resources and make their projects more stable and responsive, which is highly important factor in game development. This feature might resolve some bugs or issues related to rendering, possibly network connection, etc.
Show a mock up screenshots/video or a flow diagram explaining how your proposal will work:


Describe implementation detail for your proposal (in code), if possible:
It should be essential part and optional feature of Godot Engine itself.
I would like to see some very basic information on screen while the game is running in debug mode. Currently you can print for example FPS to console but some information should be printed (as option) directly on screen, such as: FPS, CPU Load, allocated RAM, Graphics card info, VRAM, Network packets sent/received, number of triangles/objects drawn, Screen resolution, OS+version etc.
Maybe you cannot share the whole project folder between computers, maybe you just want to have debug executable so you can test it on variety of hardware, while being able to see which parts of your game might cause some issues, which also leads to better optimization.
As far as I remember Unity had this feature (I'm not sure if it's still part of this engine) and I'm sure various other proprietary/in-house engines have this feature. Debugging is very important part of development process and this basic tool/option could help Godot in the future and it could be the step forward in direction of more advanced debugging techniques.
If this enhancement will not be used often, can it be worked around with a few lines of script?:
Possibly it can be implemented with a few lines of scripts, HOWEVER I am strongly convinced this feature should be part of engine itself and not a library and/or script workaround.
Is there a reason why this should be core and not an add-on in the asset library?:
I believe add-on in asset library will not solve the issue of non-accurate and/or less reliable solution.
The text was updated successfully, but these errors were encountered: