4.6.2 -> 5.1.0: Graph, axes unit "none" does not show original decimals precision anymore #11792
Comments
|
I had a quick look at this and seem to work for me but I haven't tried to recreate the issue with your dashboard json yet. The decimals field on the axis tab does not control the number of decimal places for legend values. That field is on the legend tab. But it seems to be the same issue for the axis values as well. |
|
Hi @daniellee , thanks for having a look. |
|
@tw-bert I can reproduce this. It seems to be connected to a change we made to the code that calculates the number of decimal places for the y-axis (this calculation is complicated so it is only wrong sometimes). I added it to the milestone for the next release. Thanks for reporting this! |
|
In my particular case, I was showing ping's ms and found the same problem, but now I need to set legend->values->decimals to 3 to see 3 decimals in tooltip or legend. I upgraded from 4.6 to 5.1 also. |
What Grafana version are you using?
grafana_5.1.0_amd64.deb
What datasource are you using?
InfluxDB
What OS are you running grafana on?
ubuntu.xenial64
What did you do?
Copied grafana.db from our live system to a separate VM, upgraded to Grafana 5.1.0 to check for issues
What was the expected result?
To see the same data with the same precision. '1.01' must stay '1.01' in the legend and the tooltip.
What happened instead?
'1.01' becomes '1' in Grafana 5.1.0
Grafana 4.x:
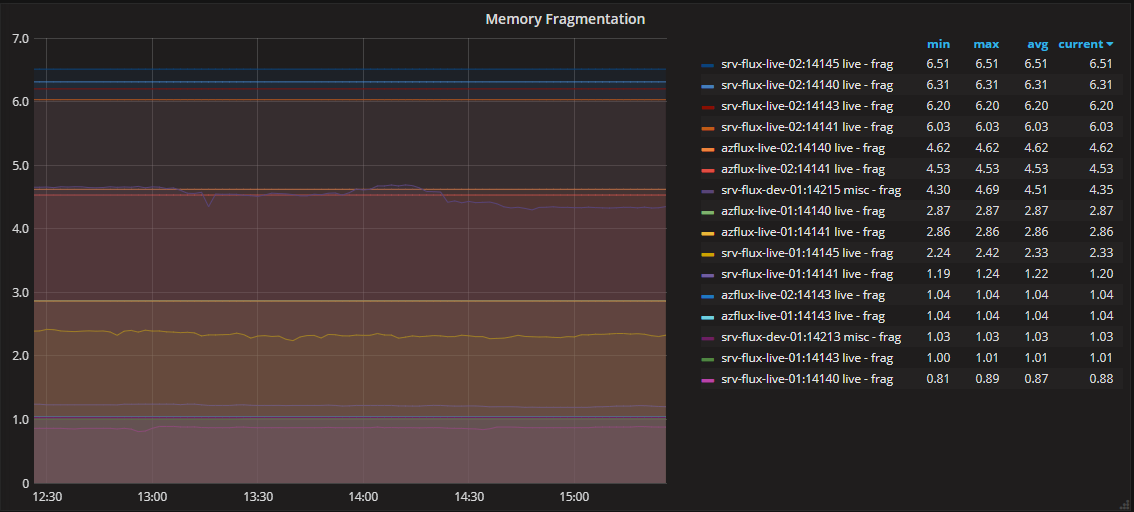
Grafana 5.1.0:

Both Axes are configured the same:

Here is the full JSON of the panel (Grafana 4.6.2):
{
  "aliasColors": {},
  "bars": false,
  "dashLength": 10,
  "dashes": false,
  "datasource": "$datasource",
  "editable": true,
  "error": false,
  "fill": 1,
  "grid": {},
  "id": 65537,
  "interval": "$inter",
  "legend": {
    "alignAsTable": true,
    "avg": true,
    "current": true,
    "hideEmpty": true,
    "hideZero": true,
    "max": true,
    "min": true,
    "rightSide": true,
    "show": true,
    "total": false,
    "values": true,
    "sortDesc": true,
    "sort": "current"
  },
  "lines": true,
  "linewidth": 1,
  "links": [],
  "nullPointMode": "connected",
  "percentage": false,
  "pointradius": 5,
  "points": false,
  "renderer": "flot",
  "seriesOverrides": [],
  "spaceLength": 10,
  "span": 10,
  "stack": false,
  "steppedLine": false,
  "targets": [
    {
      "alias": "$tag_host:$tag_port $tag_env - $col",
      "dsType": "influxdb",
      "groupBy": [
        {
          "params": [
            "$interval"
          ],
          "type": "time"
        },
        {
          "params": [
            "null"
          ],
          "type": "fill"
        }
      ],
      "measurement": "redis_used_cpu_sys",
      "orderByTime": "ASC",
      "policy": "default",
      "query": "SELECT mean(\"mem_fragmentation_ratio\") as \"frag\" FROM \"$rp\".\"redis\" WHERE host =~ /$server$/ AND $timeFilter GROUP BY time($interval),* fill(none)",
      "rawQuery": true,
      "refId": "C",
      "resultFormat": "time_series",
      "select": [
        [
          {
            "params": [
              "value"
            ],
            "type": "field"
          },
          {
            "params": [],
            "type": "mean"
          }
        ]
      ],
      "tags": []
    }
  ],
  "thresholds": [],
  "timeFrom": null,
  "timeShift": null,
  "title": "Memory Fragmentation",
  "tooltip": {
    "shared": true,
    "sort": 0,
    "value_type": "cumulative"
  },
  "type": "graph",
  "xaxis": {
    "buckets": null,
    "mode": "time",
    "name": null,
    "show": true,
    "values": []
  },
  "yaxes": [
    {
      "format": "none",
      "logBase": 1,
      "max": null,
      "min": null,
      "show": true
    },
    {
      "format": "none",
      "logBase": 1,
      "max": null,
      "min": null,
      "show": false
    }
  ]
}
The text was updated successfully, but these errors were encountered: