Elasticsearch two metrics with the same name+config only create 1 field #16331
Comments
|
@marefr any ideas? |
|
Confirmed bug. However there's probably a lot more bugs using only group by terms and table panel 😄 |
|
Just to inform you that the problem also happens in Elasticsearch 7.x. |
|
By looking into the issue itself, my feeling is the problem resides on how the "metric name" for the Elasticsearch datasource is generated... (This is based on some limited knowledge about Grafana, so please feel free to correct any of my affirmations). Basically if I have this query: I get two metrics named "Bucket script", which then collide when being rendered in the Table, whereas in this case I think the real "metric name" is "10" and "11" (adding aliases per metric could also be a good addition when generating the query to ES, but at least having "10" and "11" as column names they can be aliased by the table plugin itself). This anyhow seems to me quite a "breaking" change and might not be the best way to go forward, but wanted to get some opinions. |
|
This appears to be working now, @Elfo404 I think we can close this.
|
|
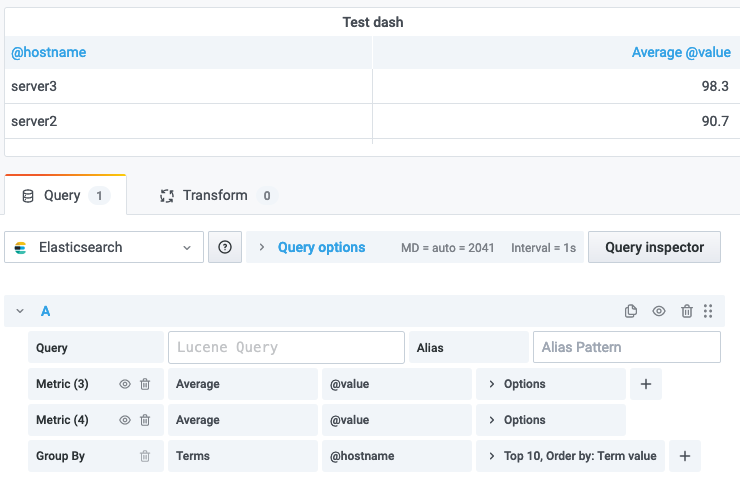
I'm afraid is not really fully solved. Note that doesn't only happen with Bucket Script (although the following example maybe doesn't make much sense):
This would maybe be a nice addition, but given it should work "out of the box" and the table provides already this functionality, maybe appending the aggregation's Thoughts? |
|
This one is related as well ? #33660 |
|
What happened: For Example. Now in the transform window, I get the options as Count, Count1 And Count2. Table Transformation 1 - ( use outer join with a common field to connect the queries A,B,C to give the result in one view) Now when the panel refresh, when there is no data for one of the values, let's say received tickets( Query A, gives no response) So the panel shows data for Received and Acknowledged Tickets. whereas, the panel is supposed to show the acknowledged and resolved tickets only, since there is no received tickets. What you expected to happen: Here in this case, if we can have a naming convention that can be set by the user for each metric ? How to reproduce it (as minimally and precisely as possible): Anything else we need to know?: Environment: LOCAL, EPhemeral, NPE, PROD Grafana version: Latest ( 7.5.5) |
|
just want to ask, is this causing problems to anyone right now? ( let's not mix in the problem from #16331 (comment) , for that problem there's a separate issue at #33660) i just wonder, because, currently, to encounter this problem, you have to have two metrics with the same settings in them, so i wonder why that happens in practice. thanks! |
|
#66973 fixes this problem. (NOTE: we are adjusting the elasticsearch datasource to process queries in the backend ( |
summary by @gabor : when you add two metrics with the same "config" and a terms-aggregation (this is important, the date-histogram aggregation does not have this problem), for example, you add the
metric=average, field=countermetric two times, in the resulting dataframe we only have 1 field. we somehow deduplicate the two metrics into one. we should not do that. the question is: how should we name these two fields then?(for an example see #16331 (comment))
What happened:
When querying with term grouping and using the table transform "table" option (grouping by term, for example), only one of the bucket scripts results are displayed, even though the results are return correctly (via query inspector).
This seems to happens because grafana uses a generic alias for the bucket script.
A quick fix would be to just allow the user to define the bucket script alias.
How to reproduce it (as minimally and precisely as possible):
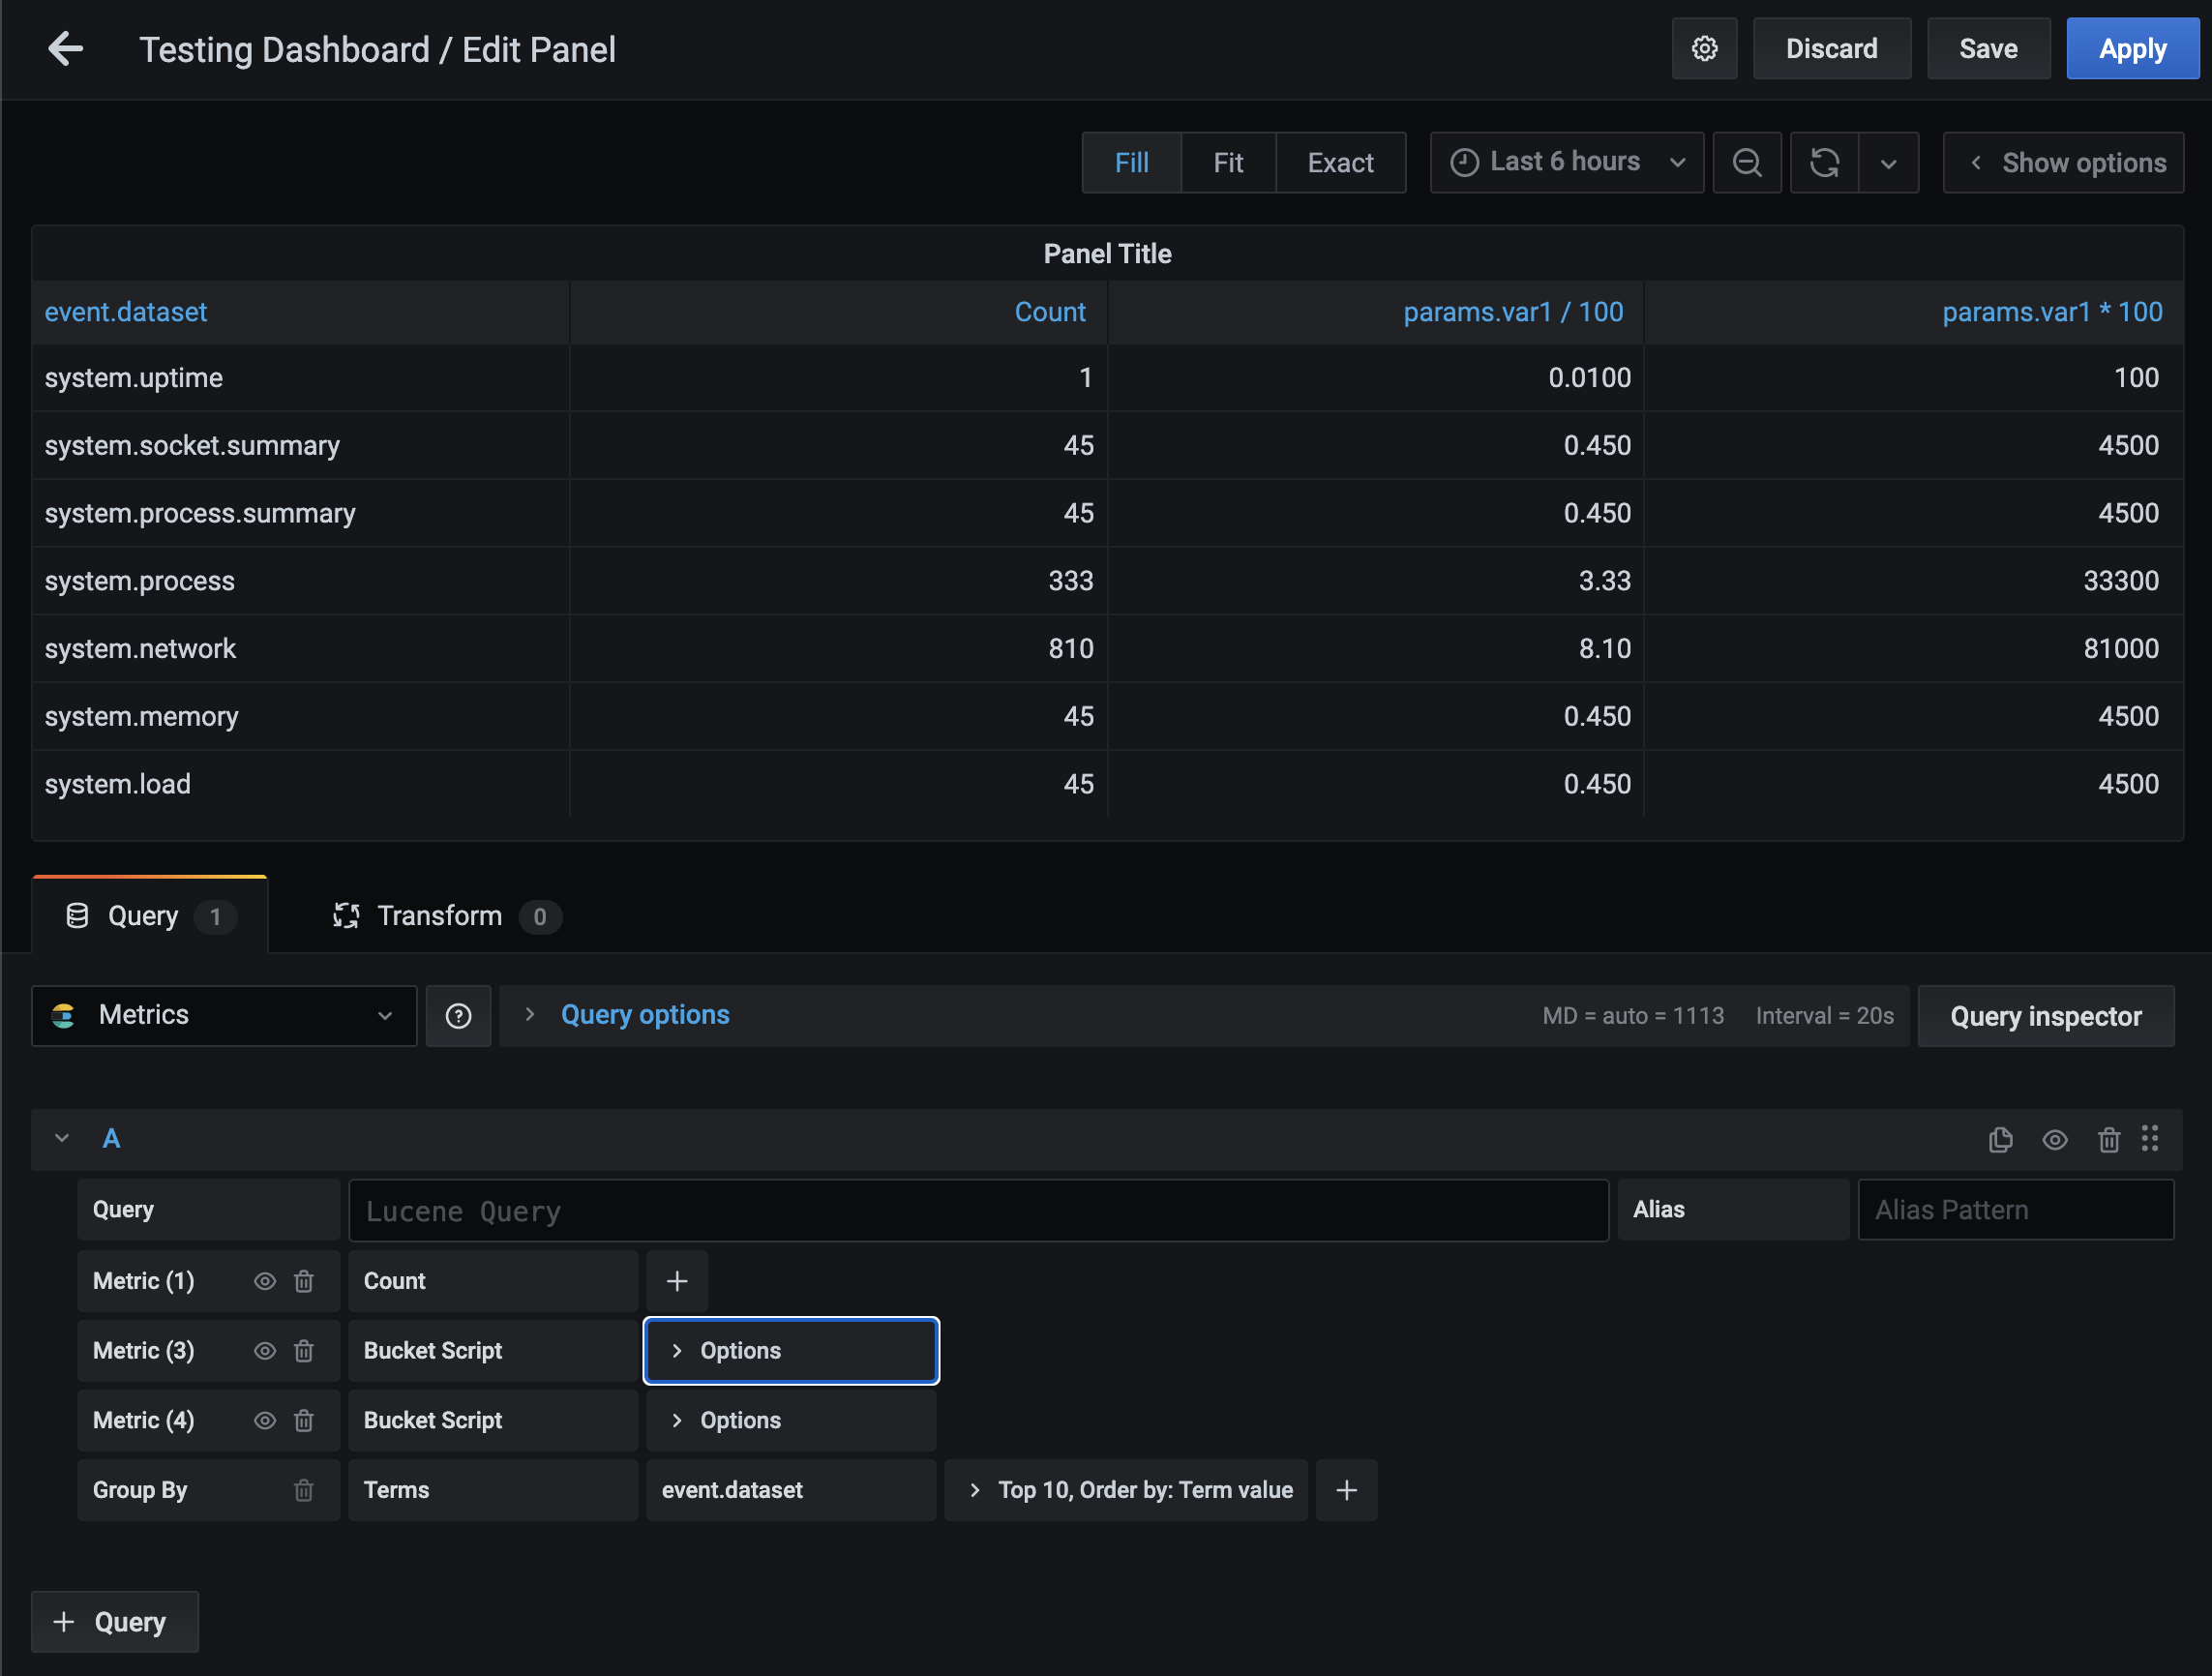
The screenshots below can also be used as an example of a minimal setup (the results are displayed with only 2 decimal places in the examples, that's why the results are always 1 / 0, but that does not matter to reproduce the problem):
Time series to columns -> Grouping by Date Histogram (Working just fine, as you can see by the last two fields in the table):

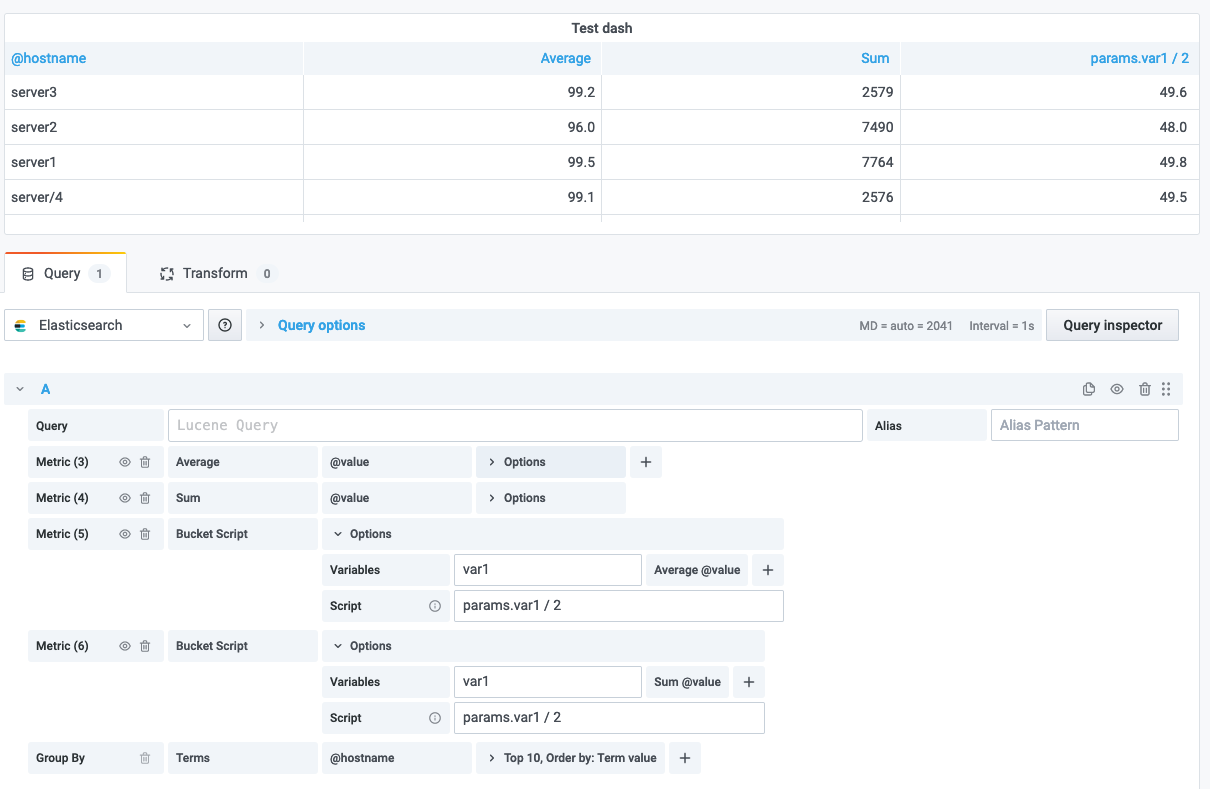
Table -> Grouping by Term (Not working, only the first bucket script result is shown):

Query inspector result when grouping by term:

Environment:
The text was updated successfully, but these errors were encountered: