You signed in with another tab or window. Reload to refresh your session.You signed out in another tab or window. Reload to refresh your session.You switched accounts on another tab or window. Reload to refresh your session.Dismiss alert
Situation:
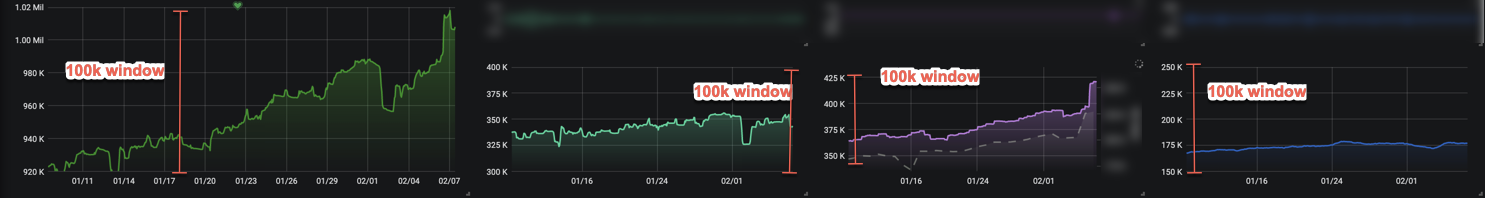
We have several graphs showing numbers of the same unit. We therefore usually set y-axis min and max values so that the MinMax-Difference everywhere is the same (e.g. 100k). The absolut numbers in the graph can be very different but this allows better comparison among different graphs.
Example:
Complication:
If one graph now spikes or goes low, we need to manually adjust min + max values to maintain the 100k window on a higher or lower scale.
What would you like to be added:
In our opinion it would be a great addition if you would be able to define a window size (Max - Min), while the graph
will be automatically centered around the median value or
based on the max value (it should always be in the viewport in our case).
Relations:
If found these to issues to be related but from my understanding they wouldn't fix our usecase:
Hi everyone!
Situation:
We have several graphs showing numbers of the same unit. We therefore usually set y-axis min and max values so that the MinMax-Difference everywhere is the same (e.g. 100k). The absolut numbers in the graph can be very different but this allows better comparison among different graphs.
Example:
Complication:
If one graph now spikes or goes low, we need to manually adjust min + max values to maintain the 100k window on a higher or lower scale.
What would you like to be added:
In our opinion it would be a great addition if you would be able to define a window size (Max - Min), while the graph
Relations:
If found these to issues to be related but from my understanding they wouldn't fix our usecase:
I'm looking forward to feedback. Let me know if there are questions! Many thanks!
The text was updated successfully, but these errors were encountered: