Graph: Limits on Y auto scale (min max) #979
Comments
|
Thanks, interesting idea. Seems a little edge case. But I agree, could be useful at times. |
|
Yeah, I just wanted to get my thoughts on paper. 🍺 |
|
I do not think this is a edge case. |
|
+1 A lot of the time series data which I visualize in grafana sits at zero+noise, and this makes the graphs look messy and unclear. |
|
+1 from a Grafana.net user.
|
|
I understand that this function is probably only useful for very few people. But I've been hacking on this a bit. And I've come up with something that works for me. The commit in my fork adds a Y-Span box to the Axes tab. Where X is a integer or float: Example of why i need it: Any interest in a PR? |

|
@thoj That would be a great addition. We use thresholds for some graphs and would like to always show it, but still scaling the graph to show points much higher than the threshold. ">X" would work well here (and <X for negative thresholds). |
|
@lpalm Yeah! I'll add a pull request to try to get the discussion going, |
|
implemented in #6051 |
|
Is this in the 4.0.x release train? I'm trying to use "<" and ">" in the Y-axis settings but to no avail. |
|
no had to revert it, we wanted a more user friendly input / UI than just hidden feature that the input field supports expressions like |
|
Could we have this in a dropbox besides Y-min and Y-max? |
|
Hi, I created this feature for graphite project a while back and came to the following conclusion that I would never ever want to use yMax, since I always want to know the values of the graph, which I won't with yMax. I mean, if I set yMax to x and the counter exceeds x would anyone not want to see how much it exceeded the limit? |
|
I use yMax when I have percentages to make sure that the 100% is always exactly at the top of the graph (even if there is a small blip) |
|
I also need yMax. This is due to some noisy signals that have very tall spikes that distort the graphs. |
|
@iksaif yes, but that shouldn't require yMax to be fixed. Since your graph won't ever exceed @thoj that doesn't sound like a reliable metric? Wouldn't you instead want those spikes excluded from the graph or if you care about them actually know the value? |
|
@Kvistian they would, it happens, for reasons, that it displays 100.02%, and I like the fact that I'm able to cap that. Also there are times when I only want to see when I want to "zoom in" and I can use yMax to do that. |
|
Ok, but you agree on that most cases would require a dynamic yMax? In that case, would it make sense to make the yMax dynamic and a new function like staticYMax or fixedYMax for those edge cases? Thus, having a dynamic yMax as default since it's the general use case. |
|
Sounds like setting the lower bound of the top of the graph could be useful but I wouldn't change the semantic of the existing yMax (which, really is the maximum y that can be displayed). Would be interesting to find how this thing is named in other similar software |
|
we might be able to squeak this into 7.4 (#30238) |
|
I am not a fan of the UI as described in #30238, as it applies to both the max and the min unilaterally. eg, there's a very real use case for setting the min to exactly 0 and soft clamping the max to 100. This sort of feature is very easy to succinctly describe as a text expression in the min and max fields and very difficult to translate into a UI. |
can you describe the specifics in more detail? the implication being that you'd have negative values but still want to clamp min to 0 and anything below 0 gets clipped by the chart edge? softMax of 100 and softMin of 0 would work fine unless you were specifically looking for the above case. however, if you dont want to render negative values it may be possible to just use a transform to preprocess the data and clamp negatives to nulls or 0s. |
|
The "softness" or "hardness" of the min and max should be independently controllable. |
|
It's very useful to clamp both max and min combined with soft max and softmin. Specifically to hide noise. If you get some impulse In the data that competly hides the real data until the impulse is gone from the data. See my example from 4 years ago: https://cloud.githubusercontent.com/assets/153440/16985695/7ce60908-4e82-11e6-9b8d-60334877008b.PNG Column 1 row 1 and 3 for example. Please please don't fall into the trap of trying to make this too simple. For true data trending you need both soft limits and clamping! 4 years ago I had to write my solution because of this issue that I tried to fix in grafana 😑 Mention: #30238 |
|
@thoj do you happen to have the datasets for those graphs so i can play around with a few variants. i see there are tests in #5720, do they cover all cases? the current Time series field config looks like below. the Min/Max under "Standard options" are the hard limits (clamps). adding
|

Agreed, this is what I was trying to say before.
+1
+1 |
|
@leeoniya maybe not the exact same data but I can dump out something similar. Csv OK? |
|
yep, csv is fine. as long as it's easy to correlate the hard & soft min/max settings you want associated with each dataset to remove some guesswork. |
|
Hi One thing before you look at the data. In my case 4 years ago I wanted the min/max and softmin/softmax to follow the latest value, not all the values. This was to avoid "Steps" in the data getting hidden away. Where the average value over some time might be 4.5 and you want to have to softmin at +/- 0.5 and max at +/- 1.0 of the latest value. This is to show relevant changes (+/- 0.5) in the 3.5-5.5 rage and hide big impulses. But the average might suddenly change to 3.5 and then you want soft min to still be +/- 0.5 but you want to change the range to 2.5-4.5. I hope i made myself understood. Said in another way. I want Max/Min to be +/- 1v relative to the latest value. This might be a too special case. I have to find some better data later but here is one that should be an example of what i described above, with step and impulse: So the goal is to show changes without destroying resolution because of impulse noise and not make tiny (+/- 0.05) changes become huge: Impuse_and_step.csv: |
|
thanks, we'll take a look.
yes, this is definitely too niche for general inclusion, at least for now while all options are in a flat "show everything" layout -- even moving forward with 2 instead of 1 additional field needs a very strong case (i do think there is one here). for "latest value" mode, the compromise would be to make sure the hard limit is not way larger than the soft limit, so you can still get an acceptable level of resolution even if you have historical spikes still within the view. another side-effect of setting soft limits, that hopefully everyone is aware of, is that it will limit the ability to "zoom" vertically to increase the vertical resolution beyond the configured soft limits. another question i have, relates to the extra "padding" normally added to the min & max, so ensure the y scale range is not exactly matched to the data range. uPlot's soft ranging function will try to keep this buffer in place for soft limits. example case: data max: 8 once data max goes > 8 (and the padding is still max + 2), then the scale range will begin to grow past the soft limit, since the padded max is greater. this is desirable in most cases, i think because it allows potentially some extra headroom even in the soft limit case. however, i can see people wanting the data max to literally hit the soft limit, but then the issue is that it would "snap" from 10 -> 12.1 (with the padding) once data max goes 10 -> 10.1. another option is to set padding to 0 if there is a soft limit set. this would provide pretty straightforward behavior, but would peg the top of the scale range to the data max when it's between soft and hard limits. i'll have to do a few variants and see which feels better, i think i prefer the smoother transition instead of letting the data max touch the soft limit (and squashing the padding to 0) before expanding the range and re-adding the padding in an instant. |
|
let's start with what your dataset looks like.
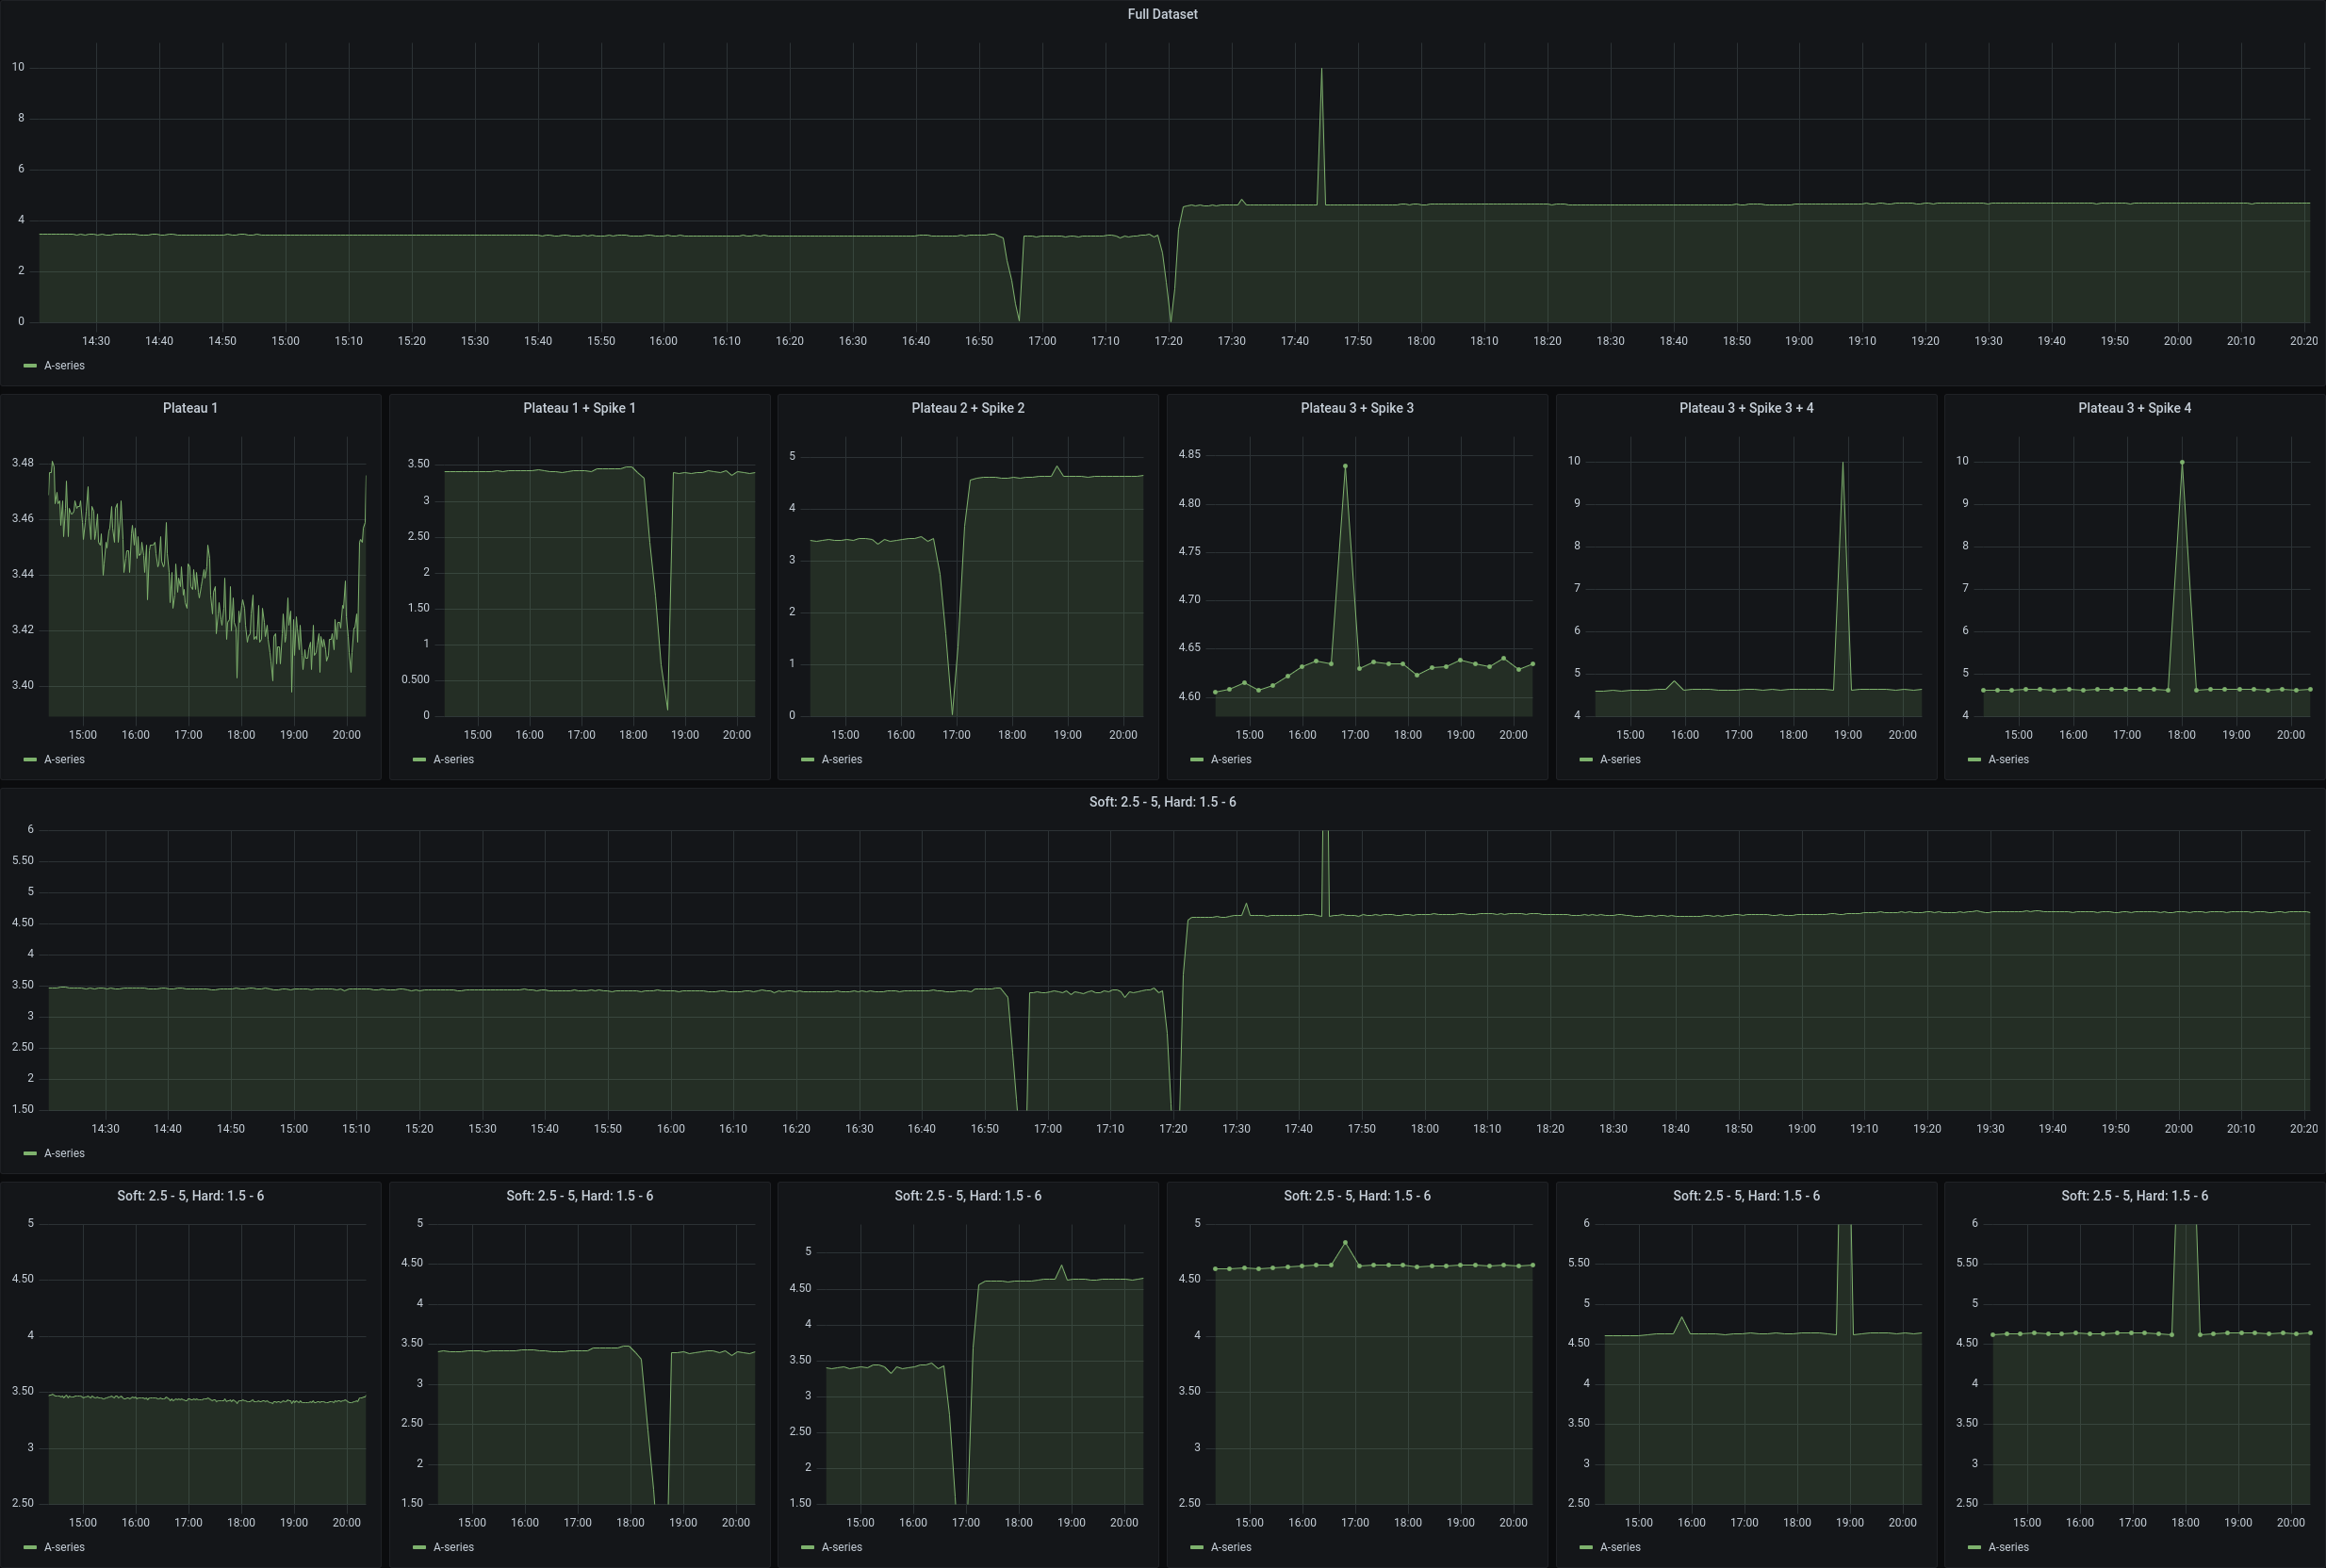
the implementation we're going to do will be a static i'll elaborate a bit why imo your dynamic soft limits are problematic. in short, this method removes a level of expected stability in the axis range. your ~3.5 plateau might look like this and then shortly afterwards your ~4.7 plateau might look like this: the only discernible difference would be the min/max axis ticks, it would be extremely easy to miss such a tiny distinction for a whopping jump of 1.2 while usually staring at blips of 0.01. with static soft limits, you would at least see an upwards shift in blip baseline after the transition. additionally, i cannot understand when someone would be interested in the micro detail of the plateaus when legitimate jumps are several orders of magnitude larger -- it's like saying you want to see changes of a cent, while also expecting changes of $10 dollars. |

|
alright, here we go.. top panels are the default ranging behavior. the wide version is the full dataset, and each smaller panel is different interesting subset of the same data. the bottom copies of the same panels all have the following limits:
|
|
@leeoniya first of all this looks really good! It's exactly what I was looking for. And I see where you are coming from. Its difficult for outsiders to understand why this is needed. About the data. This data was probably too clean. I didn't have time to find a better example. I'll try to find the time to find a better example. Just to explain what is happening here. This is a voltage signal. The impulse noise is either a power disconnect or operator action (a lot of different things, electrode cleaning etc. ). What you want to look for in this data is "fast" changes +/- 0.2v this may indicate a intermittent short circuit that is really bad for this process. |
|
I'm confused about what we ended up with here... I just want to be able to say "auto min but don't go below this value" and/or "auto max but don't go above this value" (see my original issue #26597). |
|
you should be able to get this behavior by setting the soft limits to the inverted hard limits: |
|
What if you want an auto max and "auto min but don't go below this value"? |
|
you would leave the hardMax empty or set it to 1e10 |
This is not at all an edge case. Most performance monitoring dashboards (looking at a set of servers for example) need to be able to look at long term trends, but ignore spurious spikes in values (eg. cause by reboots or one time hiccups). For my dashboard with 14 servers, the only way to do this is to hand edit each of the 14 graphs to manually set the Y-Max value (variables don't work in that field) So for now, I have to create a whole second dashboard (with Y-Max set low in each graph) for the purpose of viewing long term trends. Ugly. |
what does this mean? we implemented this requested feature almost two years ago. the new options are called softMin and softMax. you have to set both, the max (hardMax) and softMax to get the spike clipping behavior without destroying the resolution of the remaining data. maybe we're talking about different things and some screenshots of your two 14-graph dashboards can help illustrate what's not working for you. |
this had always been the case in grafana before we added soft limits, so we didnt want to break compat with existing panels.
you can still get autoscaling up to the hard limit by setting hardMax: 100 and softMax: -10000, though it's not exactly the same (you might lose the top scale padding above the max data value) |
Oh, that works. THX! |
I've got a graph displaying error rates, and I've set the axis max to
auto. The problem is that on quiet days, with a low error rate, the axis shrinks down to display tiny blips as large mountains. I could set the max to a particular vaule. But, I don't want to aim to low and experience a graph that goes off the chart. And, I don't want to set the max so high as to not get readable "medium" graphs. (I don't want to use thresholds, as I've got graphs on the other axis, and I don't want to cause confusion with those ranges.)An ideal solution would to have a "min-max" setting. I could set the min-max to 100, and the axis would never get smaller than that. But, it would grow if need be.
The text was updated successfully, but these errors were encountered: