Time Series Panel slow hover tooltip performance #31774
Assignees

Labels
Milestone
Comments
|
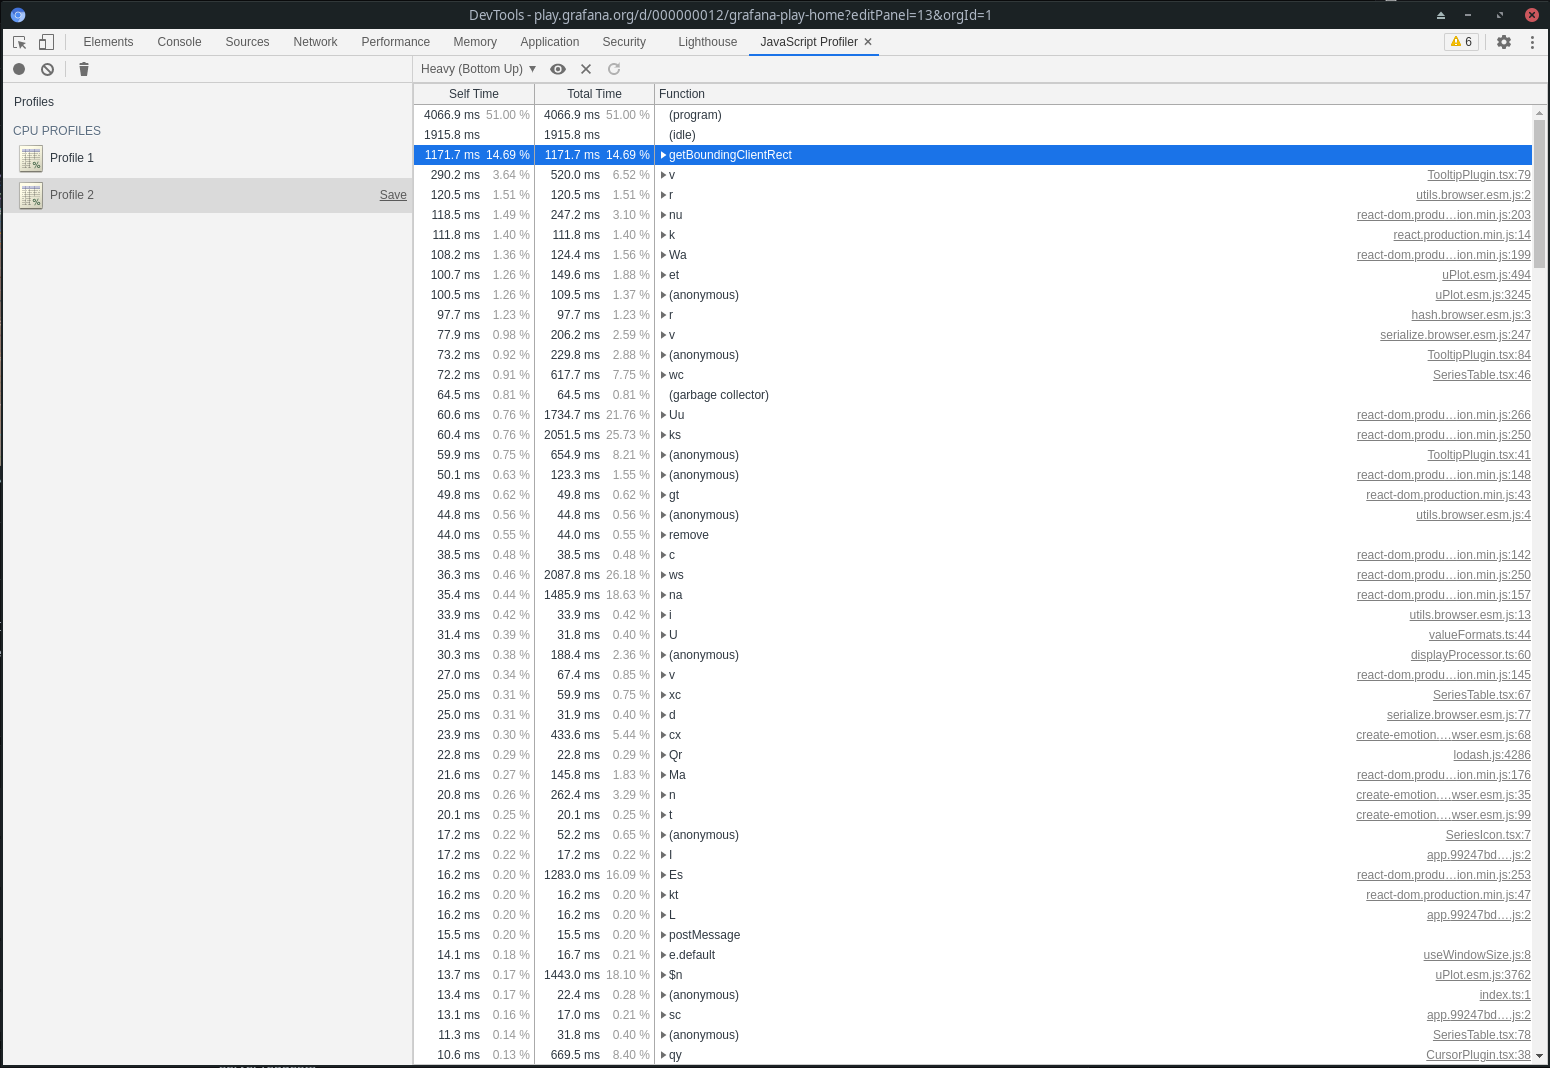
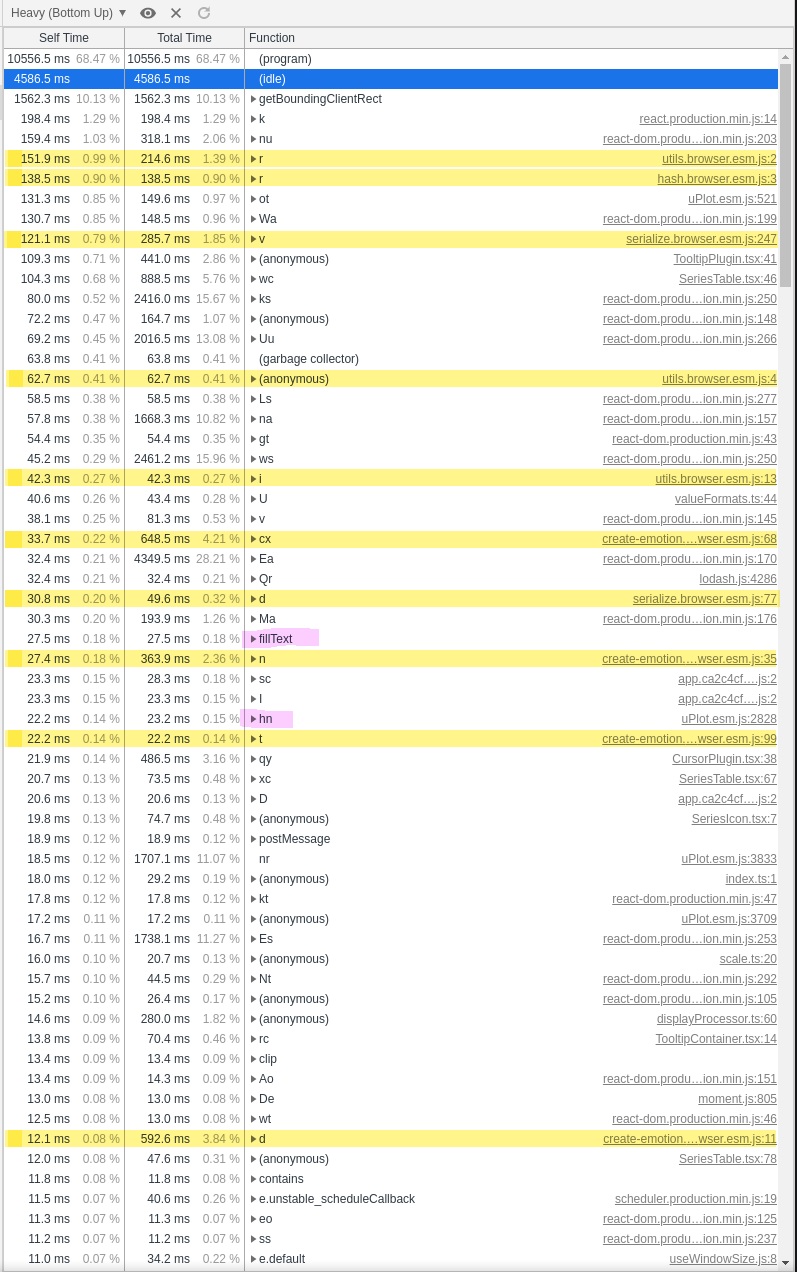
i ran a quick profile while cursoring over a 60-series chart and there are indeed some questionable things at the top that need to be mitigated:
|
|
@leeoniya will peek at this in the morning |
leeoniya
added a commit
that referenced
this issue
Mar 9, 2021
leeoniya
added a commit
that referenced
this issue
Mar 9, 2021
|
besides the obvious the purples are the result of the full chart redrawing on every cursor move event 😨
|
This was referenced Mar 11, 2021
Merged
leeoniya
added a commit
that referenced
this issue
Mar 12, 2021
|
final part of this work just landed in #31937. |
Sign up for free
to join this conversation on GitHub.
Already have an account?
Sign in to comment
What happened:
When migrating an existing Graph panel to the new Time Series panel we ran into a performance issue. When hovering the graph panel (displaying only a single item in the tooltip) the tooltip is delayed and it does not display/move smoothly. In this case, we're displaying 60 different series in the graph.
What you expected to happen:
Smooth hovering experience (compared to the Graph panel).
How to reproduce it (as minimally and precisely as possible):
I tried creating a public snapshot of the dashboard but the timeseries plugin doesn't seem to be available in raintank.io.
I've attached a short video showing the difference between the Time Series panel (left) and the Graph panel (right).
https://user-images.githubusercontent.com/1291846/110321166-948d0000-8011-11eb-9a1d-8e90a0aa52fd.mp4
Anything else we need to know?:
I'm using an external 4k display attached to a 2018 MBP. The resolution is set to 3360x1890, if I resize down the Chrome window displaying the Grafana dashboard to a smaller size the interaction with the panel gets better but still not quite the same as the Graph panel.
Environment:
grafana/grafana.The text was updated successfully, but these errors were encountered: