- Prometheus Operator with support for Prometheus v2.X.X
- highly available Prometheus and Alertmaneger
- auto-discovery for services and pods
- automatic RBAC configuration
- preconfigured alerts
- preconfigured Grafana dashboards
- easy to setup; usually less than a minute to deploy a complete monitoring solution for Kubernetes
- support for Kubernetes v1.7.x
- email when disaster occurred (with AlertManager)
- Contain Pre-Defined Dashboard for Grafana for monitoring Kubernetes
- Kubernetes cluster and
kubectlconfigured - Security Groups configured to allow the following ports:
- 9100/TCP - node-exporter
- 10250/TCP - kubernetes nodes metrics,
- 10251/TCP - kube-scheduler
- 10252/TCP - kube-controller-manager
- 10054/TCP and 10055/TCP - kube-dns
- SMTP Account for email alerts
If you are running Kubernetes 1.12 or higher you will also need to run cAdvisor on your cluster (bound to host port 4194) in order to access resource usage and performance characteristics of running containers.
Create monitoring namespace in Kubernetes
kubectl create namespace monitoringUse kubectl to apply files in the folders
Now you can access the dashboards locally using kubectl port-forwardcommand, or expose the services using a ingress or a LoadBalancer.
- update alert rules: add or change the rules in
prometheus/prometheus-configmap.yaml.Then apply the changes usingkubectl apply -f prometheus/prometheus-configmap.yaml -n monitoring
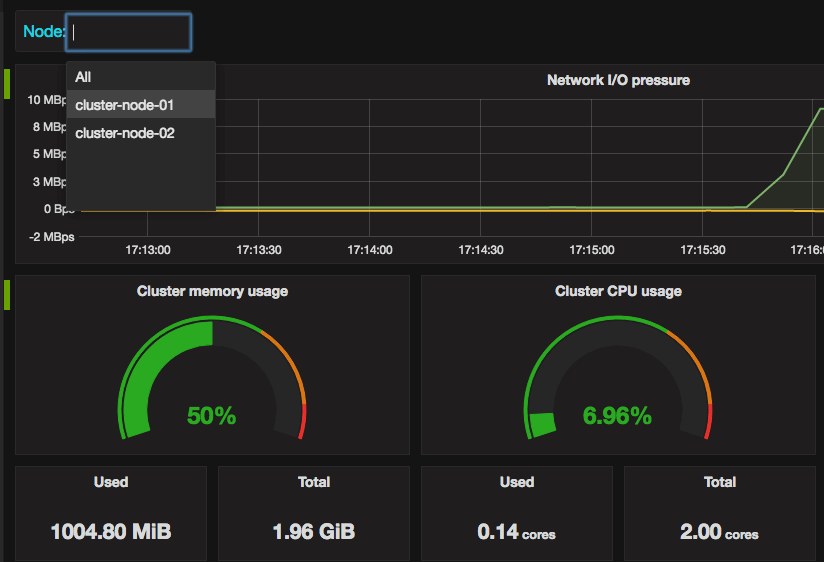
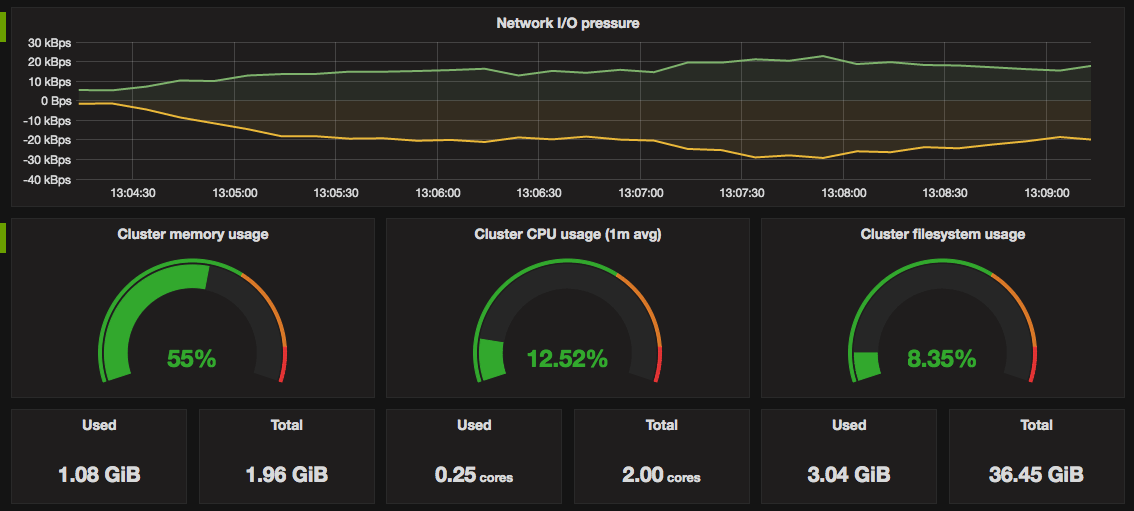
- Total and used cluster resources: CPU, memory, filesystem.
And total cluster network I/O pressure.
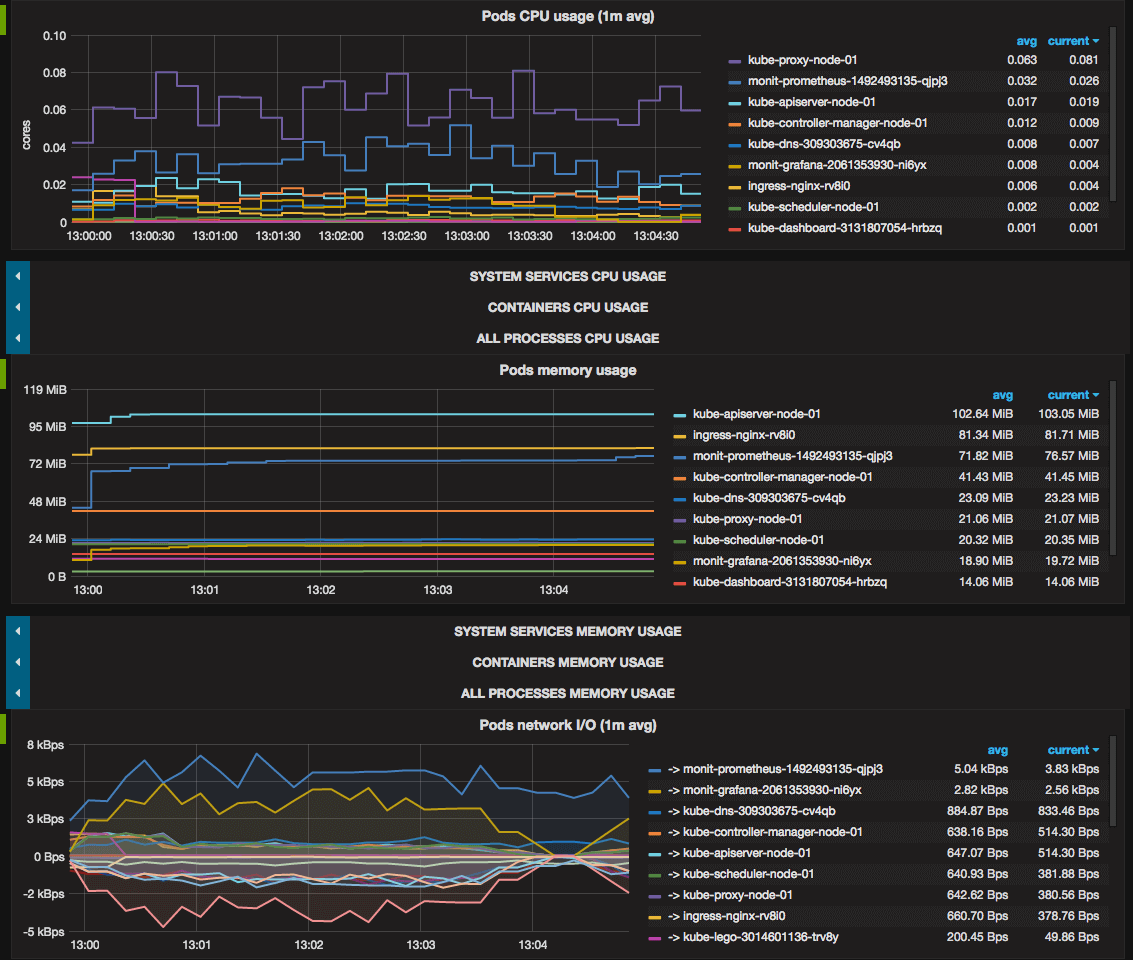
- Kubernetes pods usage:
CPU, memory, network I/O.
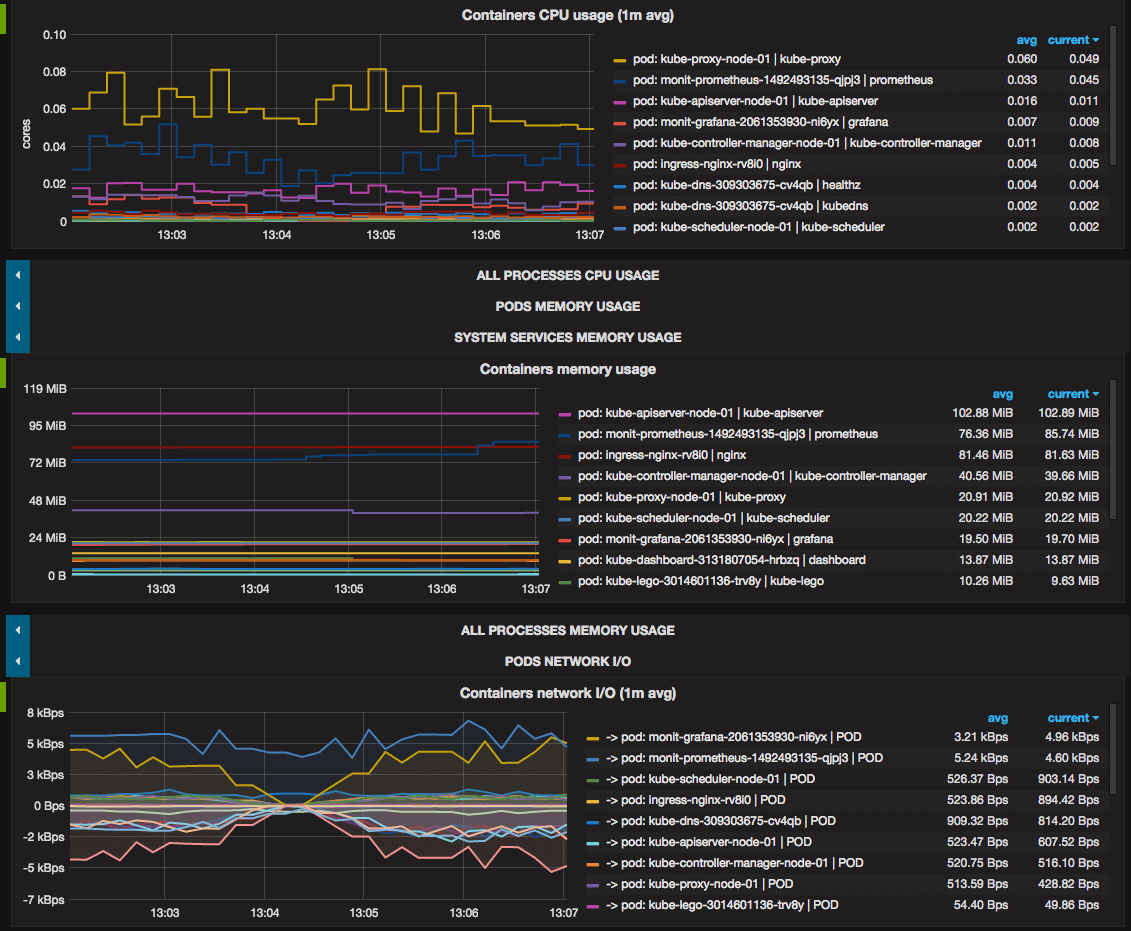
- Containers usage: CPU, memory, network I/O.
Docker containers which runs on cluster nodes but outside Kubernetes are also monitored.
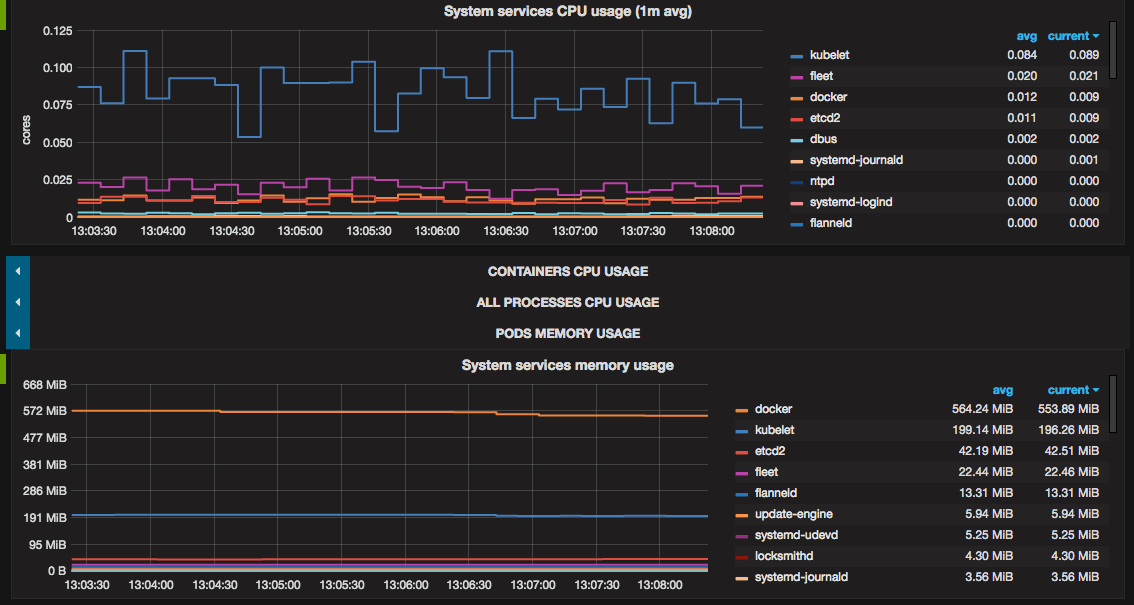
- systemd system services
usage: CPU, memory.
- Showing all above metrics both for all cluster and each node separately.