CPU load high when backend server with healthcheck down #1770
Comments
|
With such configuration, if the server is detected as down, an error is immediately returned for every requests. With a load testing tool, this will result to an high CPU usage because of an high request rate. But I guess it recovers if you stop Without health-check, the serer is not detected as down. Thus, for each request there is a connection attempt. There is no connection timeout. And by default, there are 3 connection retries. This drastically slow down the request rate. |
|
Apologies if this is not a bug. I was redirected here from the forum.
Yes it does. In the productive instance though the CPU load was so big, that all backends were marked as down even if they were still available. Correlating to the almost 100% utilization of 48 virtual cores my guess is that HaProxy was not able to perform the health checks in time. Which in turn caused HaProxy to lock up for several minutes. Is there an intended mechanism to prevent high CPU load when a backend is down? |
|
No problem. It is not obvious it is a bug or not. I may have wrong. I'm surprised your load is so high if you have several servers to load balance the traffic. Could you share your real configuration ? |
Actually it is only one server per backend. The IP is a floating IP failing over to the next server in case of failure. I extracted and redacted the haproxy.cfg. Redacted info is marked with a You can see that many backends have the same servers. This is either due to monitoring reasons or I already know that these will get their own server in the future. I already tried to contain the damage by setting Edit: Since I did not want to reproduce this in production I blocked off one of the servers via iptables on a test instance and wrk'd it from my home internet connection. That alone was enough to significantly raise the user CPU. When two others joined in it was enough to saturate 48 cores of a completely idle instance. That did not seem normal which is why I created this issue. |
|
With a load testing tools, with only one server in the backends, I'm not surprised the load increases. Because HAProxy immediately returns an error, the request rate is much higher. However, this should not inhibit the health-checks. This point is very strange. On a production traffic, I'm surprised it changes anything because the request rate should be more or less unchanged. Maybe clients are tempted to retry the requests because they receive 503 errors. But this should be performed with a delay. It may be good to check if the request rate is the same or not when it happens. And again, this should not inhibit the health-checks. Maybe I missed something. This point is very strange. About the "solution", I guess we can add some delay before sending the 503-Service-Unavailable responses. For instance you can add a tarpit rule in your backends: But it is really important to understand why the load is so high when a server is detected as down. |
|
Hey thanks for the answer. There is an update to this situation: I thought disabling the health checks avoids HaProxy from hogging all CPUs when a backend is down. That turned out to be false just 30 mins ago. The maxconn of the frontend was reached (I underestimated the traffic) and HaProxy started queueing up connections. All CPU cores were fully utilized again. I have full prometheus metrics of this incident. Is there anything specific you are interested in? |
|
The request rate is a good metric to know if clients are retrying too quickly. But If the problem exists when there is no health checks, it is probably not the issue. You can look at the number of connections in the queue. because it may be a contention issue. A perf top on HAProxy is probably a good way to validate this hypothesis ( |
|
At this stage, you can also get |
|
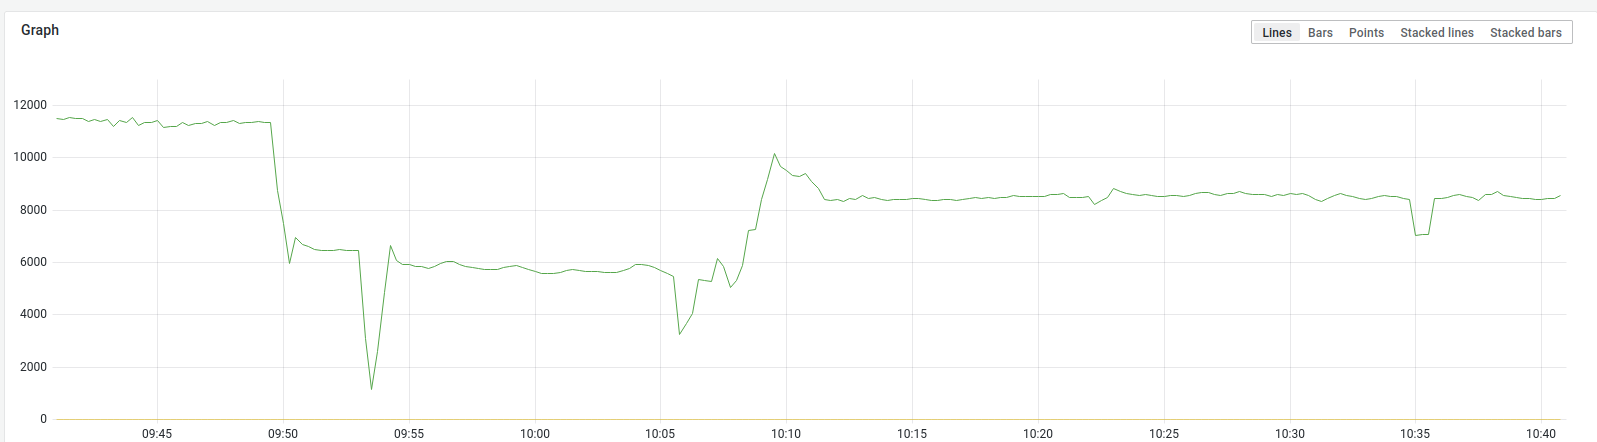
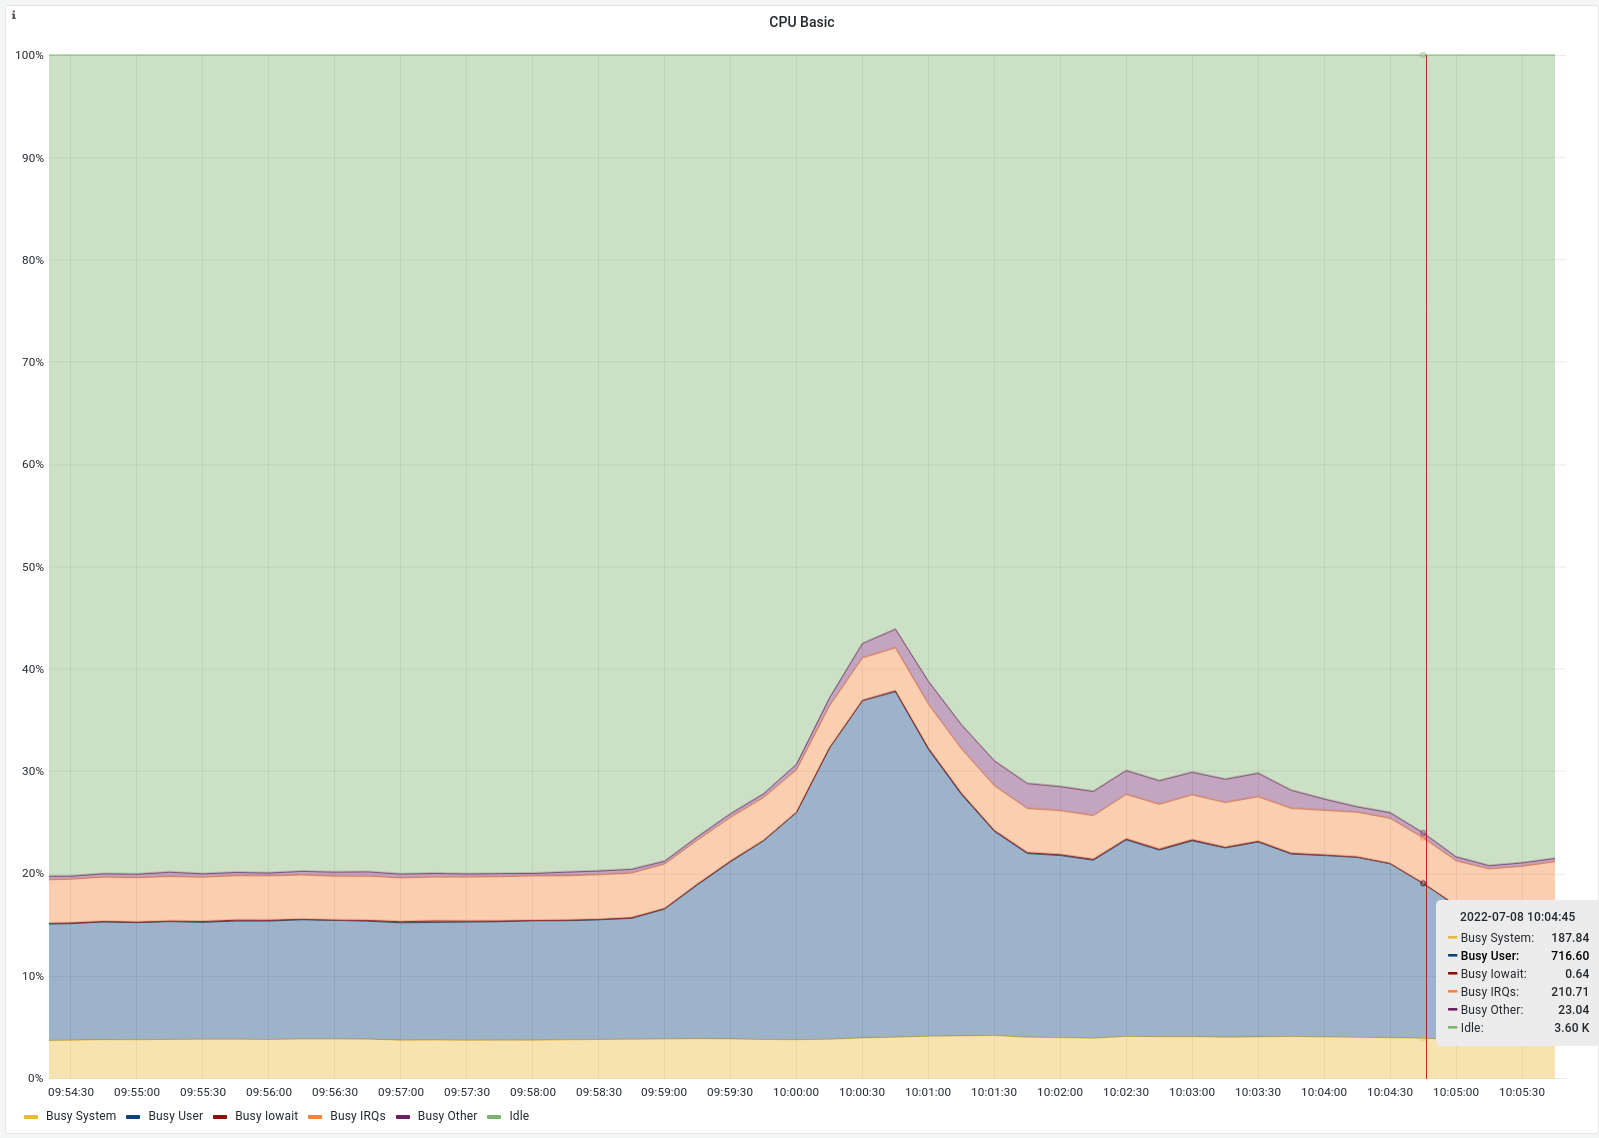
Ok the request rate on the frontend did not rise, but fall as soon as the maxconn limit was reached: This is the first lines of the perf top output: Currently everything is fine, but I hope it helps anyway. |
|
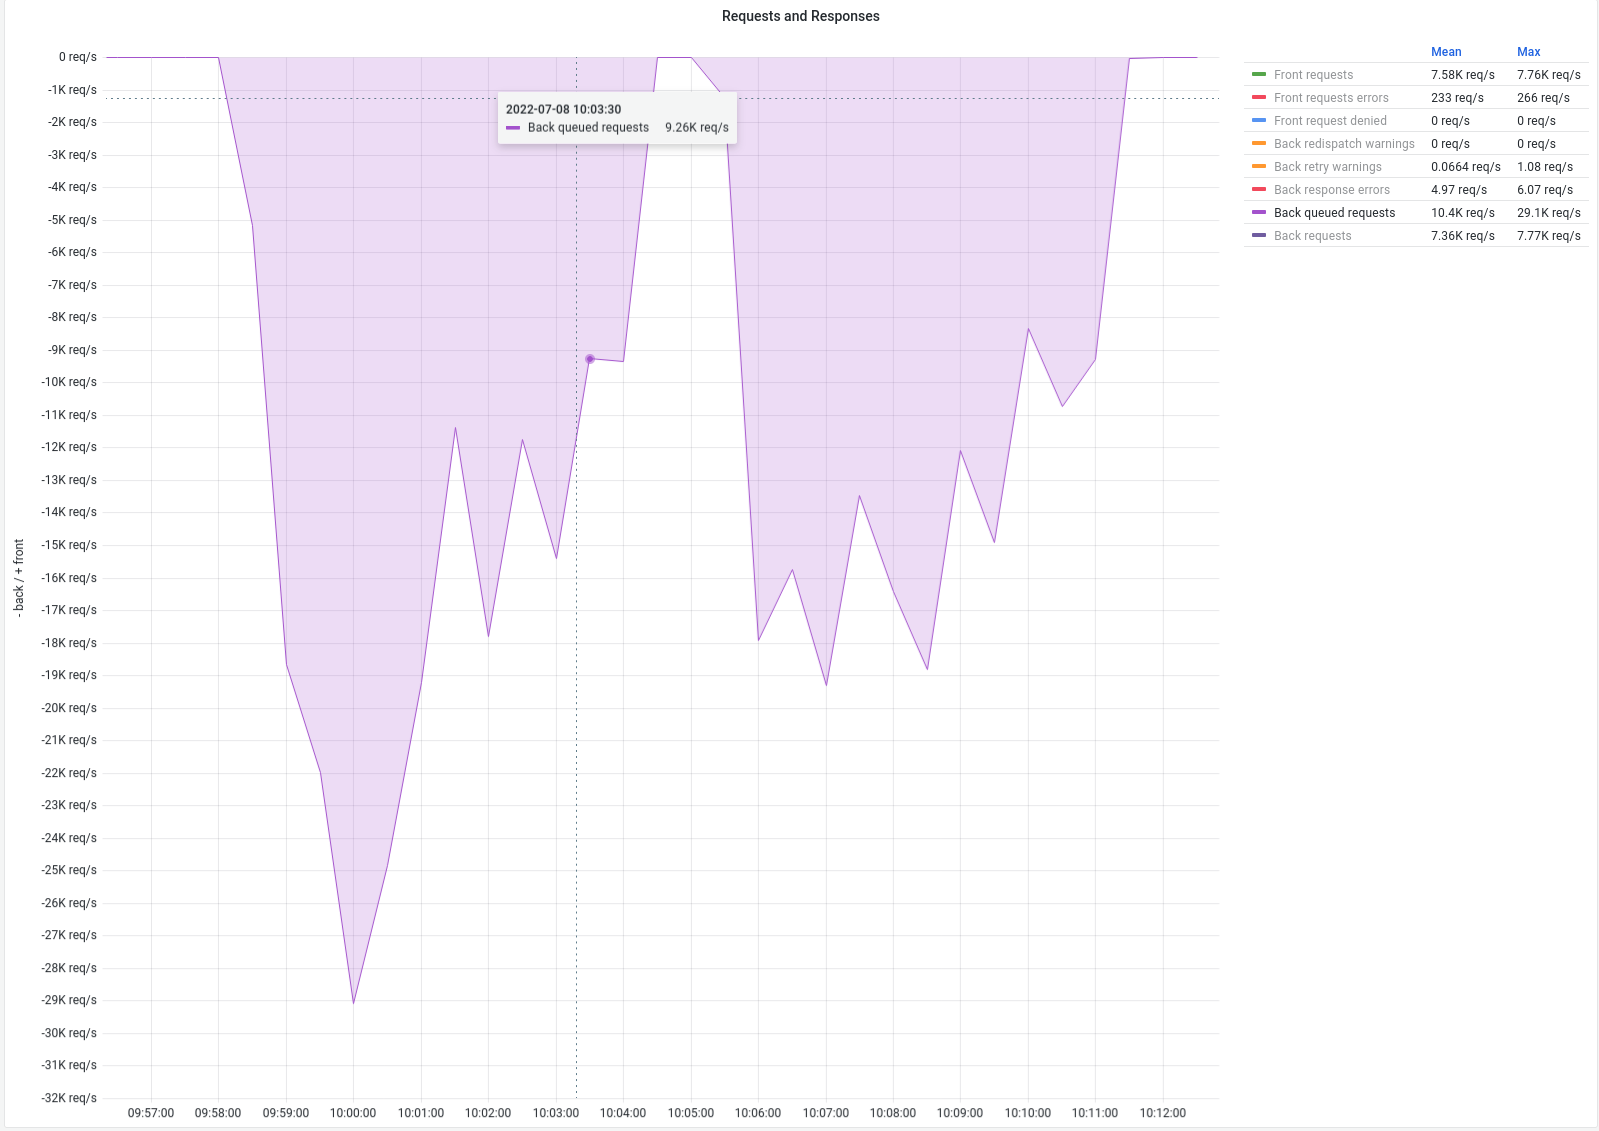
This is the current queue metric: The gaps are HaProxy restarts. |
|
Some questions about |
|
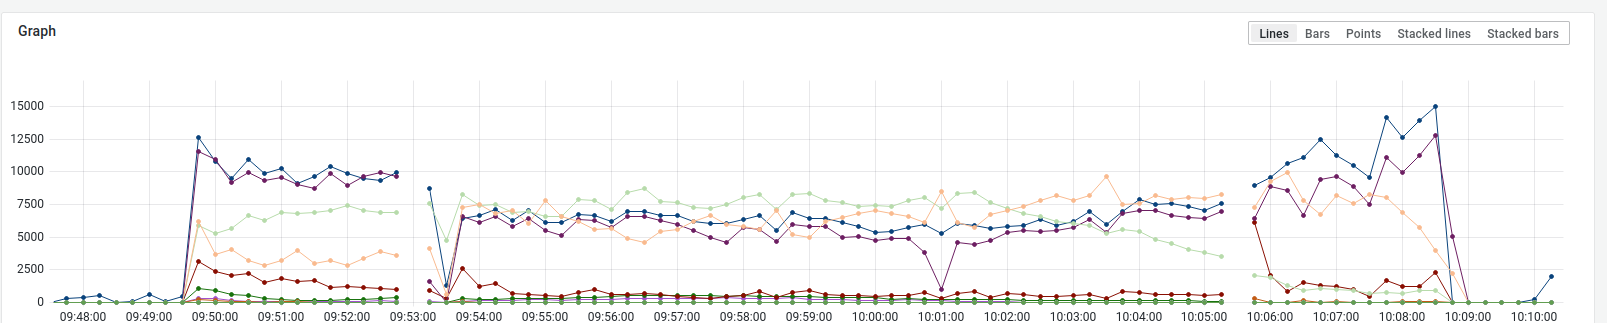
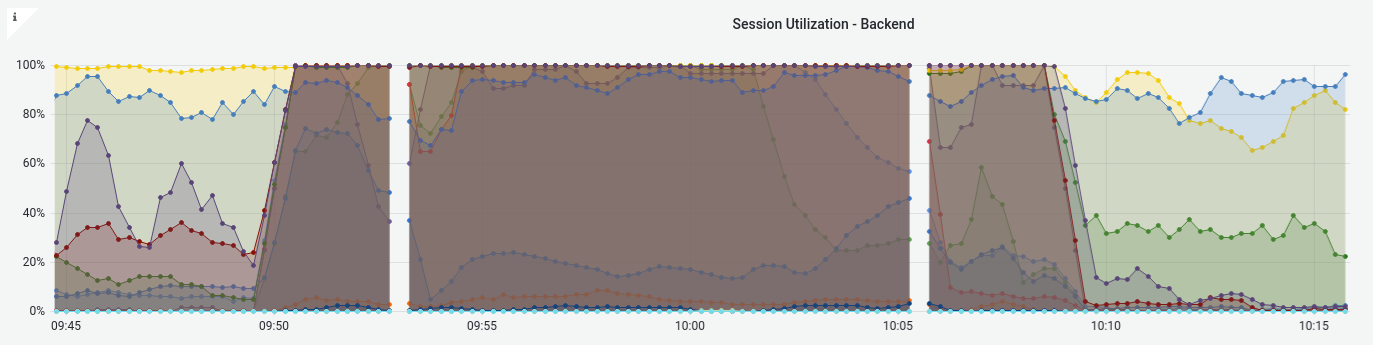
I dug into the metrics and found out something interesting. The timeline is as follows:
Two things are interesting:
|
|
When looking at the server session utilization we can see that with the reload the maxconn of each server was quickly saturated and this is where the CPU utilization rose to 100%: |
|
The CPU usage seems to be related to the queue size. It really seems to be a contention issue on the queues. Some improvements were brought with the 2.6. However, you are playing with queue priority. It may be related. A |
|
Note that I don't understand how it could be related to health-checks. |
|
Oh very interesting. You probably mean I should do another
During the incident today I could not see any health-check failing because it was already disabled I am afraid. I will get back to you tomorrow when I did some more tests. |
|
Copy that, thanks. About the queue priority, I would say it should be fairly light. But on high load and with contention issues on queues, it may make the issue worse. I honestly don't know. |
|
Hm is preventing contention issues altogether via a short |
|
For now, we must figure out what the problem is. It may be a bug. If we change the settings, it may hide it and let think that everything is working properly. In your case, setting a short |
|
Hi, I have not yet done the tests but I found some sort of stack trace/thread dump in the logs. When I restarted HaProxy the first time after raising Click to expand!I do not know whether this helps, but I thought it is worth a shot. Edit: I greped for this and found two other dumps like this from a week earlier when the health checks were still enabled and this happened the first time. Should I attach them too? |
|
Your traces is not due to a kill of systemd but yo the internal watchdog. HAProxy was killed because it detected some stuck threads. Here there are 2 stuck threads, both in peers part. It could be good to check your other traces. But it may be only a side effect of the contention problem we suspect. |
|
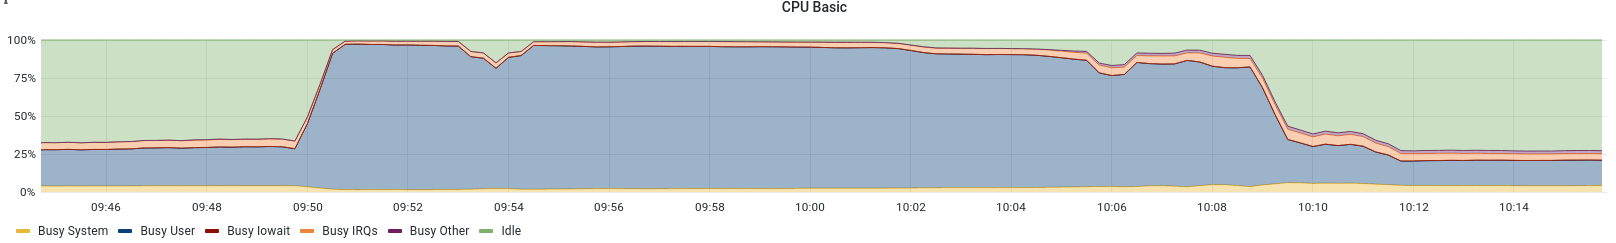
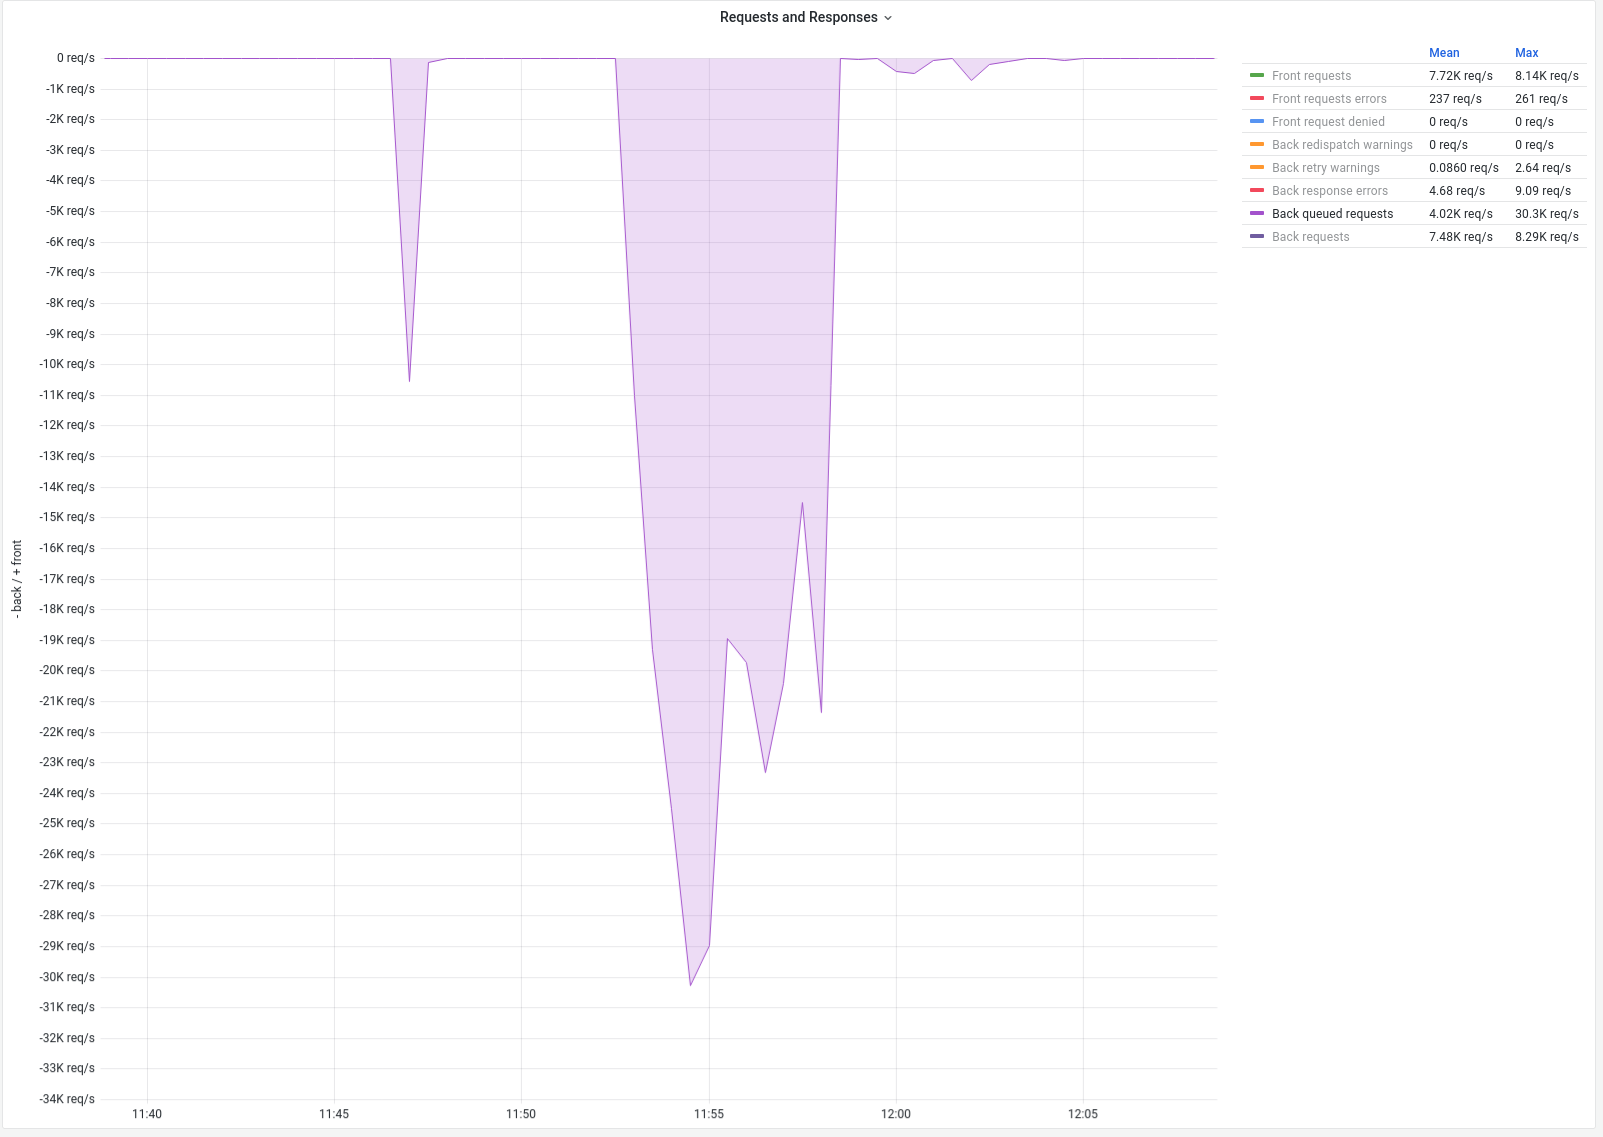
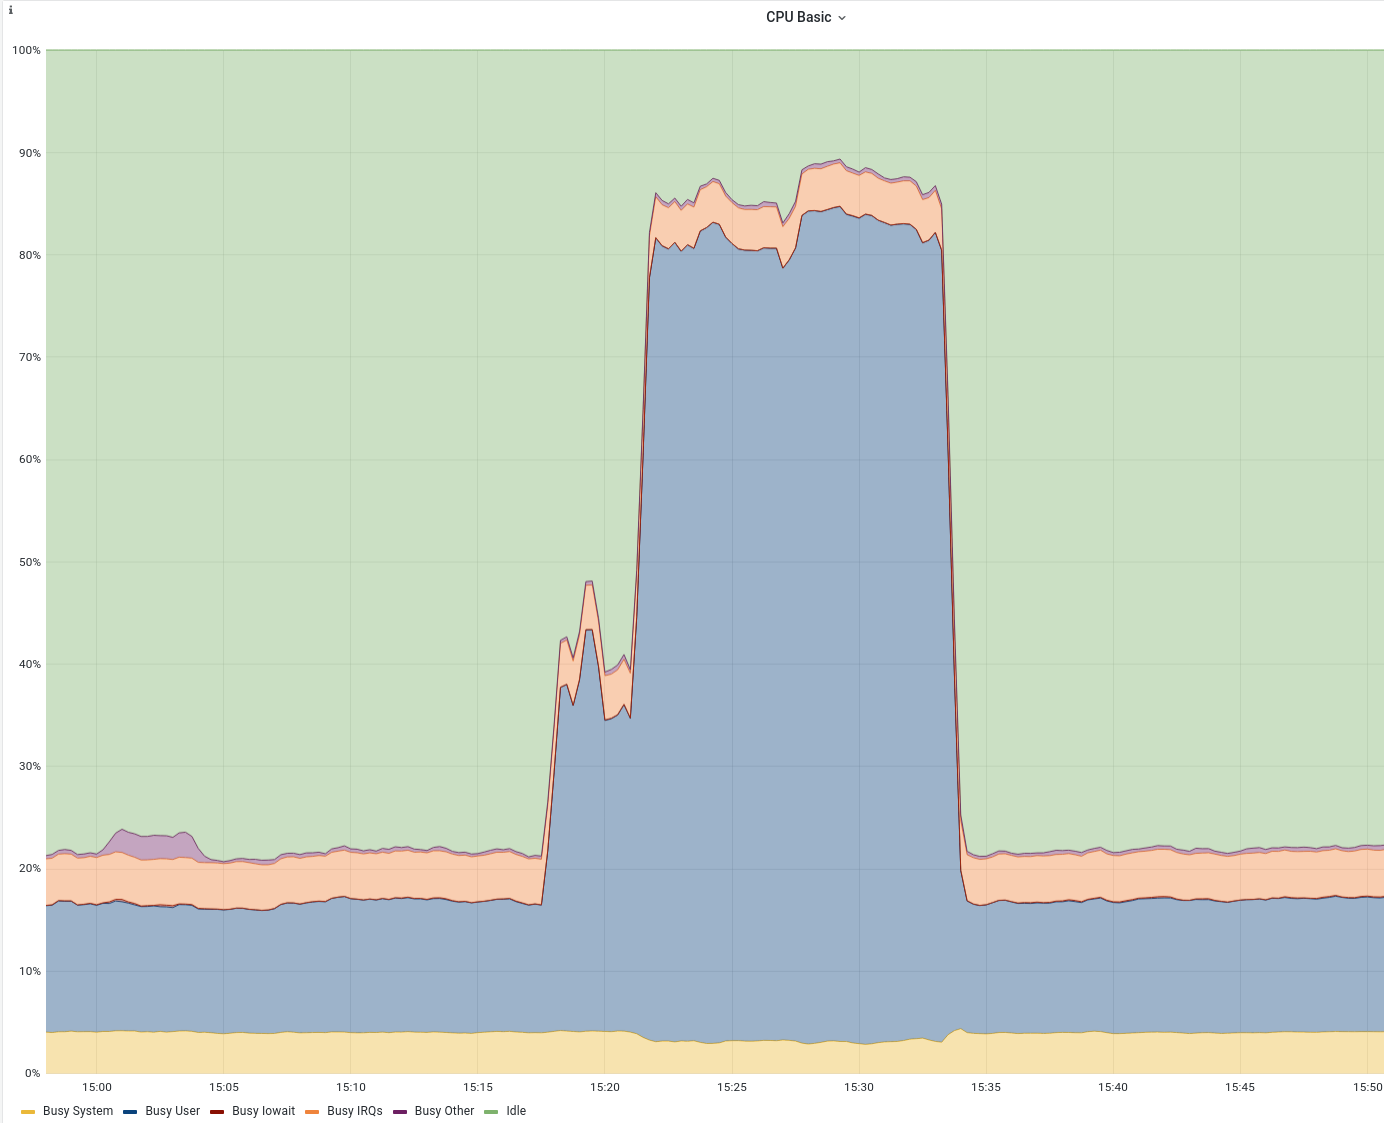
Hi, I was not able to continue on Friday, but today I am back on the case. Here are the two traces: Click to expand!Click to expand!I think the second one contains more information. There is also another piece of information I found out about the incident last Wednesday. The number of tasks in the run-queue correlated with the CPU usage: I guess this is related to the number of queued connections but I wanted to let you know in case it means something different. I was not yet able to reproduce this on a test instance, but since I disabled the priority queue settings last Thursday there was a little spike on Friday when a backend failed for three minutes. Also the are no queued tasks this time. Maybe because we were not at 100% CPU utilization. Luckily I found a comparable event that happened on Thursday a few hours before I turned off the queue manipulation: In both cases the backend queue reaches ~30k entries but the CPU load is considerably lower after turning off queue manipulation. Of course this is just two data points so I do not want to jump to any conclusions here but it looks promising. I am still wondering if the smaller CPU spike on Friday is still out of the ordinary or expected. |


|
Hi, one of our backend services just failed and I was able to gather the needed information during a real incident: show activity 1 show activity 2 show activity 3 perf top 1
perf top 2
CPU usage
HaProxy metrics
There were no health checks and no |

|
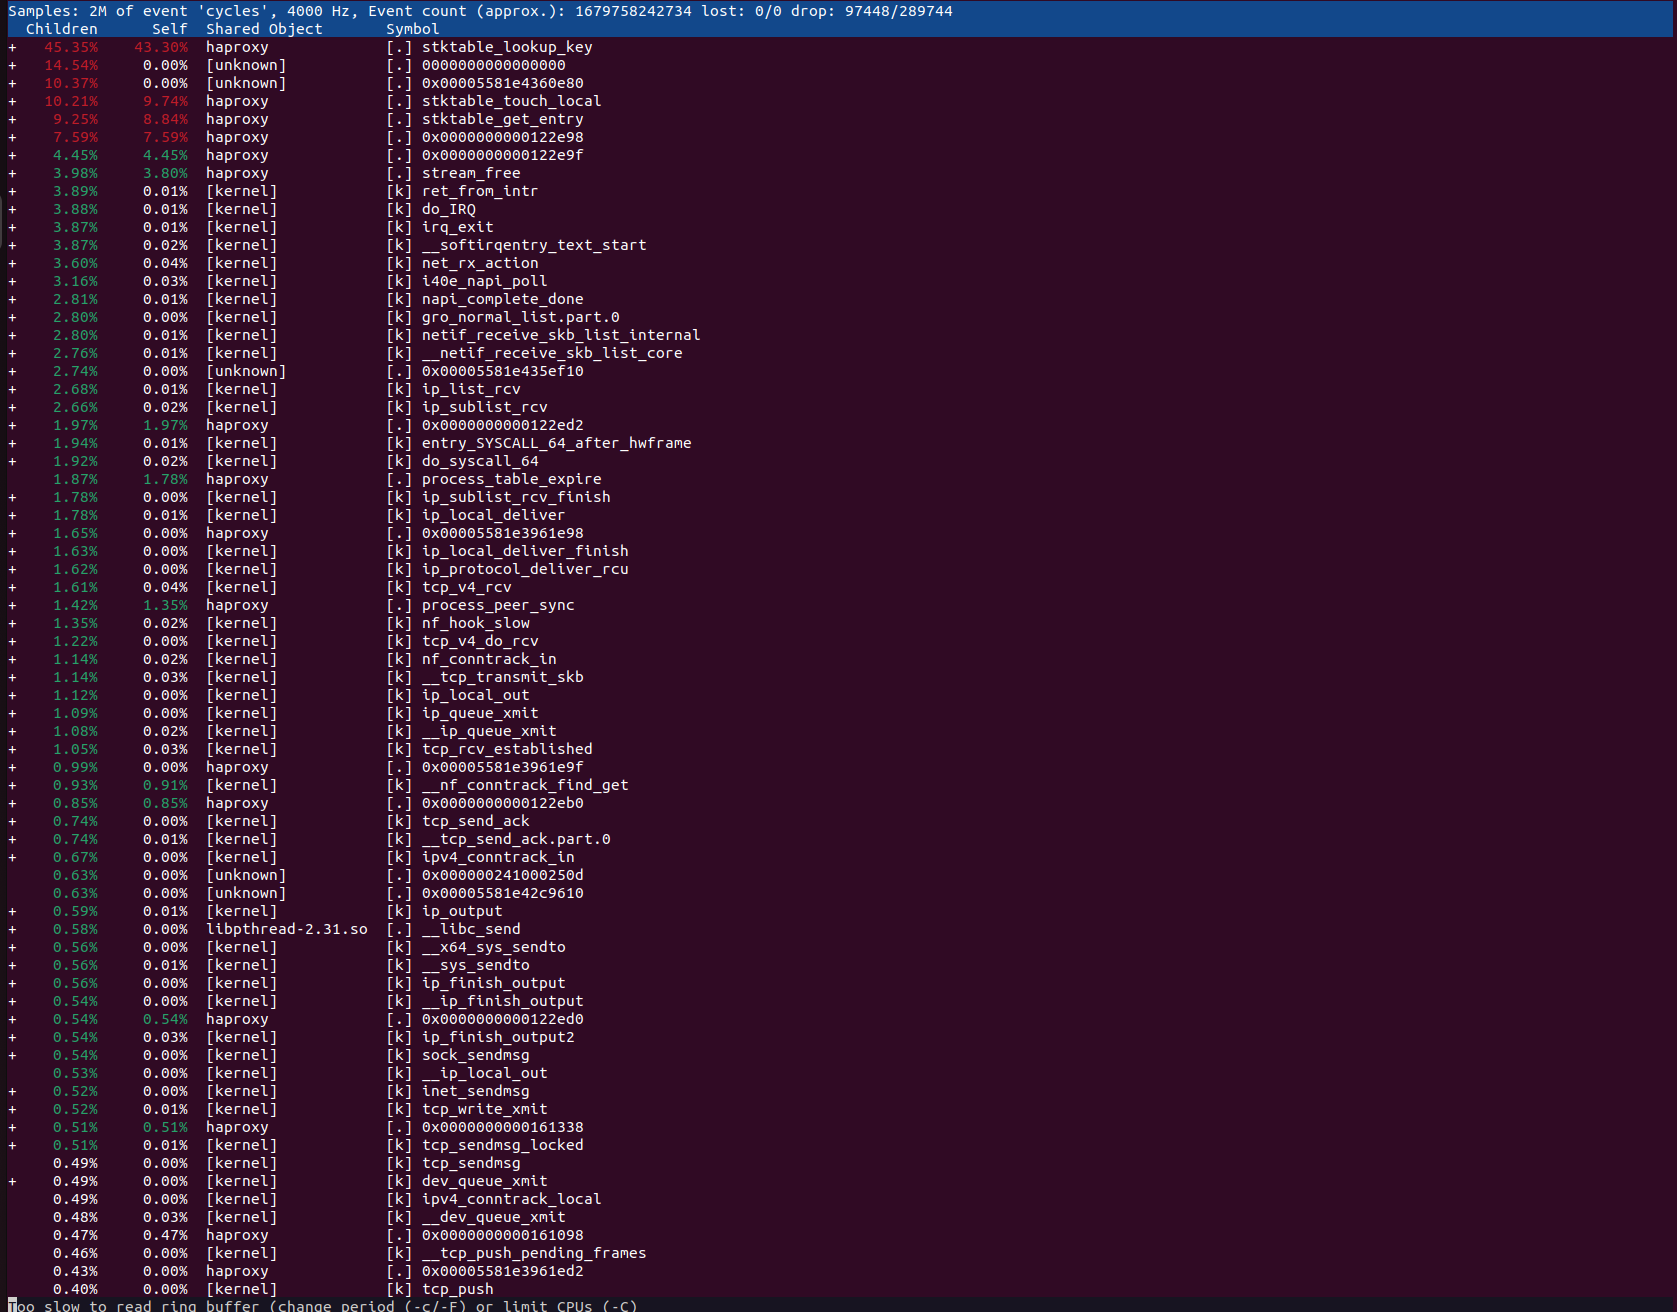
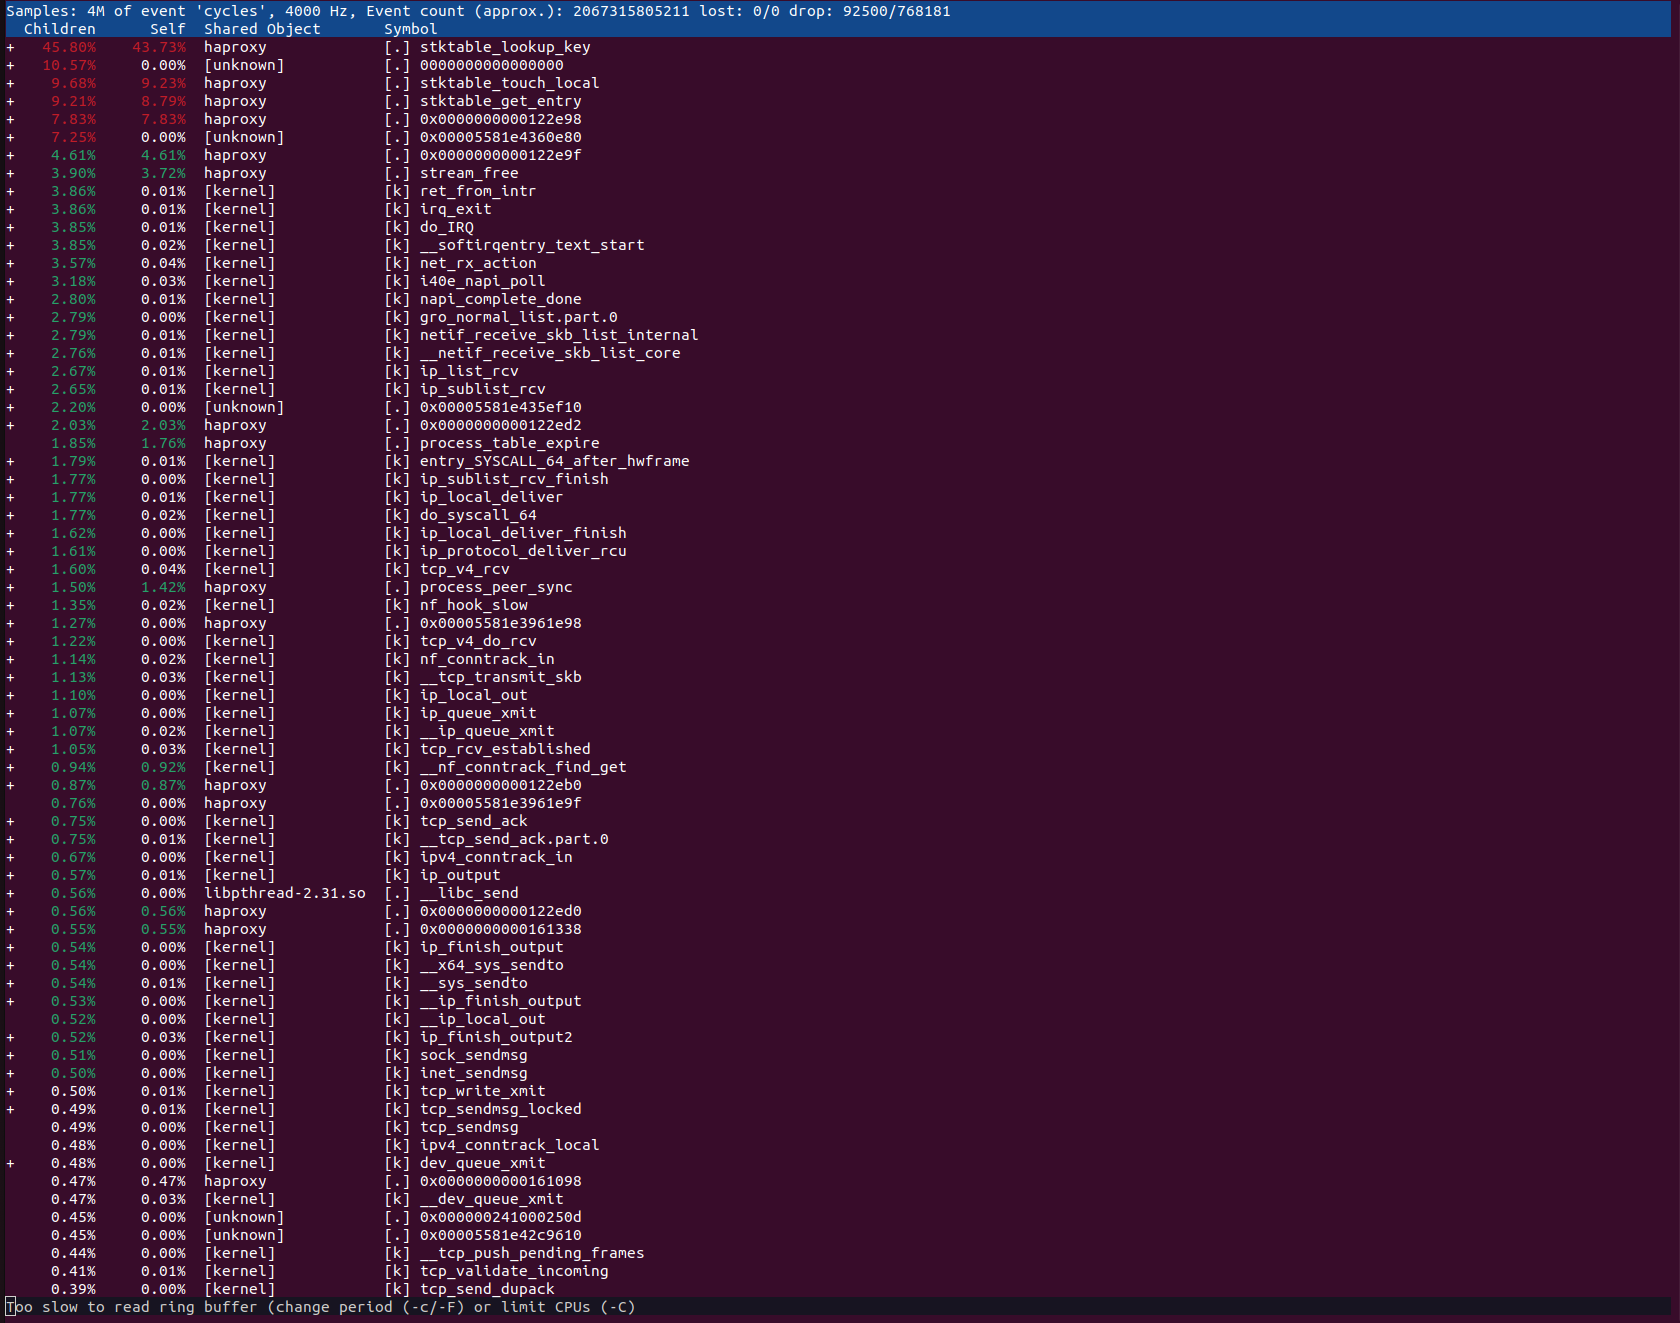
Thanks for the new details. There's a huge amount of time spent in |
|
Thanks you for looking at the details. I also posted my config further up. Do you have a hunch what stick-table usage causes this? The ones that are always used are these: There are a lot of ACLs using these frequently. But they work fine for 10k requests/sec as long as all backends are up. I do not know what ACLs or other statements cause a spike in lookups when a backend is down. Do you know how to debug this? |
|
If you have many ACLs referencing the entries, it will depend how your ACLs are written. For example if you perform a lookup for each rule it can start to accumulate. Maybe you could have a few initial rules that retrieve the values you need and place them into variables, then have your ACLs only use these variables ? Or maybe you should use |
|
@wtarreau Oh there is a misunderstanding: I already posted a full example. I left nothing out except a few values. But the ACLs and the way I retrieve values are all there. Could you have another look and confirm that my config is indeed doing it in a very inperformant way? So you say that for example |
|
Sorry I hadn't seen that part (the dumps are quite long and it's trivial to miss some info while scrolling). The dump you found in your logs is instructive. It's not systemd that killed the process, it's the process' watchdog that found that one thread was spinning for too long without making any progress. I could resolve the address, it points to this stick-table lock in the peers code: We know that stick-table accesses are still heavy (no R/W locks, only spin locks even for pure lookups, that certainly needs to be improved). Peers synchronization definitely take quite a share of the lock bandwidth there. And your config example shows that there are indeed a significant number of rules dereferencing the stick-tables. What I suspect in fact is that during a reload, the old process connects to the new one to teach it its stick-table contents and that the CPU peak you're seeing corresponds to such a reload: the peers that are flooding the stick-tables are competing with many accesses and some threads take way too much time to make forward progress. In addition, the reload is the moment where the old and new process' threads are also competing with each other, often making the situation worse. This doesn't necessarily explain the wave of 5xx that you're noticing but we need to be prudent before we're certain about which ones they are (ideally finding some in the logs would help so that we know if they are, say, 503, and we can confirm from the termination flags, times, and number of retries what happened). For example the process could be hindered by the other one or by the time wasted dealing with a rush of updates and some short timeouts could be met, e.g. Thus I think you're not facing a bug in the critical definition of the term but a design limitation that's in the process of being addressed for 2.7 (and admittedly for the user it's a bug in that it doesn't do what you'd rightfully expect it to). However the good news is that there are ways to significantly improve this. First, half of your ACLs are performing stick-table lookups, 25% for table "long" and 25% for table "short" (14 each per request, to be precise). Given that you're always using these two tables from the same key (src), and you are already tracking them for the same key in Second, the function Third, and related to the second point above, do you really need 16 MB buffers ? I mean, it's by a very large margin the largest value we've seen in 20 years, and even for the CPU's cache efficiency it's far from being optimal. Those who use extremely large buffers for body analysis sometimes go as far as 1 MB. And for fast transfers, 64kB is already optimal. Thus there are two parts for you and one for us :-) I'm marking the issue as "waiting feedback" to help us find it, please let us know once you've performed the possible updates, and check the effect with |
|
Hi, thank you very much for this extensive answer!
I thought as much from your previous answer and already implemented that. It certainly helped with the robustness. I had another smaller incident today with high CPU load when the backend's maxconn was reached and did another This time I think the incident with high CPU load came from the rather high
I probably misunderstood the docs at this point. Some requests might become that large and I though I would have to increase this value to prevent them from being rejected. Your answer suggests that this is not the case. I also was not aware that this also contributes to congestion. Should I set that back to the default or maybe default + Edit: Just out of curiosity: What is the purpose of the |

Ah very interesting, then it starts to get clearer in my head. Dequeuing connections to a saturated server also involves some extra CPU cost with threads. It's got way better in 2.6 than before but it still comes with a cost (the queue is ordered by priority so there's a bit of serializing there). I suspect that you've been facing a combination of important stick-table lookups, peers messages, and dequeuing cost.
It will not be related to that, though it might be due to a sudden rush on the queue that reached a point of no return (why is another story). In your "perf top" output it now shows that the CPU is spent in a syscall, very likely send(), which is somewhat a good sign as it indicates that your efforts on the configuration have paid since it's no longer the haproxy process that's eating CPU cycles. However I'm concerned by the huge cost for a send() and it reminds me something I observed a while ago, which forces me to ask an embarrassing question... Is this an AMD EPYC ? I'm asking this because that's exactly the type of things I've observed there, due to the core complexes really being distinct CPUs with interconnects between their respective caches, and making all of them work together costs a lot. I've had more performance by using all the CPUs and threads of a single core complex than by using them all together. Note that another possible explanation for the high cost in a send() syscall is the large buffers. A send() would need to allocate socket buffers and to copy all that data, which can take quite some time. Most likely smaller buffers will cause less overhead (how much less is difficult to say). Regarding bufsize:
Indeed that's absolutely not the case. Haproxy takes care of buffering the least possible to limit the latency to the lowest possible, so a request (or a response) flows directly between the client and the server through it, and only the minimum possible amount is kept in buffers. The reason why the buffer is configurable is that the whole headers from a request or response message must fit into a buffer, and some people receive very large headers (e.g. kerberos cookies) which can be up to 32 or even 64 kB sometimes. In this case they have to increase it so that the whole headers can be received at once. And finally the rare ones doing some content analysis (e.g. using some of the experimental WAF plugins) may need to receive enough of a request to give a verdict, thus again they'll need to have larger buffers.
Just to give you a hint, a CPU's L2 cache is still fast, the L3 is shared and very slow. Thus the more operations you can perform within your L2 cache (typically 512 kB to 2 MB) the better. Operations you perform that cannot fit there will trash all that was there and push it to the slower L3, causing lots of reloads (cache misses). That's why it's important to remain stingy with memory usage ;-)
Just comment it out and comment tune.maxrewrite as well. The buffer size will be 16kB and maxrewrite will be 1kB, which means that there will always be room to receive up to 15 kB of headers (that's roughly 8 full screens of HTTP headers), and add up to 1 kB of extra header from your application-specific rules on top of that. It's been a very long time since anyone complained about buffer sizes, so I really think you shouldn't worry about this for regular HTTP traffic.
|
OMG it is! Its a
Sadly this is the case. Due to an overly long URL parameter the header can become as big as 128 KiB. This is why I edited these parameters in the first place.
That totally makes sense the way you put it. Thank you for taking the time to explain that to me :-)
Come to think of it: I got that from a non-official blogpost and did not think too much about what the difference might be. Maybe a hint in the docs about the performance implications might prevent others from making the same mistake. |
No, I don't think you'd need to change your hardware. You may figure that your workload is pretty fine on a single core complex. You'll have to run "lscpu -e" and pick only the CPUs of one value of the L3 cores. Or maybe two values if you really need more load. Also, one of the goals of the work I'm currently on to implement thread groups precisely is to work much better on such machines. On ours (74F3, possibly very close to yours), I already increased the perf by 45% in 2.7. Thus it's a matter of finding the right tuning that will be sufficient to let you wait for 2.7 :-)
OK no problem, then just set it to 128kB. That's obviously ugly but if both the client and the server agree to process it, why not! It will always be much better than 16 MB! By the way I've made progress on limiting the amount of message processed at once in the peers (making it configurable), but figured that if I set it too low we can trigger the loop protection, indicating that something is still imperfect there, so I'd first want to figure how to deal with this better. But I could deliver you a patch if you'd see more crashes in the peers code.
That's a good idea. It's just that it's terribly difficult to document hints in a configuration doc, especially when you think you know what you're doing. Feel free to recheck the areas you think you visited and suggest a proposal to improve that. We could also add some entries in the wiki about how to optimize rules, but again it's a very long and tedious work that needs to be collaborative to be efficient. |
|
Hi @wtarreau, I did my homework (in fact I did it the very next day, but I wanted to make sure it really works) and I just wanted to say thank you and it works very well now! CPU usage is rock solid on the same level now.
I took two L3 caches and 24/48 cores. Per-core utilization went from ~20% on 48 to ~35-40%. Not sure if that helped but it did not hurt either.
That is great news! An intermediate patch will not be necessary though. For now I disabled syncing to large tables and wait for the next release to turn it on again.
What about we turn this into this I just changed the last sentence. I definitely read these kind of sections when trying to understand how to get data for a src IP. I think I settled on the Again thank you very much for all your help. You all are building great product! |
Oh that's excellent news! Thanks for the feedback! Regarding the peers stuff, too much context-switch since last time and it completely went off my head :-( I'll have to get back to it. Your suggestion for the doc makes sense, it could be sufficient like this, indeed. We'll handle this, thank you! |
|
So I'm tagging as reviewed and summarizing what's left to be done for simplicity:
|
As seen in GH issue #1770, peers synchronization do not cope well with
very large buffers because by default the only two reasons for stopping
the processing of updates is either that the end was reached or that
the buffer is full. This can cause high latencies, and even rightfully
trigger the watchdog when the operations are numerous and slowed down
by competition on the stick-table lock.

This patch introduces a limit to the number of messages one may send
at once, which now defaults to 200, regardless of the buffer size. This
means taking and releasing the lock up to 400 times in a row, which is
costly enough to let some other parts work.

After some observation this could be backported to 2.6. If so, however,
previous commits "BUG/MEDIUM: applet: fix incorrect check for abnormal
return condition from handler" and "BUG/MINOR: applet: make the call_rate
only count the no-progress calls" must be backported otherwise the call
rate might trigger the looping protection.
As seen in GH issue haproxy#1770, peers synchronization do not cope well with
very large buffers because by default the only two reasons for stopping
the processing of updates is either that the end was reached or that
the buffer is full. This can cause high latencies, and even rightfully
trigger the watchdog when the operations are numerous and slowed down
by competition on the stick-table lock.

This patch introduces a limit to the number of messages one may send
at once, which now defaults to 200, regardless of the buffer size. This
means taking and releasing the lock up to 400 times in a row, which is
costly enough to let some other parts work.

After some observation this could be backported to 2.6. If so, however,
previous commits "BUG/MEDIUM: applet: fix incorrect check for abnormal
return condition from handler" and "BUG/MINOR: applet: make the call_rate
only count the no-progress calls" must be backported otherwise the call
rate might trigger the looping protection.

(cherry picked from commit 8bd146d)
Signed-off-by: Christopher Faulet <cfaulet@haproxy.com>
|
This was already backported to 2.6.6 as commit dd9b366 so there's no need to keep it open anymore. |
Detailed Description of the Problem
Hello everyone,
I have a high-load (~10k reqs/s) HaProxy 2.6.1 instance with HTTP mode backends with L4 health checks. Everything works fine until a minor disturbance causes a backend to become unavailable for a few seconds. Then suddenly CPU usage skyrockets up to the point that not even the health checks themselves are performed and all backends are declared dead worsening the issue.
I also found out, that disabling the L4 check by removing the “check” parameter on each server solves the issue.
I also tried the latest 2.4 and 2.5 versions with the same result.
Expected Behavior
I expected the health check impact on CPU usage to be negligible when a backend is unavailable.
Steps to Reproduce the Behavior
I created a minimal example:
Blocking the IP via
iptables -A OUTPUT -p tcp --dst 8.8.8.8 --dport 8000 -j DROPsimulates an outage. Bombarding HaProxy with any load testing tool likewrkreveals high CPU usage. After removingcheckfrom the config, reloading and load-testing with the same workload again the usage is way lower, almost non-existant.I put a full Vagrant example in a repo.
Do you have any idea what may have caused this?
No response
Do you have an idea how to solve the issue?
No response
What is your configuration?
Output of
haproxy -vvLast Outputs and Backtraces
No response
Additional Information
No response
The text was updated successfully, but these errors were encountered: