Visualization of npm shows dependency graph of an npm package.
Note, due to anvaka#1 the website talks with npm registry through heroku-hosted proxy. This may have negative impact on latency.
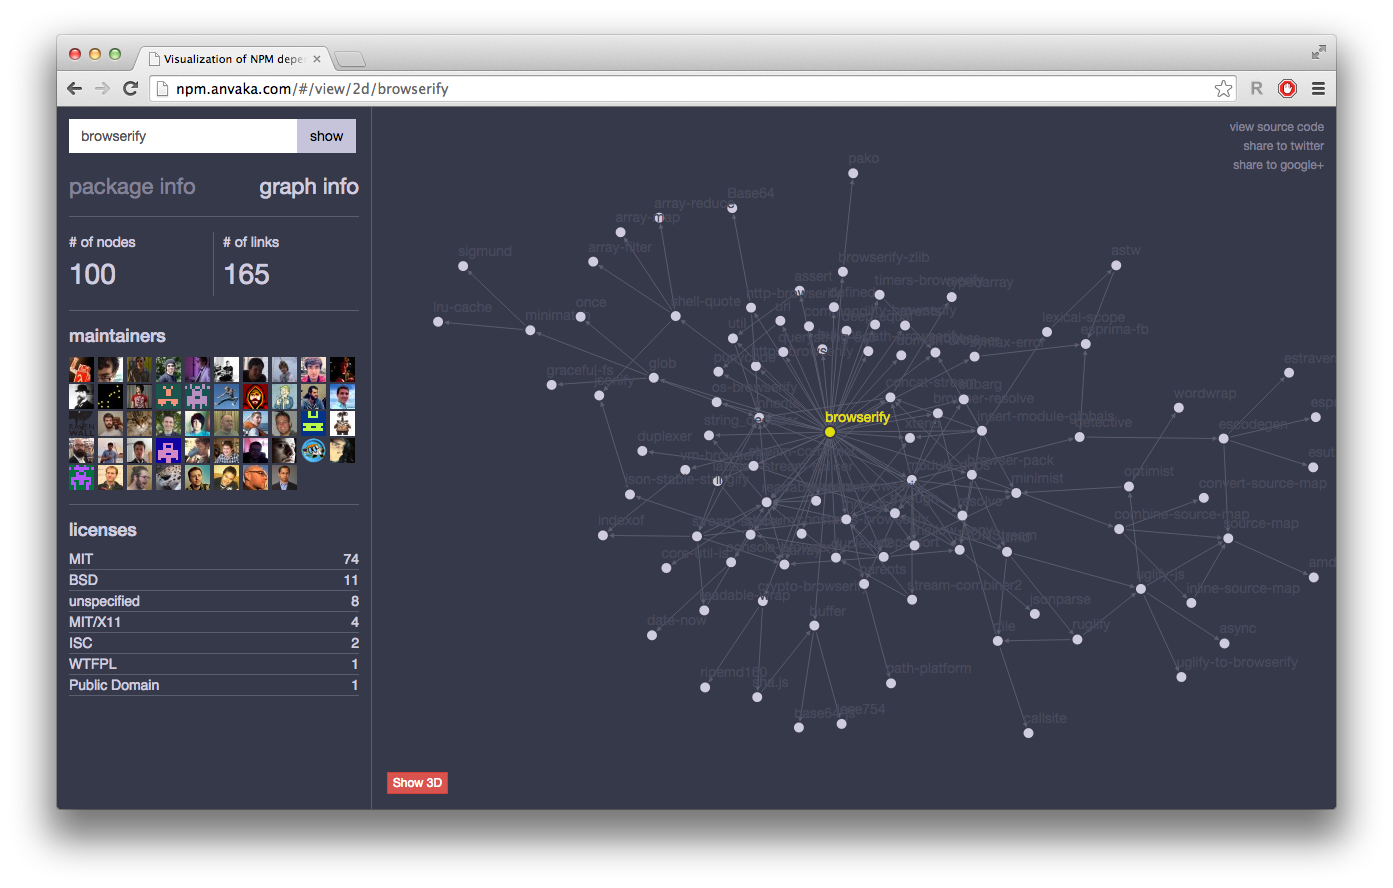
Default view:
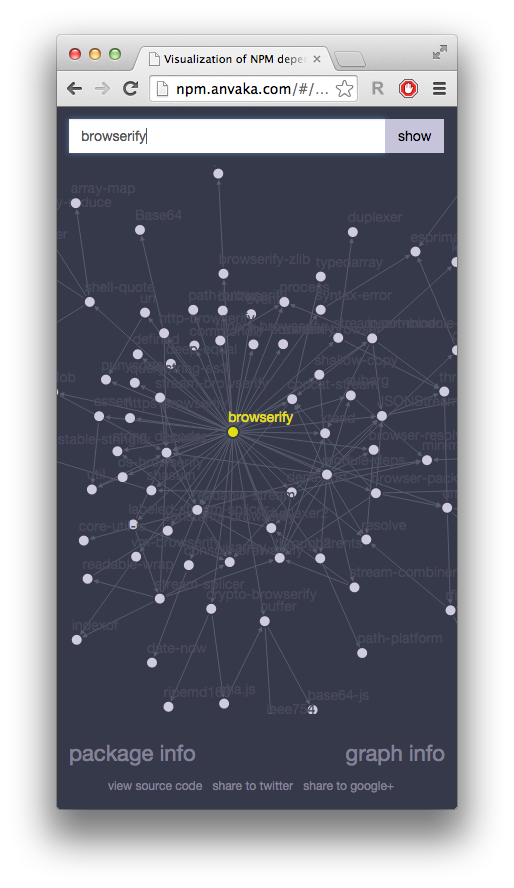
Responsive view:
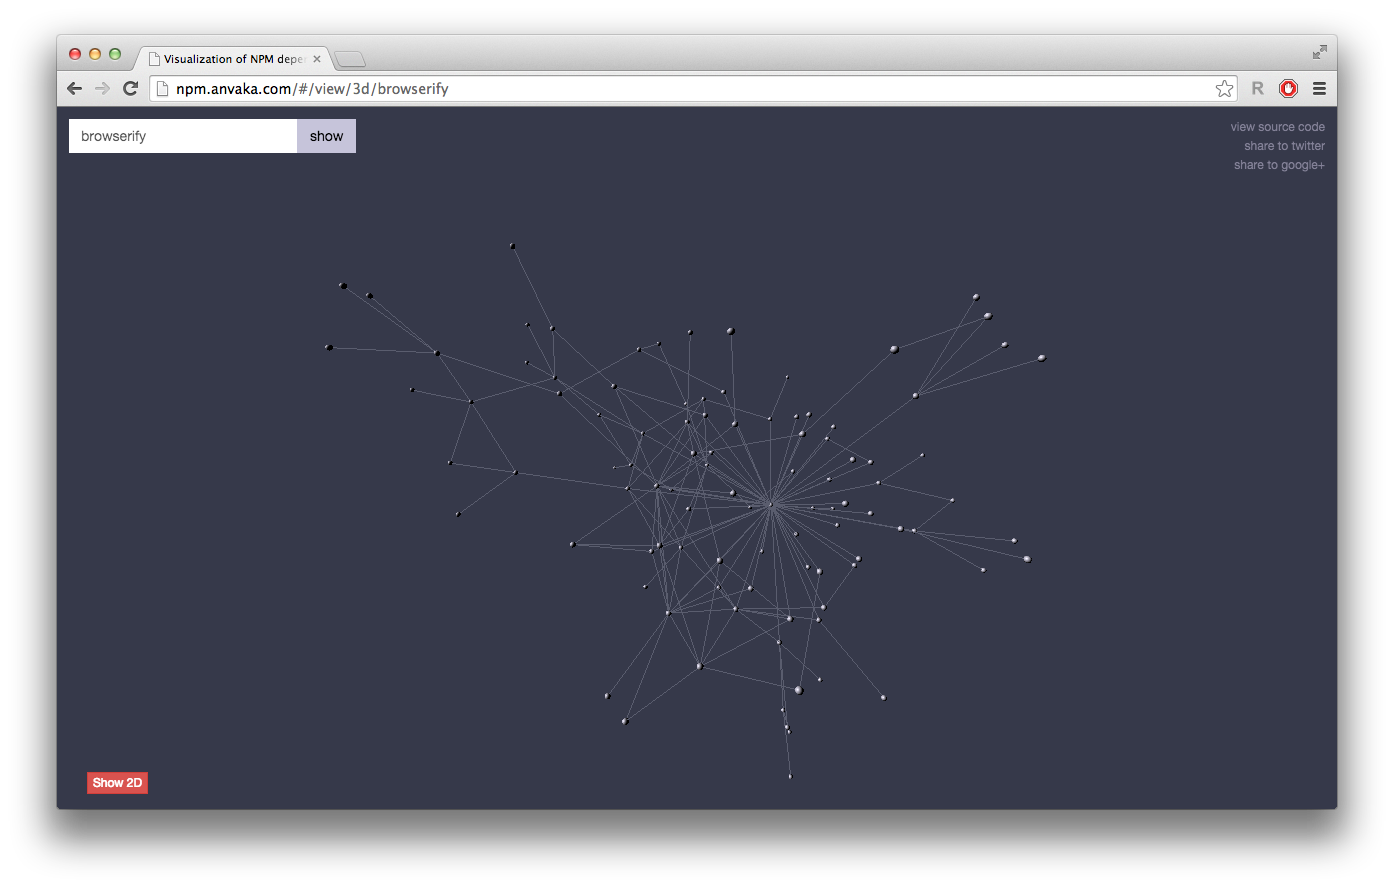
3d view:
angular.js + browserify + ngraph => gulp => http://npm.anvaka.com/
The website is entirely hosted on GitHub Pages, with continous deployment setup via travis.
The npm data is coming from registry.npmjs.cf and is collected by npmgraphbuilder at real time.
For CSS styles I'm using twitter bootstrap and less.
All modules of this application are provided by npm.
git clone https://github.com/anvaka/npmgraph.an.git
cd npmgraph.an
npm i
npm start
This should start local dev server and serve npm visualization.
MIT