-
Notifications
You must be signed in to change notification settings - Fork 10
Quality Control output checks
First, recall the folder structure described here.
-
How was it configured? Check the pipe, see what was done:
-
check the EEG.CTAP.history structure from any EEG file by running:
>>[msg, fun, args] = check_ctap_hist({eeg_file_abspath_and_name}) -
check the main log file(s) (there may be several if pipe was interrupted), at:
./logs/runlog_YYYYMMDDTHHMMSS
-
-
Any bad dimensions? Sanity check, count the badness detected (thresholds below are arbitrary), by checking
-
.logs/all_rejections.txt-
Bad channels > 10%
-
Bad segments > 10%
-
Bad epochs > 10%
-
Bad components > 20%
-
-
-
If any dimensions were bad (or even if not), check plots of badness:
-
bad channels (see example below)
./quality_control/CTAP_reject_data/setX_funY-badchans/ -
bad segments (see example below)
./quality_control/CTAP_reject_data/setX_funY-badsegev/ -
bad epochs [no output available - COMING SOON]
-
bad components, check a. for scalpmap contact sheets for a given method, b. for topoplot, ERSP, & spectra (see example below)
a.
./quality_control/CTAP_detect_bad_comps/setX_funY/b.
./quality_control/CTAP_reject_data/setX_funY-badcomps/
-
-
Any Improvement? Comparison checks, see figures for:
-
Filtering (see example below):
./quality_control/CTAP_filter_data/setX_funY/ -
Blinks (see example below):
./quality_control/CTAP_reject_data/setX_funY/ -
Histograms, compare between two ‘peeks’ at beginning and end [EXAMPLE COMING SOON]
./quality_control/CTAP_peek_data/set[first]_funY/./quality_control/CTAP_peek_data/set[last]_funY/ -
Raw data, compare between two ‘peeks’ at beginning and end (see example below):
./quality_control/CTAP_peek_data/set[first]_funY/./quality_control/CTAP_peek_data/set[last]_funY/
-
-
Final data is good? Sanity check 2, see raw data for ICs:
./quality_control/CTAP_peek_data/set[last]_funY/ -
Extra quality information can be calculated from statistics of the channels, e.g. search for outliers:
./logs/peek_stats_log.txt
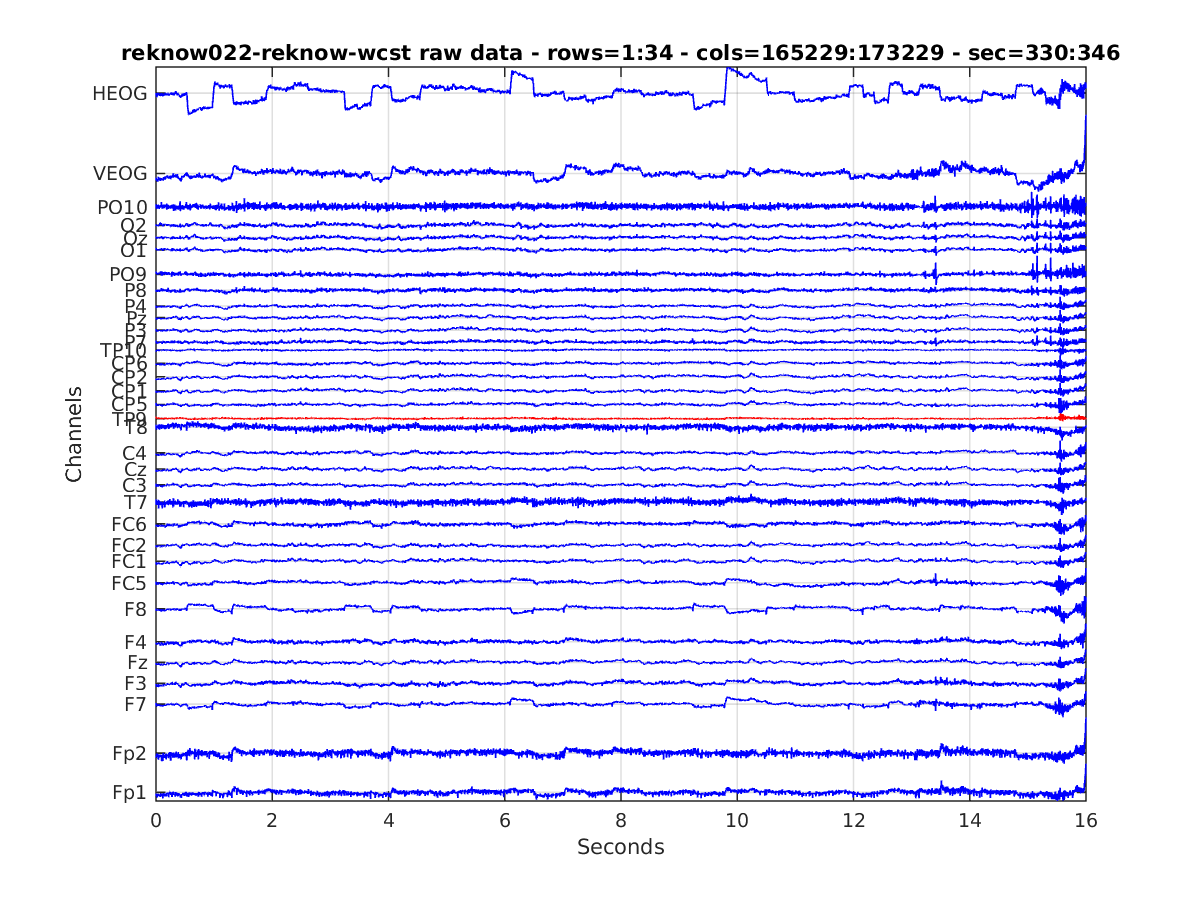
 Figure 1. A clearly dead channel (low variance) is highlighted.
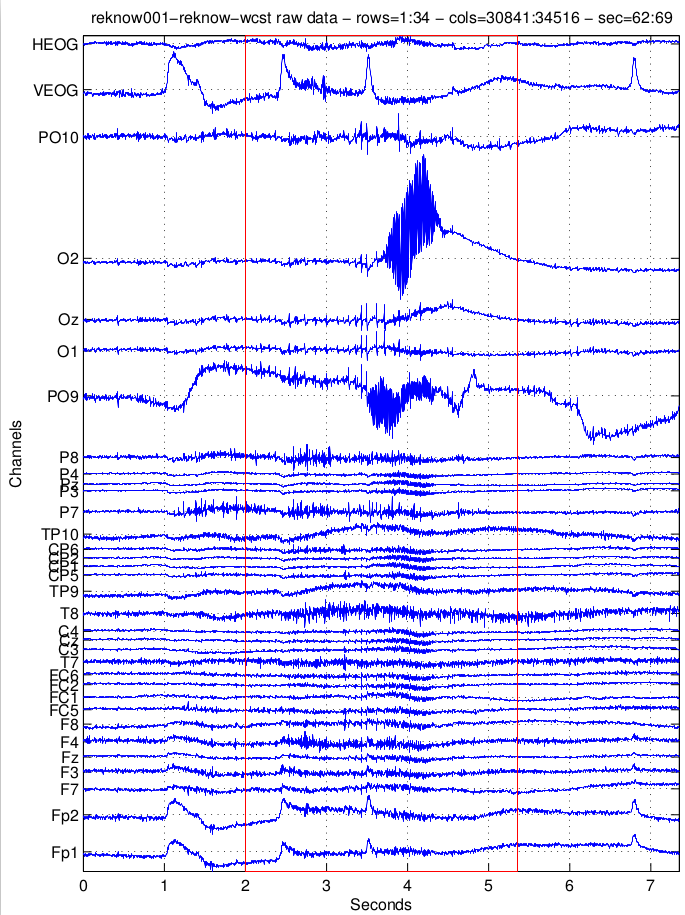
 Figure 2. A segment with major high-frequency noise is highlighted.
 Figure 3. A component selected by the blink detection algorithm (detailed in the CTAP publication).
 Figure 4. Spectra of the data before and after filtering.
 Figure 5. ERPs of blink contaminated data before and after cleaning by component removal.
If CTAP_peek_data() is called twice, before and after some artefact removal operations, then the output can be compared to assess the efficacy of the artefact removal operations. This is illustrated below in Figs 6 & 7.
 Figure 6. A 'peek' at raw data early in the pipeline.
 Figure 7. A 'peek' at raw data after some artefact removal operations in the pipeline.