Zill O'll Infinite #9574
Comments
|
The unbuffered rendering thing is most likely a bloom effect with too high a render resolution. 1x render, or possibly the bloom hack, may help.... but this is just a natural consequence of a higher render resolution. See here for more detail: Higher render resolutions simply have too much detail for bloom effects to render properly. Not sure about the crash with a certain enemy - someone with the game would probably need to get more information. -[Unknown] |
|
As noted in the thread @unknownbrackets mentions, we do have a workaround from some issues: The "Lower resolution for effects" setting. Though depending on what the problem is, that may or may not help. |
|
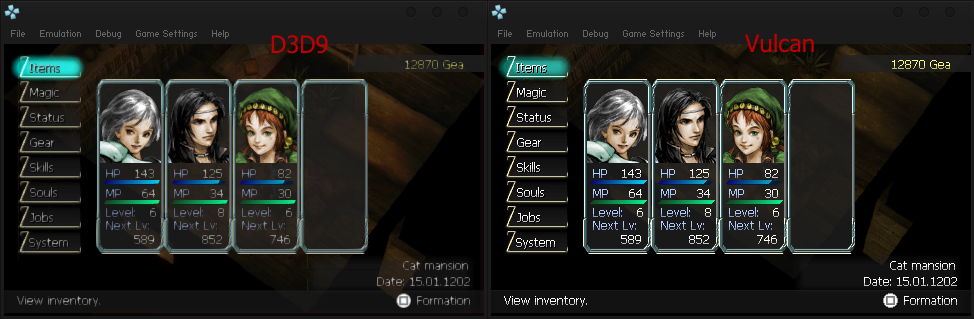
Im responsible from discovering this as the translation hack is my work. that would rule out the rendering resolution suggestion. the blackscreen issue does not (atleast most of the time) appear using D3D9, and seems to be mostly an issue when using OpenGL. D3D11 however instantly crashes ppsspp without any error message whatsoever. i dont know if it's related to the glow / rendering issues above, but what prevents d3d9/11 or openGL to be used on this game is practically this: https://dl.dropboxusercontent.com/s/25243w4zsa5din3/rendering.png d3d9 runs on buffered rendering (the glow can be seen on bottom and right of the screen) and vulcan is unbuffered as it doesnt support buffered at this point. using vulcan is really REALLY high improvement to the way the game looks and is really performing well... but the problem is that using unbuffered rendering with this game makes the save/load menu either blink or completely invisible, which pretty much prevents it from being used. (the game uses psp internal system menu for this, responsible affected module is sceutilitysavedatainitstart.) im surviving myself since i do own a devkit to work on the game with, however my translator does not, and it's a real problem at this moment. would appreciate any help with this. |
|
Ignoring when the game tries to use buffers is a hack - it's expected to break things, since it's skipping emulation of some parts of the PSP. It's mostly a speed hack, because some games use buffers in wasteful ways. The "lower resolution for effects" setting is disabled at 1x, because it can't do anything at 1x. So that's not the cause. Does "Disable slower effects (speedup)" alter the behavior at all (even if it doesn't fix it - what I want to know is if it changes it)? It may be this is a blending operation modern GPUs don't support, and we're trying to simulate. There are cases where we simulate this wrong still, unfortunately. Can you try to identify the draw call where the issue first appears? Remember:
It could be this is an effect that glitches because a clear is not actually written to RAM. I've seen issues from that in a few games, but clearing ram was disabled by default to gain a percent or two of performance. You can try adding the game id to this ini and see if anything changes: Line 106 in 7daab82 As for the black screen, normally a black screen means the game stopped rendering anything: i.e., it crashed. Are you able to confirm if the main game loop is still running? You could also try using the GE debugger after the crash, to see if the game is even attempting to render anything. For the D3D11 crash, a similar issue was recently fixed for Persona 3. Does it still happen in the latest git build? -[Unknown] |
havent tried using the latest git build with d3d11 and did not try the ini file trick yet. will get to those asap. EDIT: tested with cleantoRAM enabled, no effect. still blackscreens |
|
Sorry, I don't have this game so I'm just trying to understand the issues. There are a few separate things here and it seems to have gotten a bit muddled. Here are the issues I'm reading:
So... For 1 (bad effect): This is the one I'm interested in GE debugger data on, because I want to know what effect the game is trying to draw. Or maybe disable slower effects / ClearToRAM might affect this. For 2 (enemy blackscreens): Probably not a rendering issue, especially as confirmed by the GE debugger drawing something. Does the black screen persist even after you LOAD the save game? That would be kinda crazy. If you open the log console, are there any errors? Maybe it's setting the framebuffer incorrectly (there seems to still be something about the latched framebuffer we don't have exactly right, or else timing issues.) For 3 (instant crash): Thanks, looking forward to hear if the fix helps. For 5 (blurry text): Does this happen only in Direct3D 9? If it happens in OpenGL, it's not a half-pixel offset problem. It might be a linear filtering problem (make sure Texture Filtering is set to Auto - try Nearest too.) I might be confused and maybe this is the "bad effect" (sub-issue 1.) It might make more sense to create separate GitHub issues for each issue. -[Unknown] |
|
ok lets try and summarize a bit since i agree it's getting a bit cluttered.
to answer your question: cleartoRAM did not help, and "disable slower effects" did not help or change the behavior in any visible way. i will get you GE data out of it ASAP.
to answer your question. Yes, once the game blackscreens, you can blindly navigate the menus to load a game, regardless of this, the game stays permanently black. Even when loading a different save file on a completely different location in-game the log console does not show anything.
in the picture it can be seen that the text is slightly blurried, and on the right image, it is as it is expected. |
|
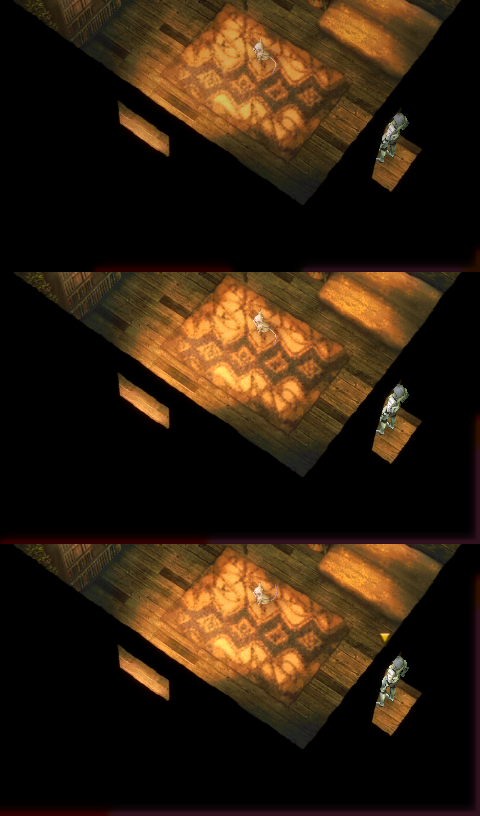
here's a link to GE data from what i think could be the cause of the "glow" the image being rendered here is what happens after the room and objects in the room have been drawn. It looks like a picture of the room is then taken multiple times and applied on the screen, propably for some kind of lighting effects or whatnot, there are several of them with varying size, blurriness and light/dark levels that are being rendered after everything else is done. on the preview image, a white border at the bottom and the right can be seen, matching the "glow" that gets drawn while the game is running. |
|
1 - Okay, that's definitely bloom. Am I correct that the framebuffer has a white border in the bottom and right sides? That looks very likely the cause. It looks as if it may be texturing outside the framebuffer from those screenshots. Hmm. 2 - Got it. But if you were to reset, and load, it doesn't "save" the broken state. I think the Direct3D 11 crash (now that I understand it's only when encountering the enemy) may help here. The Direct3D 11 backend currently does more error validation than the other ones, and it's very likely that an error is tripping. Would you be willing to compile PPSSPP in debug mode (it's easy, and Visual Studio is free), and get a stack trace? It might even tell us what the error is. If you are, someone created a guide here: http://forums.ppsspp.org/showthread.php?tid=5231 Otherwise, maybe someone else has the game and can try it. But, I actually think the Direct3D 11 crash in Persona 3 could be related. It might've caused it to clear texture data potentially - not sure. 4 - Well, to clarify, what's happening here is: Frame 1: Frame 2: The problem is, the game assumes we had buffers, but because the hack is turned on, buffers don't exist. The save screen it rendered before was never kept in a buffer, and can't be reused. Buffers work fine on a real PSP, and they also work fine in "buffered rendering". So techniques like the above work. But the only way to make them work with the speed hack is to actually draw to buffers... which means it would be the same thing as buffered rendering. So we can only fix 4 by deleting the "non-buffered rendering" setting, or making it behave exactly like "buffered rendering". By the way, this is also why it "fixes" issue 1. The issue is being caused by one of those buffers being drawn on top of the screen wrong in some way. Non-buffered rendering is also skipping this effect, and skipping the bug in it. 5 - Strange. The screenshot should really be exactly what's being drawn. I don't know what's happening here, and can't reproduce in the games I have... -[Unknown] |
|
No idea about number 2/3 since it would require playing the game, but the 5th look like it's just using some postprocess, if it differs from what's seen on screenshot I can think only of 2 ways for that to happen:
As for the bloom problem affecting bottom and right part of the screen are caused by slight offset in the image up/left side this causes bottom/right get white(weirdly when I force nearest filtering for that effect the white border turns black, still incorrect, but looks a bit better). Might be some blending issue ~ Blend mode: reverse subtract fixed, fixed with ffffff for a&b is used first to create dark image which is bugged with the border. |
|
1 - it looks like it's a potential culprit but im not emulator dev :P 2 - no, as far as i know it doesnt remember this glitched state (maybe with savestates, never use those so never tried) it simply just stays plack until the emulator is reseted. I will try and get a debug build setup for this or find someone who can do it, and get back to you on that. 4 - i do understand the logic of this, what doesnt fit in my head is why is this the only game that does this. 5 - it's indeed strange, and quite annoying with that. I cant reproduce this on any other game i have either, zill o'll is so far the only title suffering from this. In all cases here, the screenshots were taken with identical settings aside rendereing backend and rendering mode (bufferred for others, unbuffered for vulcan) and only vulcan's output is "correct." edit: well, i went through the hoops to get visual studio and cloned the repo, but cant seem to get it to build. https://www.dropbox.com/s/c1tqc04t5euqcvi/err.txt?dl=0 would be really convenient to get someone else to do the stack trace, since to be honest, i really lack the available time i have for this kind of things. the translation of this game alone eats 500% of my time, and im not even going to the fact that it's only one of 4 im working on :P i will try it again later on though assuming no one else does. |
|
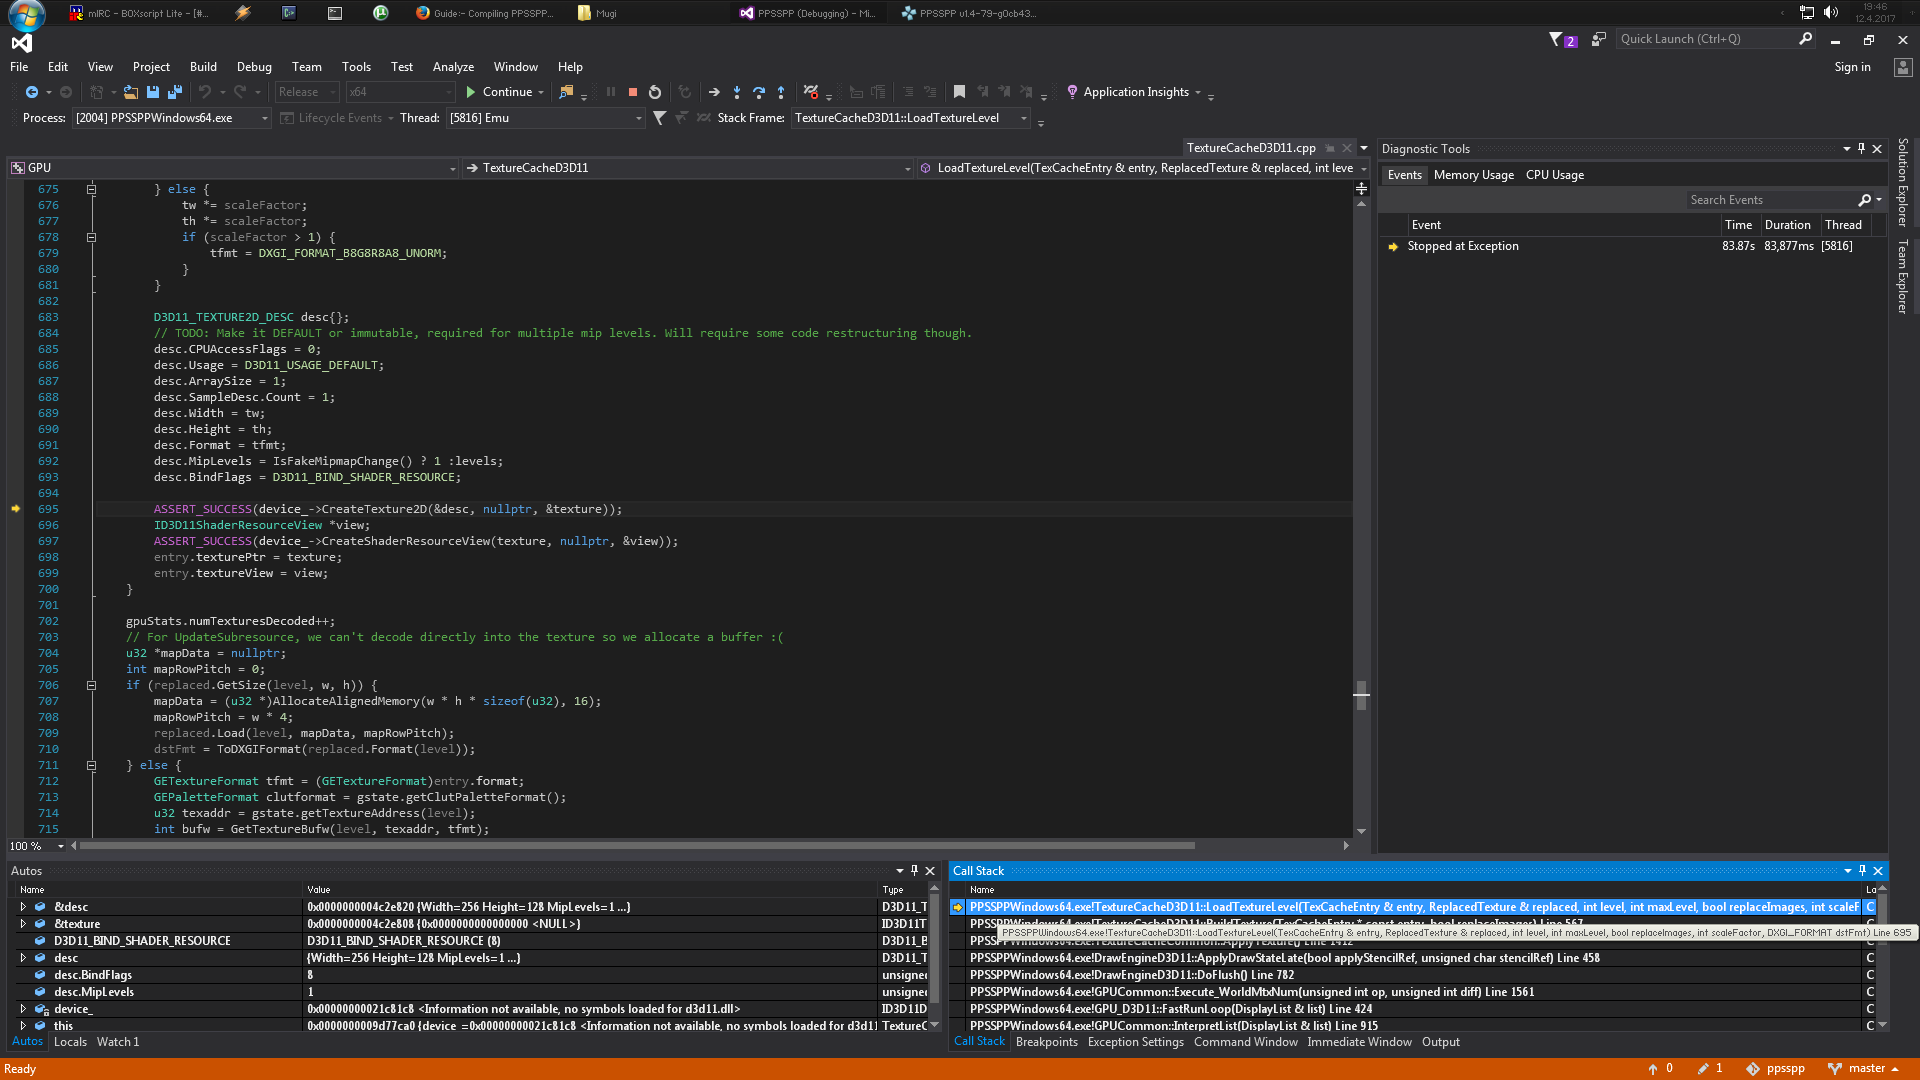
okay, after 2 days of fighting with visual studio i finally got it to compile. either way, here's what it spits out: https://dl.dropboxusercontent.com/s/94hyewgqd068of1/debug.png what exactly from here is what you wanted ? (i can produce this as many times as i want) |
|
Try running in Debug mode (change "Release" in the top dropdown to "Debug") and then look at the "Output" tab in the bottom right - it may show what error occurred that it asserted on. Width/height/levels seem reasonable - not seeing an obvious reason for this crash. -[Unknown] |
|
here you go: D3D11 ERROR: ID3D11DeviceContext::RSSetViewports: Viewport at slot 0 is invalid. Valid Viewport extents are -32768.000000 <= TopLeftX, TopLeftY, (TopLeftX+Width), (TopLeftY+Height) <= 32767.000000, 0.000000 <= MinDepth, MaxDepth <= 1.000000, and MinDepth <= MaxDepth. Your viewport is: (TopLeftX,Y) = (0.000000, 0.000000), (Width,Height) = (480.000000, 272.000000), (MinDepth,MaxDepth) = (1.000000, -0.000015) [ STATE_SETTING ERROR #259: DEVICE_RSSETVIEWPORTS_INVALIDVIEWPORT] D3D11: BREAK enabled for the previous message, which was: [ ERROR STATE_SETTING #259: DEVICE_RSSETVIEWPORTS_INVALIDVIEWPORT ] Exception thrown at 0x000007FEFDB8A06D (KernelBase.dll) in PPSSPPDebug64.exe: 0x0000087A (parameters: 0x0000000000000001, 0x000000000556A578, 0x000000000556C420). Unhandled exception at 0x000007FEFDB8A06D (KernelBase.dll) in PPSSPPDebug64.exe: 0x0000087A (parameters: 0x0000000000000001, 0x000000000556A578, 0x000000000556C420). |
|
Hm, I wonder if that one could really cause a crash when not in debug mode, but could definitely cause black screens on D3D11 at least. Good info, thanks. |
|
it causes a crash in D3D11, but not on D3d9, and it is the exact same spot in the game that starts making the game flicker black and eventually completely and permanently stay black until reseted on OpenGL mode. (from what i saw looking at it with the GE-debugger on a retail build, the root cause of the blackness is that it goes completely apeshit about how and where it draws textures and then just goes "nope.") Im not aware of whether or not it attempts to render anything after going black at all, but i believe it does because a portion of the screen might momentarily flicker with random colors when you move after the game is blackscreened. |
|
Just to be sure, does it not crash in the software renderer? -[Unknown] |
|
actually, it doesn't. this was recorded with D3D9 / Buffered / software rendering. |
|
Ah - sorry. We've made significant improvements to the software renderer in the latest git build. I was wondering in terms of that. Anyway, it's good to know it doesn't crash - so that definitely suggests it's related to a memcpy that's misdetected. -[Unknown] |
|
i'll grab myself a copy and give it another spin when i get time to. well, i pulled the latest source and gave it a go, and from what i managed to see is that it actually ran as intended. i did not see the character glitching or any form of other weird behavior. (D3D11 / Buffered / SW rendering) the problem is that unlike the retail 1.4 build, the latest source with software rendering ran at approximately 0.5 FPS so the test to load a game and instantly enter a fight took me over 20 minutes to archieve. |
|
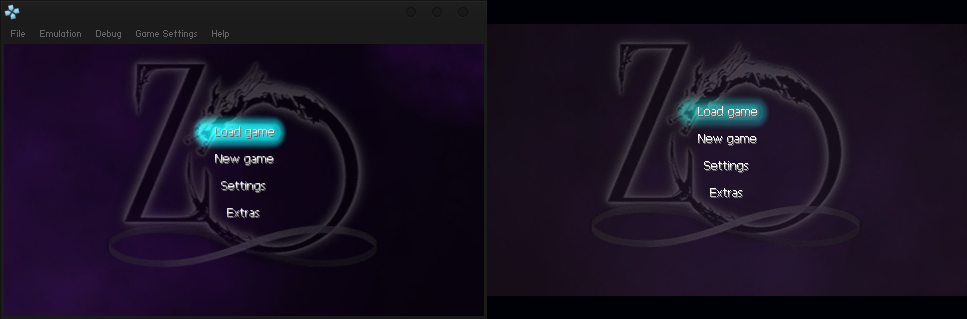
just a heads up guys, i finally figured out what causes the text and textures to get slightly blurred while it should not be. it turns out as suspected afterall, the global settings on nvidia control panel that are set mess up with the screen output of ppsspp and after setting application specific settings for it to disable anisotrophic filtering etc crap, it's now as it should be. im still not sure why this only applied to zill o'll though, but maybe it's just that i never noticed it (the amount of pixel graphics i work with on this game exceeds the usual by large numbers.) either way, good to know in-case someone else runs into this problem. |
|
Ah, yes. Debug mode + software renderer = even worse than terrible performance. I just sprinkle So to recap:
Good to know neither of the two remaining subissues happen with softgpu. This means they can't be HLE issues (HLE operates the same.) They must both be issues with the hardware rendering backends. By the way, 1.4.1 has all the softgpu improvements, etc. Vulkan may soon have buffered rendering support - #9713. -[Unknown] |
|
I'll try and toy with that a little assuming i have to test more things with it, for now i'll just stick to HW rendering since it looks better at the moment anyway :P recap;
as far as i know all configurations now actually match the their screenshots (vram data) so that should be as good as solved. (im suspecting that the anisotrophic filtering was the root cause, but never confirmed it.) |
|
Okay, #9717 should correct the Direct3D9 blur problem. -[Unknown] |
|
it does. that's awesome! |
|
sorry im late for this really, but in the middle of my retardation i suddenly just realized that whatever it is you guys did on the latest git build (v 1.4.1-9-g7d0cfba) also eliminated the bloom glow completely. (tested d3d9 / d3d11 and openGL with buffered, It's completely gone!) |
|
How's this now? |
|
It'd be especially interesting if it doesn't crash or black screen in Vulkan, now that it pretty much supports everything. Removing the Direct3D 9 label since the remaining issue (crash or blackscreen) doesn't happen there. -[Unknown] |
|
sorry for being so late :P the blackscreening when encountering the enemy is now gone regardless, tested using the same save which had a 100% chance to trigger it with earlier builds. the only issue i encountered was when i wanted to test it with another rendering backend is the fact that i cannot change it since emulator simply crashes everytime with no error message whatsoever. I compiled it in both debug x64 and release x64 modes and the behavior appears to be the same. Am i just being retarded here or is this an actual bug. I will test d3d11 as soon as i figure out how to change the backend again xD |
|
nevermind, changed it by hand from ppsspp.ini and gave it a go on d3d11 buffered, still crashes with viewport exception D3D11 ERROR: ID3D11DeviceContext::RSSetViewports: Viewport at slot 0 is invalid. Valid Viewport extents are -32768.000000 <= TopLeftX, TopLeftY, (TopLeftX+Width), (TopLeftY+Height) <= 32767.000000, 0.000000 <= MinDepth, MaxDepth <= 1.000000, and MinDepth <= MaxDepth. Your viewport is: (TopLeftX,Y) = (0.000000, 0.000000), (Width,Height) = (480.000000, 272.000000), (MinDepth,MaxDepth) = (1.000000, -0.000015) [ STATE_SETTING ERROR #259: DEVICE_RSSETVIEWPORTS_INVALIDVIEWPORT] |
|
Not being able to switch sounds like a bug - maybe a separate bug. Are you running with the debugger attached? We try to swap backends without restarting in that case (to keep the debugger attached), but I think AMD doesn't like this. So, the blackscreen/crash doesn't happen in Direct3D 9 and Vulkan, but still happens in Direct3D 11. OpenGL is the same too? The max depth there is -0.000015... we shouldn't be allowing flipped depth in D3D 11, since we use GPU_SUPPORTS_ACCURATE_DEPTH. Maybe not having that flag is why OpenGL has issues, though. I think what could be happening here is that minz may be higher than maxz. But even then, I don't see how we can end up with -0.000015, because it should always offset it upward. Anyway, I guess maybe it shouldn't draw in that scenario - not sure. In GPU/D3D11/StateMappingD3D11.cpp, find: if (depthMin < 0.0f) depthMin = 0.0f;
if (depthMax > 1.0f) depthMax = 1.0f;And add this code before them (we still want those clamps to run after the swap): if (depthMin > depthMax) std::swap(depthMin, depthMax);This isn't a "fix" but it will be interesting if it prevents it from breaking. -[Unknown] |
|
sorry, i completely omitted d3d9 from the earlier test, gave it a spin now, and it did not blackscreen or crash. the crashing on changing the backend happened on all possible ways i tested including running in debugging mode from visual studio and as standalone exe in both debug and retail compilations. im not sure what's the deal with it but i'll leave that for you if you manage to reproduce it, im just changing it by hand from the ini for now for testing (i dont have AMD things on my pc in-case it has any relevance.) as per summary, it still crashes d3d11 but not d3d9 or vulcan (buffered). OpenGL still flickers and eventually blackscreens the game when "little bat" is encountered. i will implement above "test" and see what happens. |
|
okay, it got a bit futher, it did not crash upon encountering the enemy on the field (this is where openGL flickers.) but went into the battle, and then threw this (this is the part where openGL flickers again, if not blackscreening.) D3D11 ERROR: ID3D11Device::CreateTexture2D: Device does not support the format B5G6R5_UNORM. [ STATE_CREATION ERROR #92: CREATETEXTURE2D_UNSUPPORTEDFORMAT] for the sake of reference, the game should not be using BGR565 as the error states it does, i can extract the texture and verify this if need be. |
|
You shouldn't have GPU_SUPPORTS_16BIT_FORMATS, so it shouldn't be trying to use that format... strange. Can you get a backtrace for that one? -[Unknown] |
|
sorry im not too avid on debugging terminology, what'cha mean with backtrace? |
|
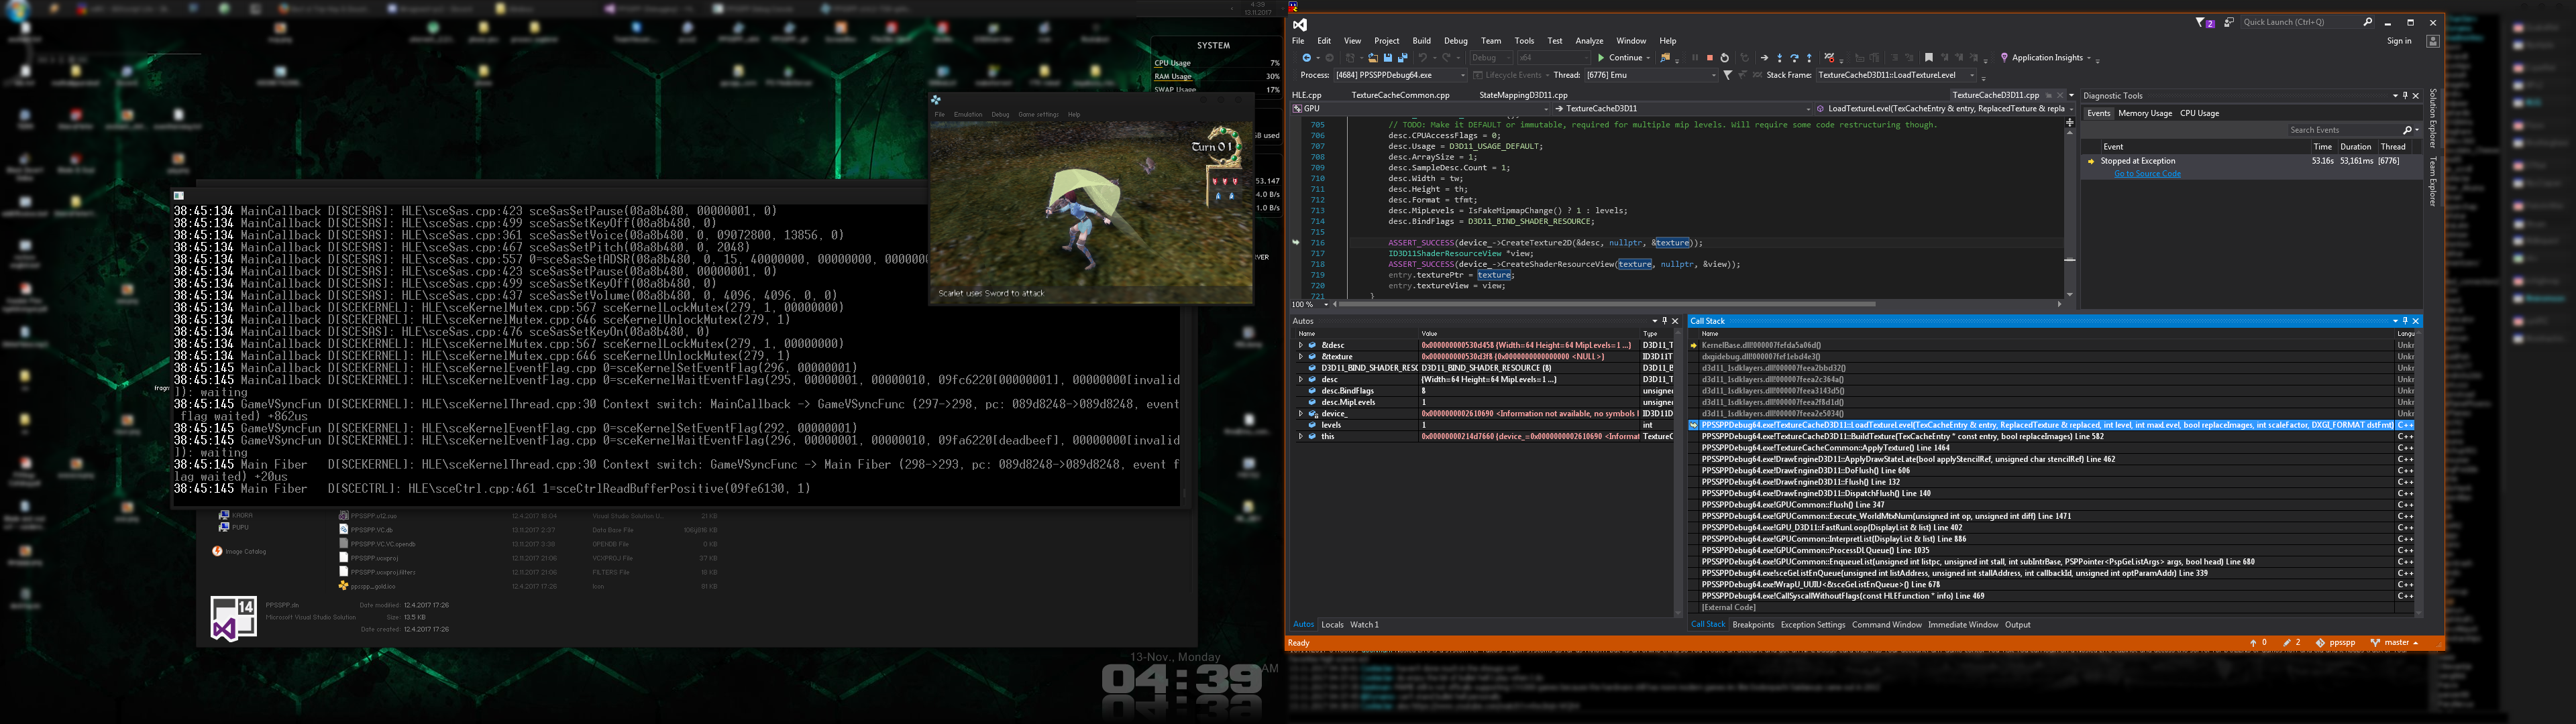
If you run with Visual Studio's debugger attached (F5), then when it crashes select Debug -> Windows -> Call Stack (or press Alt-7.) This shows which function called which function called which function, etc. to cause this error. If you select it and press Ctrl-C, you'll get something like this: This way I can see where the 565 texture is coming from (we create textures in several places.) -[Unknown] |
this i suppose ? here's a pic with the whole thing visible. |
|
Sorry - just to confirm, you're using Windows 7 right? The parameter If you have texture upscaling enabled, it should also force to So I've been at a loss what could cause this to try a 565, unless you're actually on Windows 10 or something. To double check, you could find this code in GPU_D3D11.cpp: if ((fmt4444 & Draw::FMT_TEXTURE) && (fmt565 & Draw::FMT_TEXTURE) && (fmt1555 & Draw::FMT_TEXTURE)) {
features |= GPU_SUPPORTS_16BIT_FORMATS;
}And change it to: if ((fmt4444 & Draw::FMT_TEXTURE) && (fmt565 & Draw::FMT_TEXTURE) && (fmt1555 & Draw::FMT_TEXTURE)) {
features |= GPU_SUPPORTS_16BIT_FORMATS;
ERROR_LOG(HLE, "AWOOGA: Device says it supports 16-bit formats, including 565");
}If that message logs, something funky is up. Otherwise, any chance this has improved in the latest builds? -[Unknown] |
|
well, i dunno where you're supposed to have the message log, but it doesnt show up on log console atleast. interestingly, with the latest build, the crash has gotten a little worse, as now it does not even enter the field, but instantly crashes upon attempting to load it (transition from loading screen to field screen) latest build as is (buffered, D3D11)
latest build with following added to statemappingd3d11.cpp (earlier test) (again d3d11, buffered)
latest test with logging code enabled. (again d3d11, buffered) if ((fmt4444 & Draw::FMT_TEXTURE) && (fmt565 & Draw::FMT_TEXTURE) && (fmt1555 & Draw::FMT_TEXTURE)) {
edit: yeah, tested with a retail build too just in-case and it instantly closes ppsspp upon attempting to transition from loading screen to field screen (where the little bat is) nothing shows up on log console. answering to your first question too, im running windows 7 x64 |
|
Okay, so just for a sanity check, what if you find this line (TextureCacheD3D11.cpp): void TextureCacheD3D11::LoadTextureLevel(TexCacheEntry &entry, ReplacedTexture &replaced, int level, int maxLevel, bool replaceImages, int scaleFactor, DXGI_FORMAT dstFmt) {And add after: dstFmt = DXGI_FORMAT_B8G8R8A8_UNORM;If that doesn't work, what about: desc.Format = tfmt;Replaced with: desc.Format = DXGI_FORMAT_B8G8R8A8_UNORM;I'm trying to understand where this 565 is coming from. It's still the same error message in the Output tab about using 565, right? -[Unknown] |
|
the first piece of code allows the game to run without crashing (see video) just for clarification; this was again running d3d11, buffered i left VS open on the background so that you can see the code change and doublecheck it was what you wanted. and yes, without this (when it crashes) it still says the same old error that the texture format BGR565 is unsupported. |
|
So then, if you revert the file, and replace every instance of Assuming that does fix it, what if you add below this line: desc.Format = tfmt;The following: NOTICE_LOG(G3D, "FEATURE FLAGS: %08x / 16-bit: %08x", gstate_c.featureFlags, gstate_c.featureFlags & GPU_SUPPORTS_16BIT_FORMATS);Which should log to the console. For example, on mine it looks like: FEATURE FLAGS: 530b1511 / 16-bit: 00000000 -[Unknown] |
|
Like i mentioned earlier somewhere, im hardly a programmer, just a hacker, so i dont generally mess with the source of the emu. only changes i've done to the source are the ones you've posted here. and generally i revert those too once they have served their testing. at most, this one is in: at any rate, i reverted the forcing of the BGRA8888 code piece, which allowed the game to run with tons of graphical glitches (the video), and replaced 3 instances of gstate_c.Supports(GPU_SUPPORTS_16BIT_FORMATS) with false (there was a ! in front of them, which i left there) and i added your log code below desc.Format = tfmt; here's a video of the result (d3d11, buffered, running in retail mode) https://youtu.be/c4SET8AJ5as as you see some of the graphical issues from d3d9 made it now to d3d11(ghosting with the bloom effect on the field (look at the trees when im walking around before engaging the monster.)) i believe the ghosting is actually to a point, a feature of the game, but it doesnt really do it that violently with vulcan etc... something's definitely off with it. sans that. it runs, it will not blackscreen, nor crash! awesome |
|
@hrydgard featureFlags starts randomly changing - must be memory corruption or something overwriting part of gstate_c? -[Unknown] |
|
@Kitsu-neechan if you want to try a more advanced debugging technique - First, keep the changes as above ( Next, set a breakpoint on the NOTICE_LOG line you've added. You can do this just by pressing F9. Now for the trick: run the game, and once it hits that line, remove the breakpoint (you can just press F9 again.) Before resuming though, go to Debug -> New Breakpoint (about two thirds down) -> Data Breakpoint... For the address, use Now resume debugging (you can just press F5.) At some point (probably about where it used to crash), it should suddenly break again. Here's where we want the stack trace, just like before. It's very possible you won't have a good-looking stack trace (it'll just have numbers, and no text.) If this happens, select Debug-> Windows (first one) -> Disassembly (second to last.) A screenshot of this MAY help, but if this happens it probably means jit is writing to a bad position and just by luck happens to be corrupting that variable. If we get a good stack trace, it'll hopefully point us right to what's corrupting the memory. -[Unknown] |
|
as you suspected, it broke almost immediately after booting, and removing the break from the log, and setting it to your desired location had it break upon the crash point (transition from loading to field, after loading the save.)
edit: here's the disasm; |
See hrydgard#9574. Seen in Zill O'll Infinite.
See hrydgard#9574.  Seen in Zill O'll Infinite, thanks to Kitsu-neechan for
tracking this down.
|
Nice debugging work :) |
|
thanks, was a pleasure to be of assistance. let me know if there's something further with it. Edit: pulled the latest master and confirmed that the crash and graphical glitching is gone with d3d11 and openGL, Great job guys! cookie and fruit juice for both of you! |
|
How is this looking across backends now? Is the depth thing still an issue - or are we safe to close? -[Unknown] |
|
I'd say it's safe to close now, to my knowledge the only issue remaining now is some stray transparency issues in combat effects when using d3d9, but the rest is as good as padded off. no crashing, no bloom, no blurriness. i dont believe the d3d9 transparency thing is exclusive to this game either, seems to be more like a general thing going on with it. |
|
Ah, that's probably related to dual source blending not working on D3D 9. We already have bugs for that, but I sorta doubt that backend will ever gain proper stencil buffer emulation... Okay, closing. Thanks for confirming. -[Unknown] |
I haven't the game but i found some issues on the net from the fan translators working on it. I don't know if the issue exists on the original files or is caused by the translation. It sounds like it's not.
http://www.romhacking.net/forum/index.php?topic=23164.msg333431#msg333431
Anyway, this is not very useful, but just to let you know since it seems no one did it before.
The text was updated successfully, but these errors were encountered: