dispersion_cal
The initial wavelength solution is based on the OH lines.
Excluding weak and unambiguous lines, about ~250 OH lines are detected in H and ~120 in K. However, most of these lines are doublets, so the number of points meaningful for wavelength solution is about half of them.
The observed sky spectra and the line list from literature is shown in the link below
The spectra are currently wavelength-calibrated using the 2-D polynomial fitting as described below.
Given that there are about 20 orders, number of points per order in ~5 for H. For K, OH lines are only detected in higher orders (short wavelengths) and average number of points (for orders with OH lines) is also similar. Thus, it is not very reliable to derive the wavelength solution for each order.
Below, two approach of 2-D fitting the all the available points is described.
The first approach is to do 2-D polynomial fitting, as in the ecidentify in IRAF. In this case, x-direction is x-pixel coordinates of detected lines and y-direction is its order. The z-value is known wavelength of the lines (multiplied by its order number; see ecidentify for detauls).
Here is an example result for H band.

- Top-left : points are location of OH lines (x-pixel vs. order). The false color image is the interpolated image of (wavelength x order).
- Top-right : residual from the 2-d fitting. Size of the points is proportional to the error (color (blue or red) represents the direction of error)
- Bottom-right : Wavelength errors (in pixel; points from a same order is connected with lines)
For the fitting, Chebyshev polynomials (4th-order for x and 3rd-order for y) are used. The fit residual is generally better than 0.3 pixel.
However, this is somewhat problematic for K band. Since OH lines are not detected in its low orders (longer wavelengths).

An alternative approach is to use the ZEMAX simulation results.
As an first attempt, the ZEMAX simulation results (x, y positions for wavelength, order) was transformed with affine transform to match the identified OH lines.
Affine transform :
- X2 = a X1 + b Y1 + c
- Y2 = d X1 + e Y1 + g
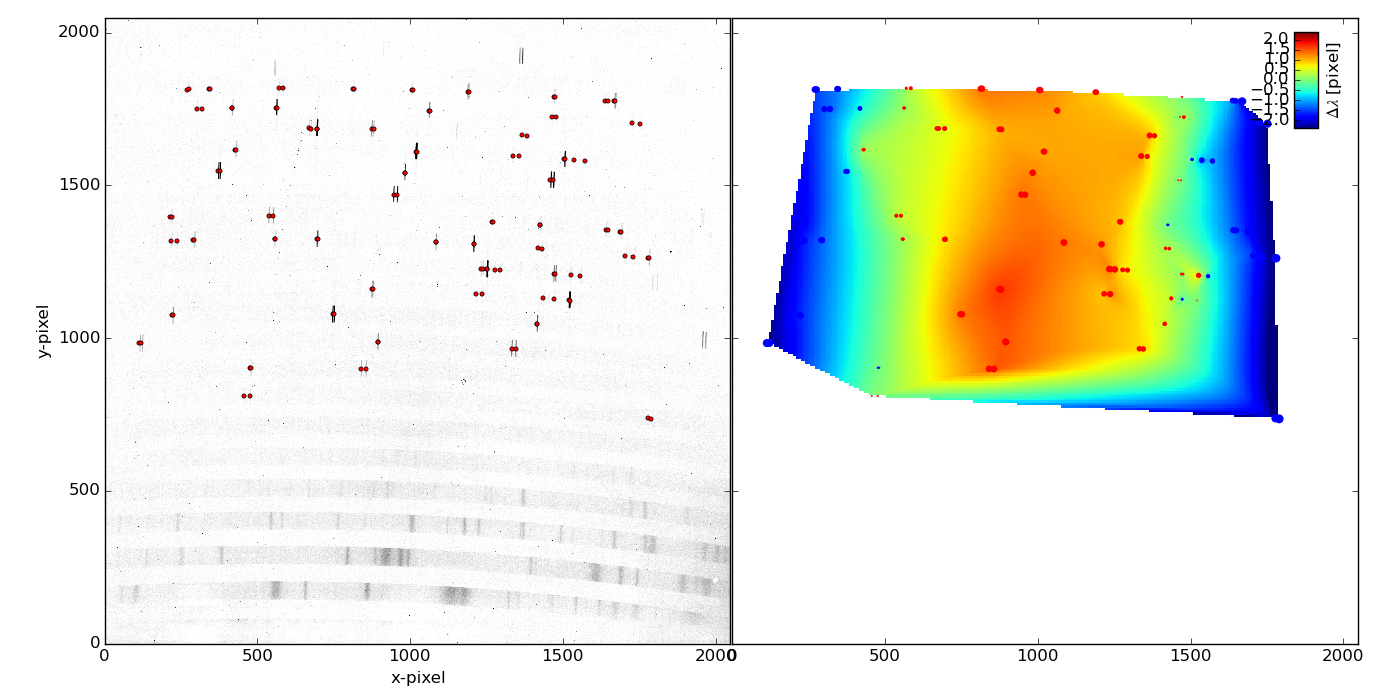
The figure below shows the results for H band.

- left : points used to fit the transform. Background is OH image.
- right : residual difference between transformed ZEMAX results and observed positions.
The residual is generally better than 0.3 pixel.

Introducing higher-order term (e.g., additional zernike polynomials) in the transformation will improve the result.
However, the wavelength coverage (per order) of the current ZEMAX simulation is not wide enough.

The lines are ZEMAX-simulated lines (along the slit center) after applying the fitted affine transformation.
For K band, the residual error is relatively large to a few pixels.

Given that there is a significant pattern in the residual, the error will be significantly reduced with higher-order term.
The coverage of ZEMAX simulation in K band is relatively good. However, a few more higher orders (shorter wavelengths) results will be better.

It would be better if we can have ZEMAX simulation with
- wider wavelength coverage (especially in H)
- covering more order (a few more higher in K)