R template for Russia choropleth map with zoom on europe part
Example:
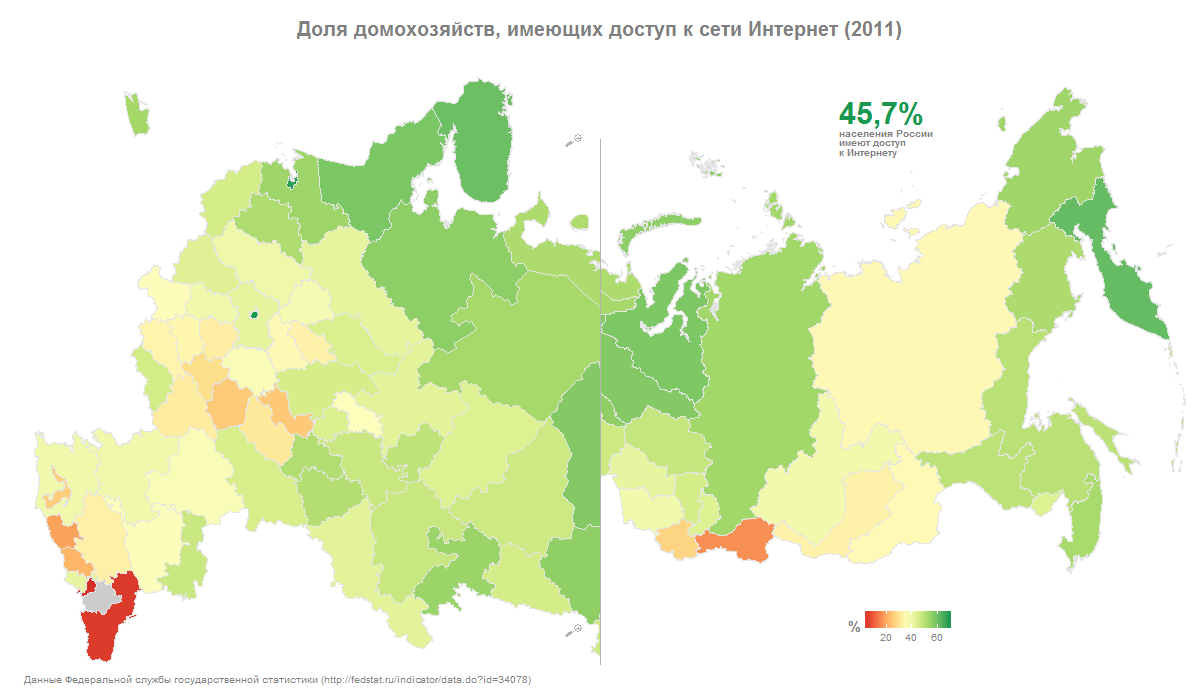
Russia map with zoom on europe part invented by Ilya Birman in 2007.
Later map with zoomed part was used on choropleth by Tanya Misyutina.
mapzoom.R script implements this concept is R.
Geospatial data processing:
Plotting:
-
Specify data, you want to visualise, in stat.csv file. Don't modify 'ID' column, as it used to merge data with geo-polygons. Regions not to be shown at all, should be marked with 'NA' in data column; regions without data (visualised with grey color) require zero values in data column.
-
In 'mapzoom.R' specify working directory. Shape-file 'RUS_adm1.RData' and data-file 'stats.csv' should be placed there:
setwd('/WRITE/YOUR/WD/HERE') -
Specify text variables to be written on choropleth:
- Title;
- Footer;
- Note - significant number and text about it.
# Texts on choroplet map text.title <- 'Internet penetration - households (2011)' text.footer <- 'Russian Federal State Statistics Service data (http://fedstat.ru/indicator/data.do?id=34078)' text.note <- c('45,7%', 'of Russians\nhave internet access') -
Select sequential or diverging palette (alternate should be commented):
# Diverging palette selected # 1. Sequential palette # palette <- colorRampPalette(brewer.pal(9, 'Blues')[3:9]) # 2. Diverging palette palette <- colorRampPalette(brewer.pal(11, 'RdYlGn')[2:10]) -
Specify output file type and name:
png('map.png', width=1200, height=700) -
Run the script.