Creating flame graphs for OpenDaylight
CPU Flame-graphs (link1, link2, link3) have been a particularly valuable tool for us in visualizing OpenDaylight execution profiles from different test scenarios. They allow holistic, interactive and accurate visualization of hot code paths, which helps in quickly identifying and understanding performance bottlenecks.
Their key difference from classic profilers lies in the conceptual and condensed way they present the most common stack traces, i.e. the list of function calls that show the code-path ancestry:
- a stack trace is represented as a stack of boxes, where each box represents a function (a stack frame).
- the y-axis shows the stack depth, ordered from root at the bottom to leaf at the top. The top box shows the function that was on-CPU when the stack trace was collected, and everything beneath that is its ancestry. The function beneath a function is its parent.
- the x-axis spans the stack trace collection. It does not show the passage of time, so the left-to-right ordering has no special meaning. The left-to-right ordering of stack traces is performed alphabetically on the function names, from the root to the leaf of each stack. This maximizes box merging: when identical function boxes are horizontally adjacent, they are merged.
- the width of each function box shows the frequency at which that function was present in the stack traces, or part of a stack trace ancestry. Functions with wide boxes were more present in the stack traces than those with narrow boxes, in proportion to their widths.
- the profile visualized may span a single thread, multiple threads, multiple applications, or multiple hosts. Separate flame graphs can be generated if desired, especially for studying individual threads.
In order to generate flame graphs, you need a profiler that can sample stack traces. For Java applications, there have historically been two types of profilers:
- System profilers: such as Linux perf_events, which can profile system code paths, including libjvm internals, GC, and the kernel, but not Java methods.
- JVM profilers: such as hprof, Lightweight Java Profiler (LJP), and commercial profilers. These show Java methods, but not system code paths.
The ideal would be to have one flame graph that shows it all: system and Java code
together. With recent fixes in the JVM (—XX:+PreserveFramePointer), and using the
perf-map-agent Java agent, one can use Linux perf_events to capture full stack traces,
containing both system code paths and JVM/Java methods.
In the next sections, we will follow option 2 above and use the Java Mission Control (JMC) and Java Flight Recording (JFR) tools to create flame-graphs from OpenDaylight. In future versions of this wiki we will show how to generate mixed mode (system+Java) flame-graphs using Linux perf_events.
We will need the following packages:
- Oracle JDK (for JMC/JFR)
- maven
Download Oracle JDK and extract it e.g. under your home.
Initialize the following environment variables:
export JAVA_HOME=/home/user/jdk1.8.0_91/
export PATH=$JAVA_HOME/bin/:$PATH
export JAVA_OPTS="$JAVA_OPTS -XX:+UnlockCommercialFeatures"Make sure that the java process executes with the -XX:+UnlockCommercialFeatures flag
set above.
Run jcmd to list the Java processes IDs that are eligible for
monitoring:
user@host:~$ jcmd
4132 sun.tools.jcmd.JCmd
2894 org.apache.karaf.main.Main
2894 is the PID of the ODL Java process.
To get help:
user@host:~$ jcmd 2894 helpTo start recording samples, give the following:
user@host:~$ jcmd 2894 JFR.start name=ODL_recording settings=profile
2894:
Started recording 1. No limit (duration/maxsize/maxage) in use.

Use JFR.dump name=ODL_recording filename=FILEPATH to copy recording data to file.
This started a recording named ODL_recording, using a predefined JFR template
named profile suitable for detailed measurements.
To get info about a running recording, run the following:
user@host:~$ jcmd 2894 JFR.check
2894:
Recording: recording=1 name="ODL_recording" (running)
When you think you have run ODL for a sufficient interval, dump the recording and save it to a file:
user@host:~$ jcmd 2894 JFR.dump name=ODL_recording filename=ODL_recording.jfr

2894:
Dumped recording "ODL_recording", 3.5 MB written to:

/home/user/opendaylight/distribution-karaf-0.4.1-Beryllium-SR1/ODL_recording.jfr
Stop the recording if we don't need another dump:
user@host:~$ jcmd 2894 JFR.stop name=ODL_recording

2894:
Stopped recording "ODL_recording".Use jfr-flame-graph to parse the flight recording and extract the
stack traces.
user@host:~$ git clone https://github.com/chrishantha/jfr-flame-graph.git
user@host:~$ cd jfr-flame-graph/
user@host:~$ ./install-mc-jars.sh
user@host:~$ mvn clean install -U
user@host:~$ ./run.sh -f ~/opendaylight/distribution-karaf-0.4.1-Beryllium-SR1/ODL_recording.jfr -o /tmp/output.txt
The stack traces were saved in /tmp/output.txt. Feed this file to the FlameGraph utility:
user@host:~$ git clone https://github.com/brendangregg/FlameGraph.git
user@host:~$ cd FlameGraph
user@host:~$ cat /tmp/output.txt | ./flamegraph.pl > ~/odl_flamegraph.svg
firefox ~/odl_flamegraph.svg
In the following picture we can see a flame-graph produced during an 8-min period where ODL Lithium had a 5000 switches topology connected to it in idle mode (not initiating PACKET_INs). Note that this is a static picture. To navigate interactively, use the corresponding svg file.

Analyzing the flame-graph bottom-up, we identify the regions shown below, each corresponding to different threads/thread-pools, and each contributing in a amount to the total CPU samples. Quick conclusion: 3 threads take 80%+ of the total CPU time:

Use the interactive SVG, and search within it (Ctrl+F) for "statistics". This will highlight the functions whose name contains "statistics". Click on the lower one in order to inspect them in more detail:

From the names of the functions being called, we can get a quick idea of the breakdown of statistics-related messages!
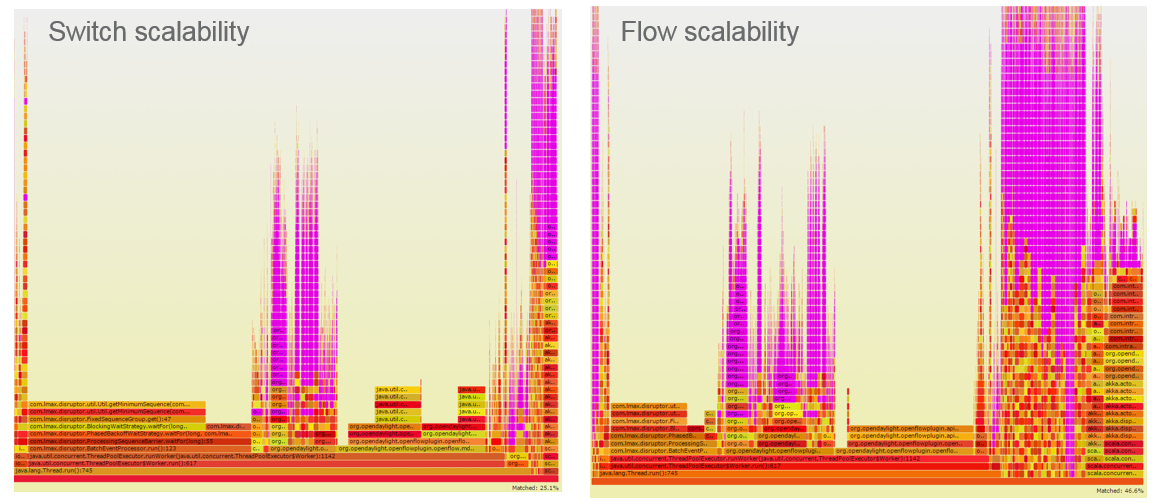
Also, below you can see a comparison between a flame-graph from a switch-scalability test (the one above), and another flame-graph produced from a flow-scalability test. We have searched for functions relevant to datastore operations. The highlighted areas show more intense datastore activity in the flow-scalability case, which is of course expected: