DVID
The distributed, versioned, image-oriented datastore (DVID) (https://github.com/janelia-flyem/dvid) is our primary infrastructure for connectomics data, including grayscale and segmentation label volume data. DVID can be thought of as a HTTP service that provides a high-level connectomics data API that facilitates neuronal reconstruction.
DVID supports many different datatypes. For the Hackathon, we will be mostly concerned with:
- grayscale8 (8-bit EM grayscale data)
- labels64 (64 bit segmentation labels)
- labelgraph (body overlap graph)
- keyvalue (a simple mapping of names to a files)
- roi (a series of small block ids that define a Region of Interest)
If you only need synapse and neuron info files, you can simply get these files from disk (or via a GET HTTP request to a DVID keyvalue instance).
However, you might want to get image or label data for context or to explore anomalies, or neuron overlap information from the labelgraph, or Regions of Interest (ROIs) that precisely define the boundaries of a given neuropil. You can make simple HTTP requests of the DVID server to retrieve this data through a nice command-line program like httpie, a HTTP library in your favorite language, or even as a URL that can be visited with a web browser.
You can browse image or label data with the DVID web viewer described in [Web visualization](Web Tools).
Fly EM will host a DVID server for the duration of the hackathon to serve the relevant data. There is a public DVID server that hosts a subset of the grayscale and segmentation data at http://emdata.janelia.org/.
For documentation on specific datatypes and other links to [Web visualization](Web Tools) tools, navigate to http://DVIDSERVERLOCATION.
To explore the names of the datatypes and other information stored on the dvid server, navigate to http://DVIDSERVERLOCATION/console/#/dashboard. As an example see http://emdata.janelia.org/console/#/dashboard (screenshot below).
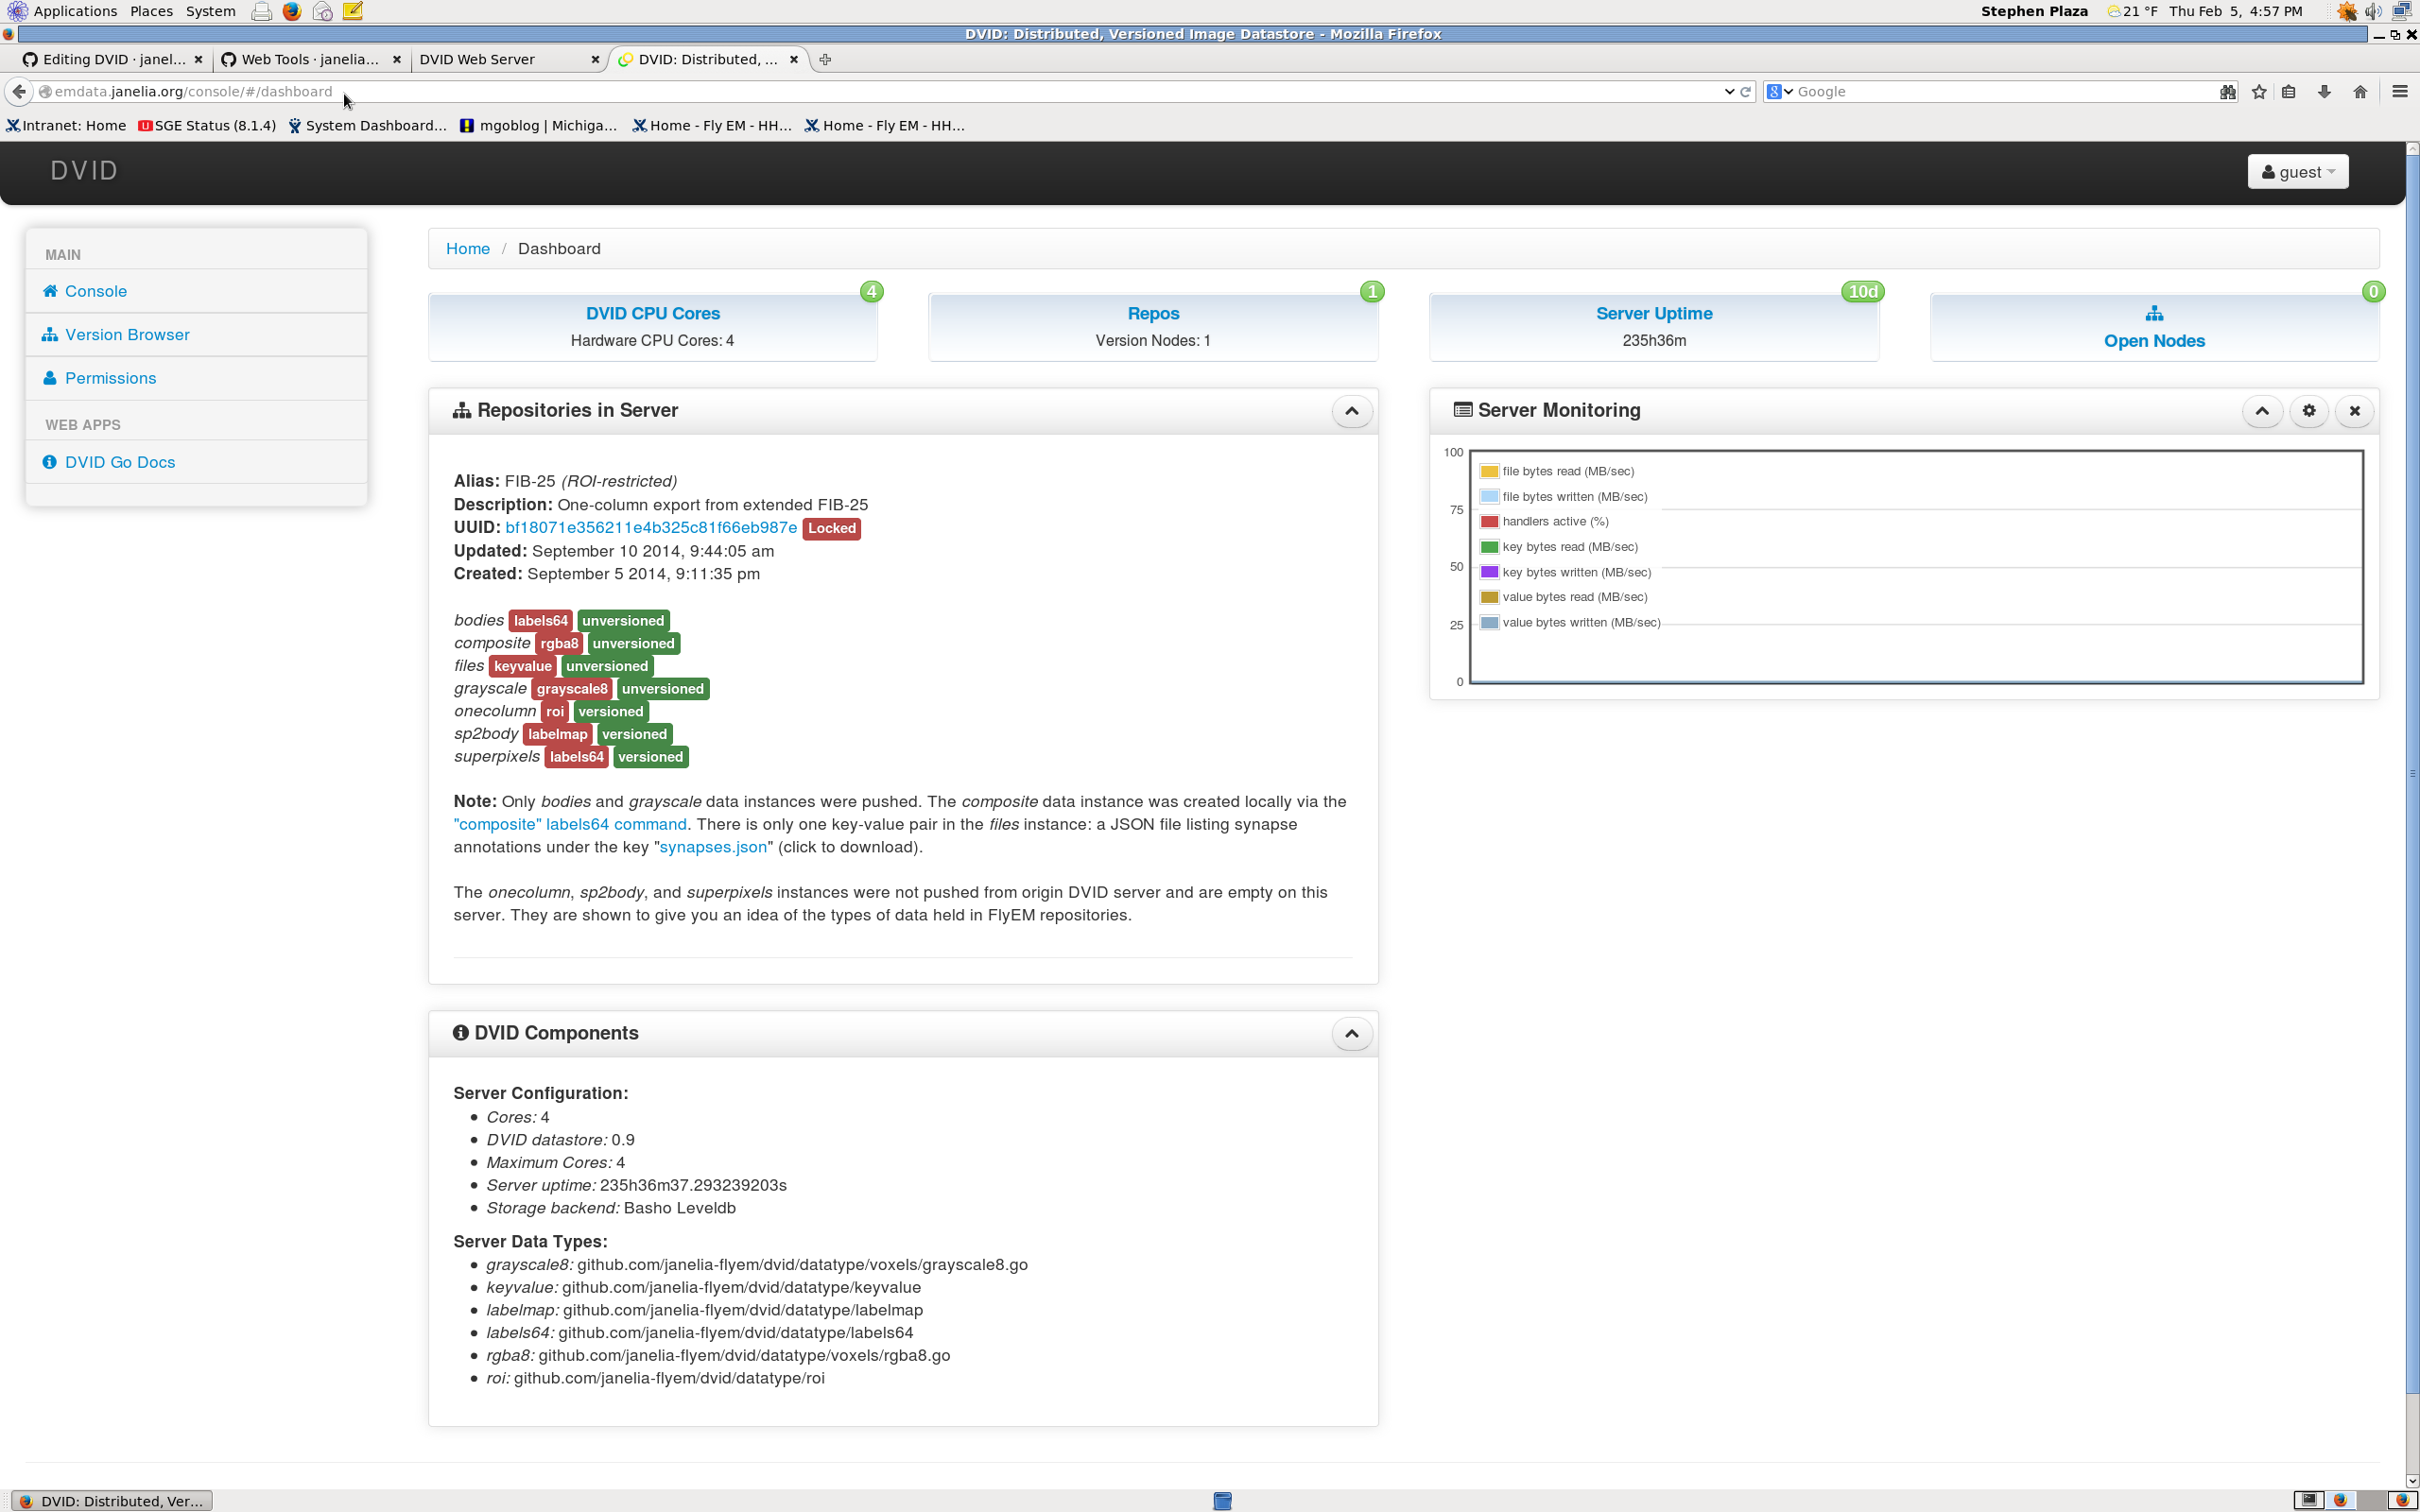
The console shows available repositories (only one here). In this example, the alias is 'FIB-25 (ROI- restricted)'. Underneath this alias is a unique identifier for the repository called a UUID. When using the API, one just needs to use the first few characters of the ID to uniquely identify the proper repository. In this case, 'bf1' will uniquely identify this repo. Note that the consoles shows the available datatypes like 'grayscale' (grayscale8) and 'onecolumn' (ROI) in the repo. It also shows server activity in the 'Server Monitoring' window.
For the hackathon, we will add one repo with the alias "FIB-25" and description "Seven Column Medulla". The server will contain the following datatypes.
- grayscale (grayscale8)
- bodies (labels64): segmentation (body label IDs)
- graphdata (labels64): Contains the synapse and neuron info files in this repo
- skeletons (labels64): Contains the skeletons SWC files in this repo
- bodygraph (labelgraph): Body overlap graph for entire segmentation (given by body label IDs)
- roi_a (roi): Column a ROI
- roi_b (roi): Column b ROI
- roi_c (roi): Column c ROI
- roi_d (roi): Column d ROI
- roi_e (roi): Column e ROI
- roi_f (roi): Column f ROI
- roi_h (roi): Home column ROI
- roi_m1 (roi): Layer 1 ROI
- roi_m2 (roi): Layer 2 ROI
- roi_m3 (roi): Layer 3 ROI
- roi_m4 (roi): Layer 4 ROI
- roi_m5 (roi): Layer 5 ROI
- roi_m6 (roi): Layer 6 ROI
- roi_m7 (roi): Layer 7 ROI
- roi_m8 (roi): Layer 8 ROI
- roi_m9 (roi): Layer 9 ROI
- roi_m10 (roi): Layer 10 ROI
- graph_roi_a (labelgraph): Body overlap for a ROI
- graph_roi_b (labelgraph): Body overlap for b ROI
- graph_roi_c (labelgraph): Body overlap for c ROI
- graph_roi_d (labelgraph): Body overlap for d ROI
- graph_roi_e (labelgraph): Body overlap for e ROI
- graph_roi_f (labelgraph): Body overlap for f ROI
- graph_roi_h (labelgraph): Body overlap for H ROI
- graph_roi_m1 (labelgraph): Body overlap for Layer 1 ROI
- graph_roi_m2 (labelgraph): Body overlap for Layer 2 ROI
- graph_roi_m3 (labelgraph): Body overlap for Layer 3 ROI
- graph_roi_m4 (labelgraph): Body overlap for Layer 4 ROI
- graph_roi_m5 (labelgraph): Body overlap for Layer 5 ROI
- graph_roi_m6 (labelgraph): Body overlap for Layer 6 ROI
- graph_roi_m7 (labelgraph): Body overlap for Layer 7 ROI
- graph_roi_m8 (labelgraph): Body overlap for Layer 8 ROI
- graph_roi_m9 (labelgraph): Body overlap for Layer 9 ROI
- graph_roi_m10 (labelgraph): Body overlap for Layer 10 ROI
The keyvalue datatype is very straightforward to use and can be called easily from the web browser. For instance, to grab skeleton file 005.swc from the 'skeletons' datatype, navigate to:
http://DVIDSERVER/api/node/<UUID>/skeletons/005.swc
This will download 005.swc or result in an error if 005.swc does not exist. If all the keys in a particular key value datatype are desired, one can try call the following:
http://DVIDSERVER/api/node/<UUID>/skeletons/0/z
This will dump all the keys in the ASCII range '0' to 'z' as a list in a JSON file.
(We will provide a main labelgraph ('bodygraph') in DVID and several labelgraphs corresponding to specific ROIs. If one wants to know the volume of a body in a specific ROI (such 'roi_a'), using the labelgraph 'roi_a'.)
The labelgraph supports many types of queries but there are only two HTTP endpoints that should be considered for this hackathon: subgraph and neighbors.
The subgraph endpoint returns body overlap for the bodies specified in a JSON upon request. If no such body list is specified, the entire graph is retrieved with the format as specified in Essential Graph Data:
http://DVIDSERVER/api/node/<UUID>/bodygraph/subgraph
Retrieving the entire graph may take a few minutes. (Note that there may be some very large segments in the m* roi that are not in neuronsinfo or in the skeleton list. These neurons should be ignored as they are not in the core ROI.) To retrieve a subgraph with only vertex 425 and vertex 2343 using Curl, try
curl -X GET DVIDSERVER/api/node/<UUID>/bodygraph/subgraph -d '{"Vertices" : [{"Id" : 425}, {"Id": 2343}], "Edges" : []}'
In python, this can be done with the requests package as:
>> import requests
>> import json
>> jsondata = {'Edges': [], 'Vertices': [{'Id': 8913743}, {'Id': 8913752}]}
>> r = requests.get("http://DVIDSERVER/api/node/<UUID>/bodygraph/subgraph",
     data=json.dumps(jsondata))
>> r.json() # will dump python dictionary
For queries for a single body and its neighbor, call the following:
http://DVIDSERVER/api/node/<UUID>/bodygraph/neighbors/425
This call effectively gives the volume, surface area, and all bodies touching 425. The return format is the same as with the subgraph call. In general, use the subgraph command when information is needed for several bodies.
The ROI datatype defines regions of interest in the seven column medulla dataset. It represents the ROI as a collection of 32x32x32 blocks. This is a tradeoff between the crude resolution when defining the ROI by a simple bounding box versus the large and cumbersome datastructure when defining the ROI precisely at the pixel level.
Finding Points in an ROI
Probably the most relevant query is checking whether a given point (perhaps a synapse or some other location) exists in a given ROI using the ptquery. The user provides a list of points in x,y,z order and receives a list of true/false answers on whether the points exist in the ROI.
To check whether the points [423, 234, 143] and [214, 3256, 211] (given as x, y, z) exist in "roi_a" roi, call the following:
curl -X GET DVIDSERVER/api/node/<UUID>/roi_a/ptquery -d '[[423, 234, 143],[214, 3256, 211]]'
This will return a result like '[false, false]' for example. In Python this would be:
>> import requests
>> import json
>> jsondata = [[423, 234, 143],[214, 3256, 211]]
>> r = requests.get("http://DVIDSERVER/api/node/<UUID>/roi_a/ptquery",
     data=json.dumps(jsondata))
>> r.json() # will dump python dictionary
Retrieving the Entire ROI
DVID allows the user to retrieve the entire ROI as a list of block coordinates in JSON. To improve the compaction of data, the list is run-length encoded in the X dimension. The blocks format returned is in JSON:
[[z, y, xmin, xmax], ...]
For instance, the following could be an ROI:
[[5, 11, 3, 7], [5, 12, 3, 8]]
Here this gives two runs both on Z plane 5. The first run includes blocks 3 through 7 (including 7) for Y=11. The second run includes blocks 3 through 8 for Y=12. Note the order is z,y,x and not x,y,z as for the point query.
Blocks can be fetched from the web browser for ROI roi_a using the roi endpoint:
http://DVIDSERVER/api/node/<UUID>/roi_a/roi