
##Web application for analyzing EM segmentation results against ground truth
This javascript web application provides visualizations for evaluating the quality of large 3D image segmentation against another segmentation or so-called ground truth. Here we consider evaluation computed by DVIDSparkServices that uses the services and interface provided by DVID . Please see DVIDSparkServices documentation for more information about the metrics and stats computed.
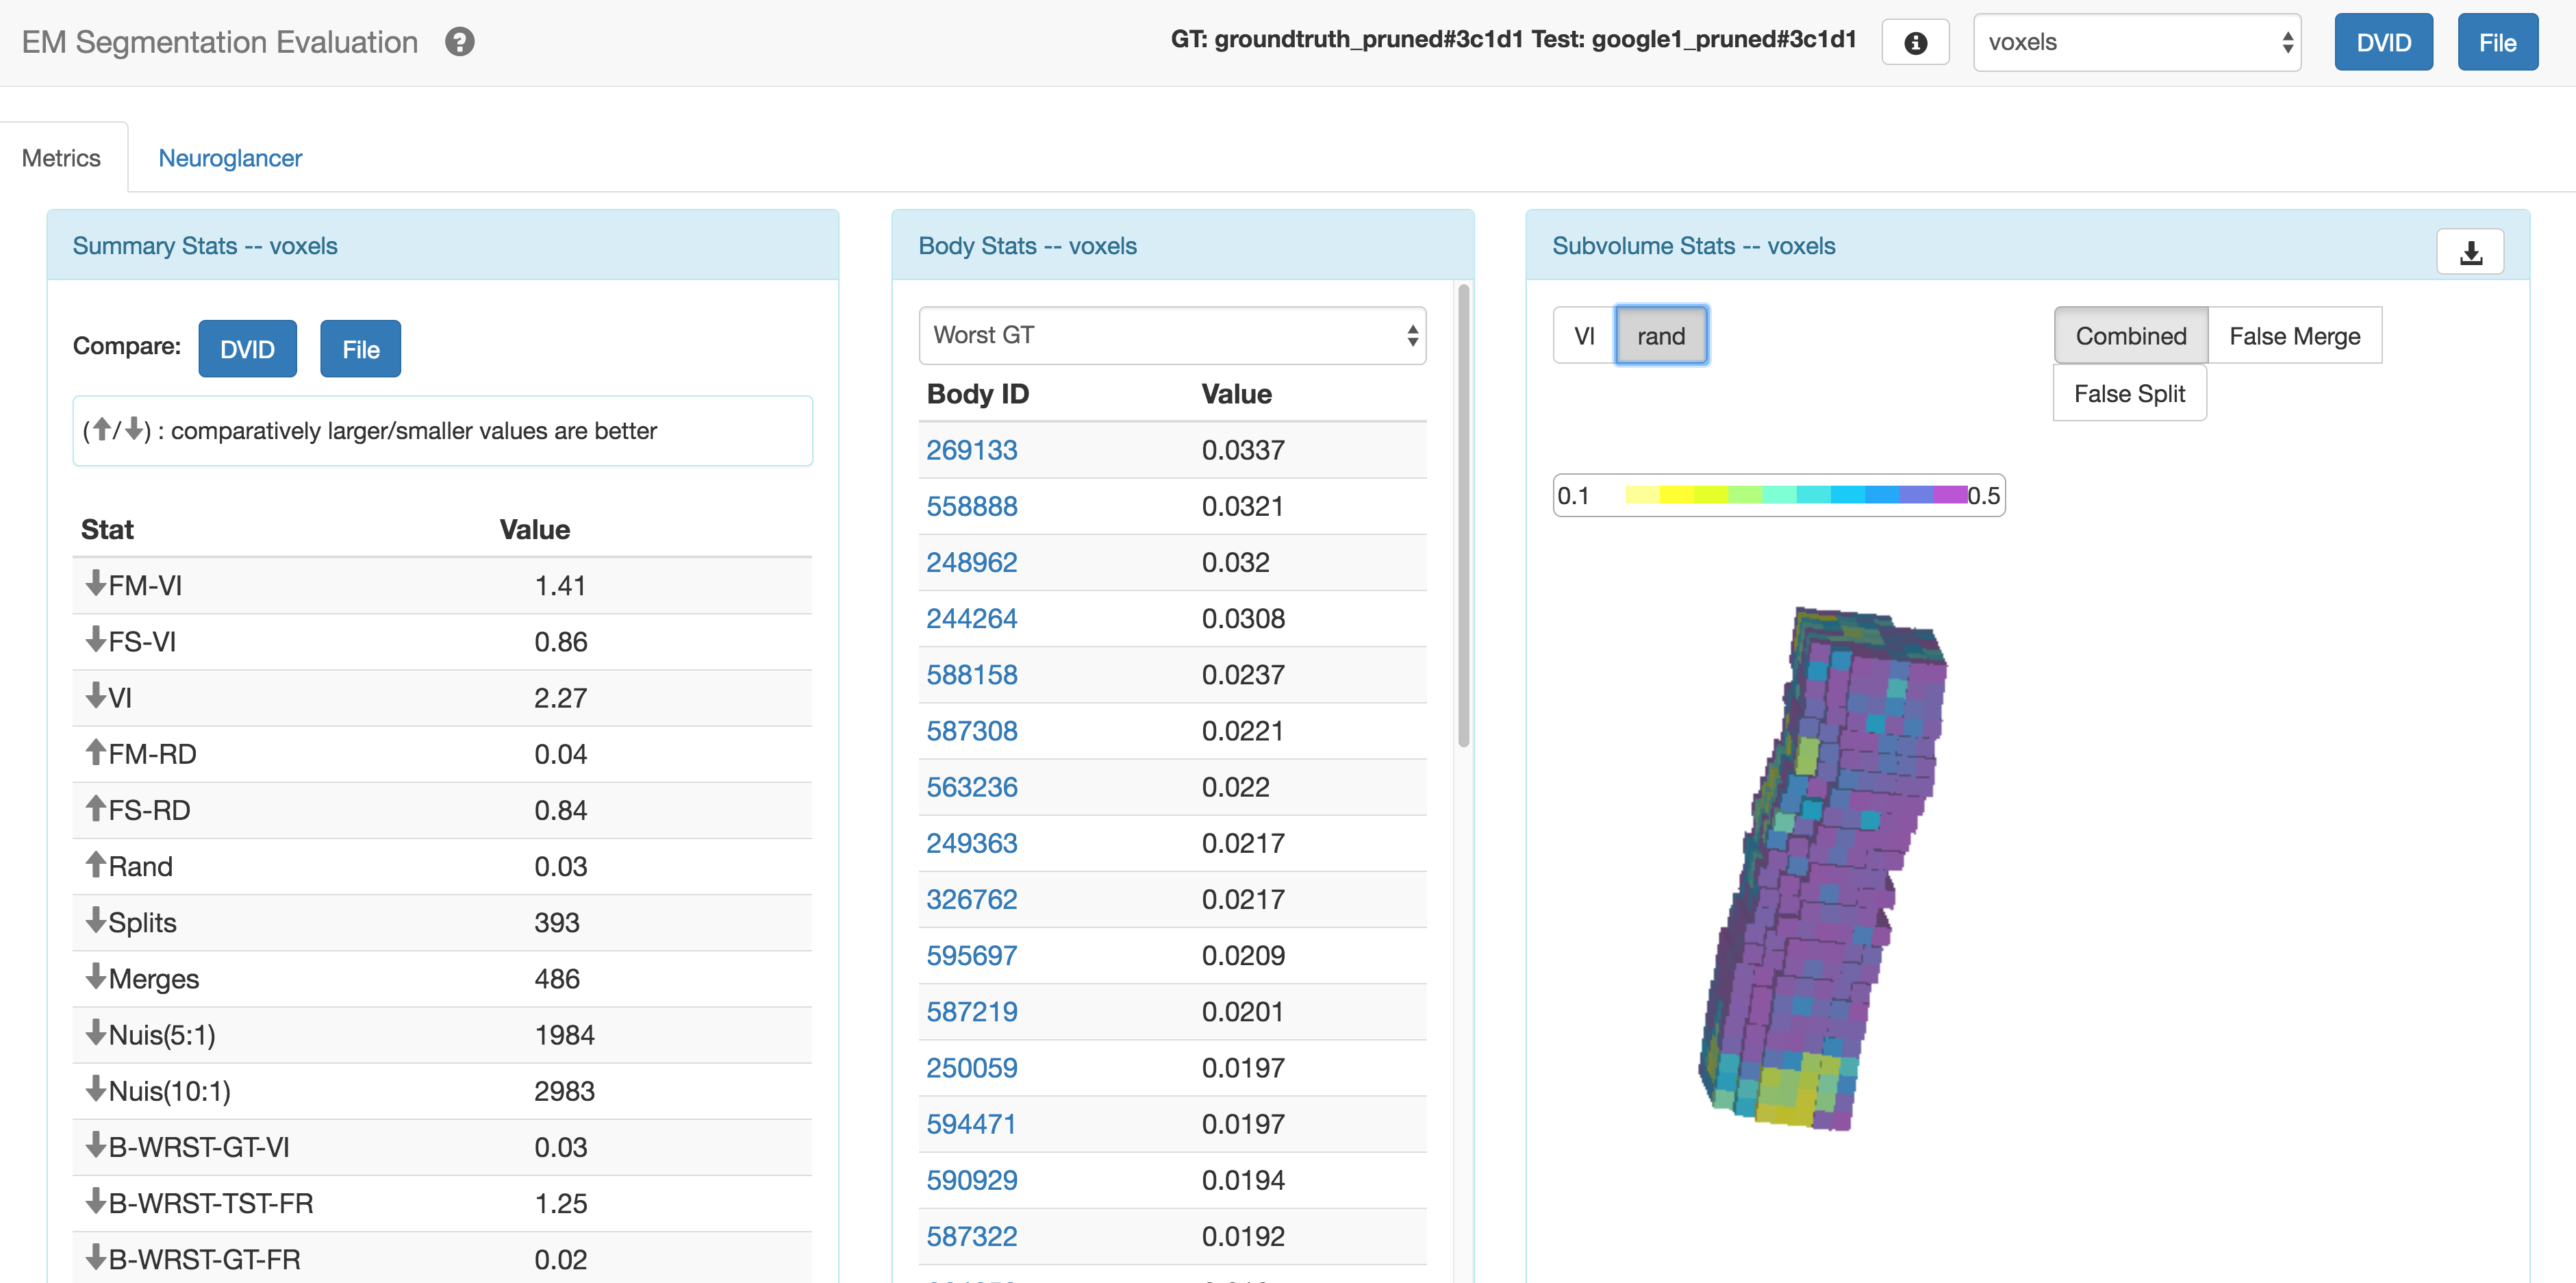
The goal of this app is to provide insight into the places where segmentation succeeds and fails. To this end, it shows information as a function of both the segmented body and the X,Y,Z location, not just as a summary stat. It also shows many summary stats to provide a better basis of a comparison between segmentations. The target domain is to analyze segmentation for EM connectomics (see the Fly EM project). While some of the terminology and application are geared to this domain, some of this effort could be reused in a more general sense.
##Installation and Usage
This application is hosted at http://emanalysis.janelia.org/segmentation_evaluation_console. Example segmentation files can be found in the zipped file, examples.tgz.
For more detailed usage information, consult the corresponding wiki.
##Developer Guide
This is single-page app written primarily in Javascript using Facebook's React to facilitate a component reuse throughout the application. It should be relatively straightforward to add new widgets/componets for visualization. The application, at some point, should allow the user to dynamically select the panels that should be viewable for a given experiment.
###Installation and Usage
% npm install
% grunt
The main bundled js file located in build/js/bundle.js. The application can be included on a webpage by anchoring to a div named 'segeval' and linking build/js/bundle.js and build/neuroglancer/main.bundle.js:
% <div id="segeval"> </div>
On chrome, the application must be served to avoid same-origin policy errors with neuroglancer's web worker thread. Grunt automatically starts a server at localhost:3000, so simply navigate to this location in your browser with grunt running locally to view the application.
###Architectural Notes
As noted, the application makes use of React components. It also leverages 3rd party libraries extensively, such as stack3d for visualizing the subvolumes in the image volume and a fork of neuroglancer for displaying images and segmentations.
This application expects JSON files formatted in the same manner as produced by DVIDSparkServices (this can be downloaded from a DVID server or from file). The file format is still going through rapid revision but it is possible to decouple this viewer from DVIDSparkServices. In general, the file format defines different "types" of comparison each with a set of different metrics/stats for each type.
##TODO
- Continual small UI enhancements
- Make more robust to incorrect user input and deprecated file formats
- Allow download of tables to CSV
- Add new visualization widgets and make general plugin system to allow easy swapping (at both compile time and at the app level)
- Include neuroglancer via browserify or webpack instead of directly committing and including the bundled code