How To Use
-
Launch the Microsoft Excel program.
-
Ensure that the Home tab is selected.
-
Verify that the Stocks section of the ribbon is present.
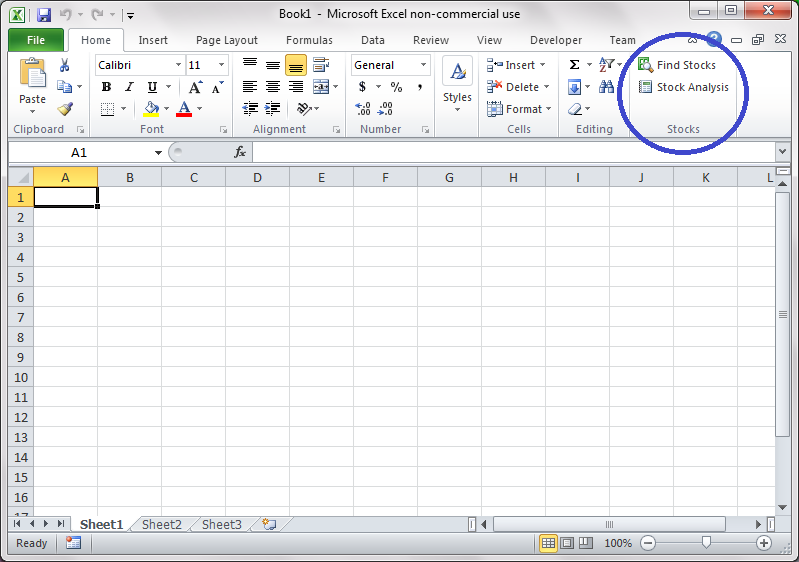
- If Stocks section is not present, refer to Installing the Excel Add-In.
- Press the “Find Stocks” button to begin searching for stocks.
-
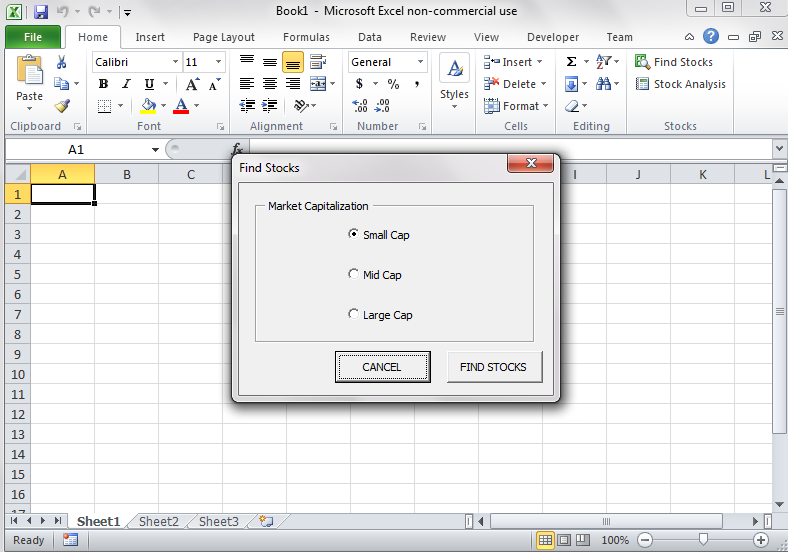
Select the capitalization of stocks to search for.
- Small Cap stocks are companies with a market capitalization between 250 million and 2 billion.
- Mid Cap stocks are companies with a market capitalization between 2 billion and 10 billion.
- Large Cap stocks are companies with a market capitalization between 10 billion and 100 billion.
-
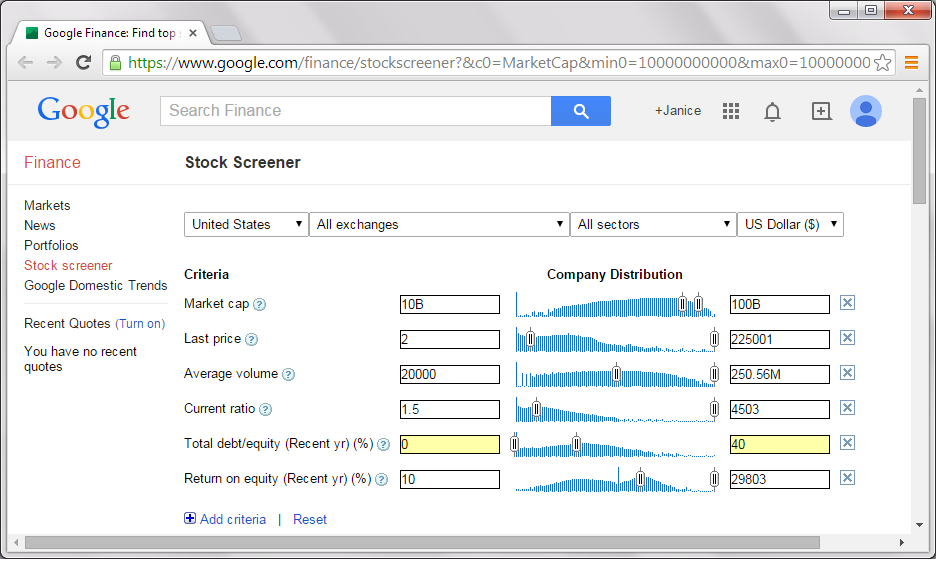
Press FIND STOCKS button to search for stocks. The internet browser will launch and navigate to Google Stock Screener with the predefined search criteria.
-
The stock screener will yield a list of stocks that fit the defined requirements.
-
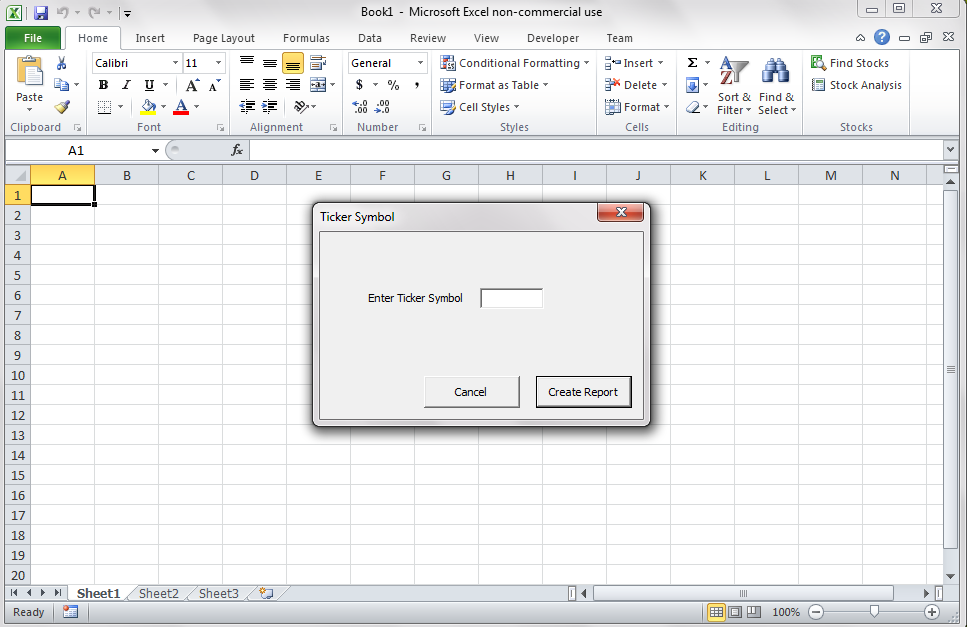
Press the “Stock Analysis” button to begin analyzing a stock.
-
The Ticker Symbol dialog box will appear.
-
Enter the Ticker Symbol for the company to be evaluated and press the “Create Report” button.
-
The Excel status bar will indicate the current status of the application. It will navigate to Google Finance, navigate to the company page, and acquire the financial statement information.
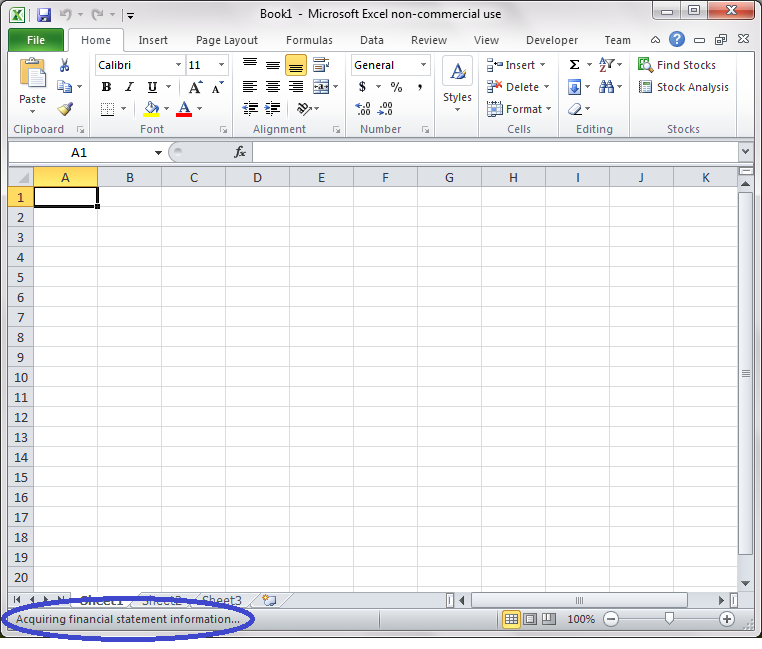
- Once the data is acquired, several worksheets will be generated:
- Income Statement
- Balance Sheet
- Cash Flow Statement
- Summary
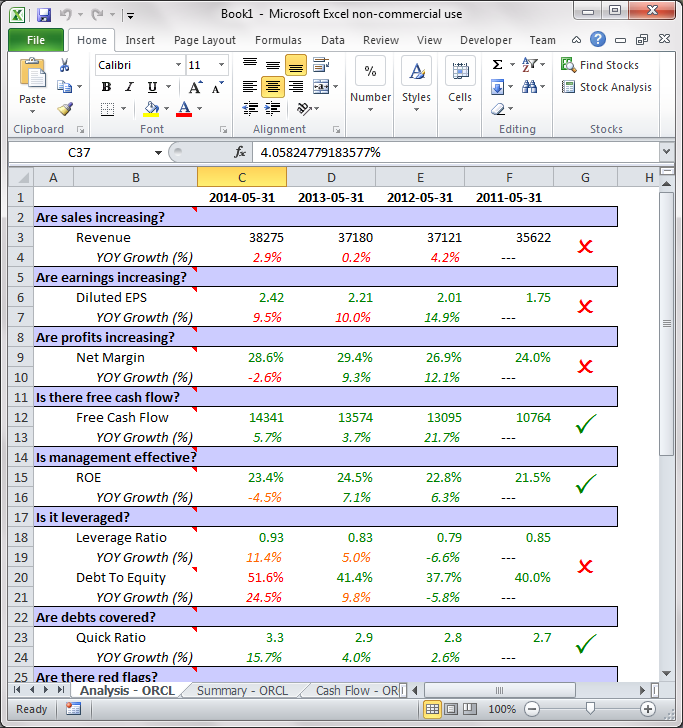
- Analysis
- The analysis statement will contain a 9-point checklist used to perform stock analysis.
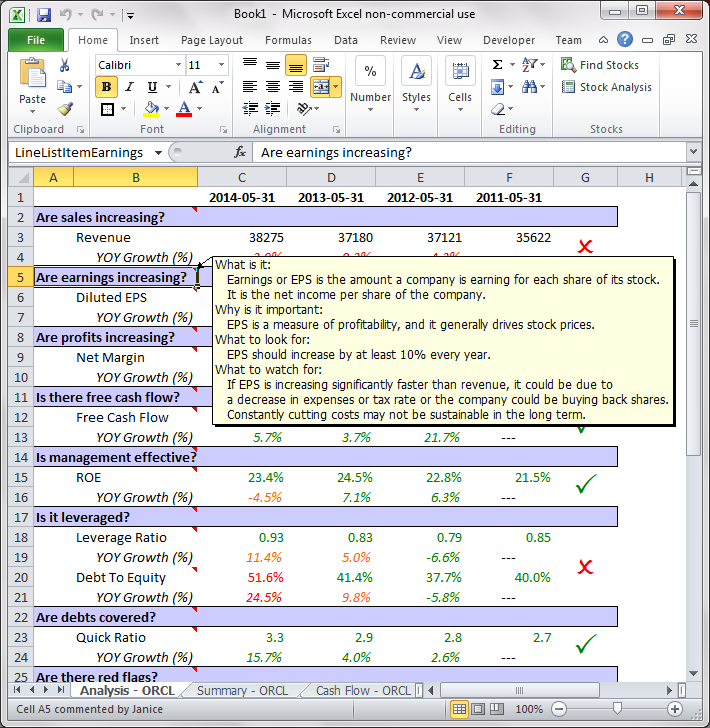
- Hovering over each checklist criteria provides additional information:
- What is it – description or definition of the criterion
- Why is it important – explanation of why it is included in the checklist
- What to look for – explanation of requirements for passing
- What to watch for – description of other factors that affect criteria
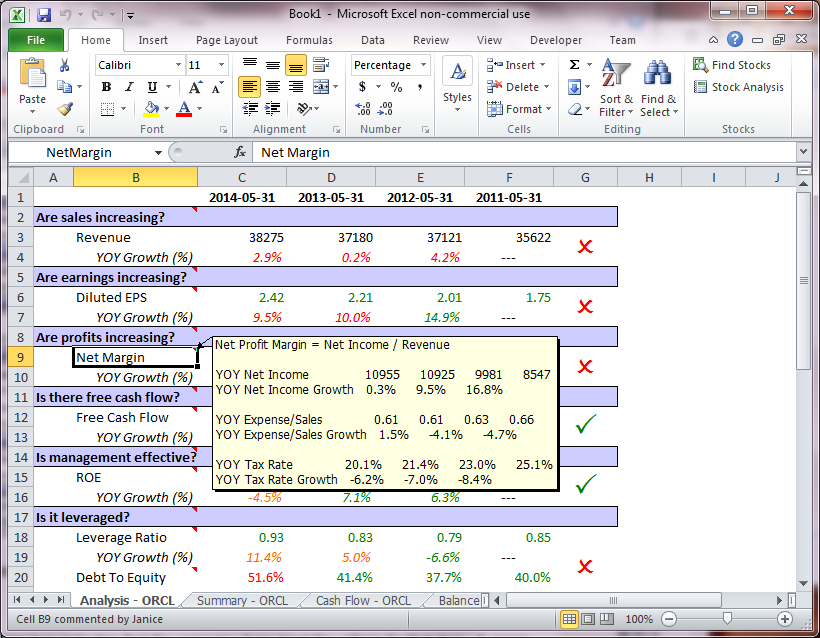
- Hovering over the items in the checklist provides additional data.
-
A red ‘X’ on a checklist item indicates that the company does not meet the criteria for that item. A green check indicates the company passes the criteria.
-
Green text indicates that the data and calculated values pass the required criteria. Orange text indicates caution, which means it may need further investigation. Red text indicates where the criteria are not met.